Chemical enrichment in isolated barred spiral galaxies.
Abstract
To investigate the role of bars in the chemical evolution of isolated disc galaxies, we performed a series of 39 gas dynamical simulations of isolated barred and unbarred galaxies with various masses, initial gas fractions, and AGN feedback models. The presence of a bar drives a substantial amount of gas toward the central region of the galaxy. In the most massive galaxies, this results in a violent starburst, followed by a drop in star formation resulting from gas exhaustion. The time delay between Type Ia and Type II supernovae explosions means that barred galaxies experience a rapid increase in in the central region, and a much more gradual increase in . In unbarred galaxies, star formation proceeds at a slow and steady rate, and oxygen and iron are produced at steady rates which are similar except for a time offset. Comparing the abundance ratios in barred and unbarred galaxies with the same central stellar mass , we find in barred galaxies an enhancement of in , in , and in . The enhancement is in excellent agreement with observations from the SDSS. The initial gas fraction has very little effect on the abundance ratios in barred and unbarred galaxies, unless the galaxies experience a starburst. We considered AGN-host galaxies located near the bottom of the AGN regime, , where AGN feedback dominates over supernovae feedback. We found that the impact of AGN feedback on the central abundances is marginal.
keywords:
ISM: abundances – galaxies: active – galaxies: evolution – galaxies: spiral – stars: formation1 INTRODUCTION
In the Cold Dark Matter cosmological scenario of structure formation, present-day galaxies result from the merger of smaller galaxies, and from accetion of intergalactic matter. These processes can greatly affect the chemical properties of the resulting galaxies. There is evidence, both observationally (Kewley et al., 2006, 2010; Ellison et al., 2008a; Rupke et al., 2010b; Rich et al., 2012; Sánchez et al., 2014) and through numerical simulations (Di Matteo et al., 2009; Montuori et al., 2010; Rupke et al., 2010a; Perez et al., 2011; Sillero et al., 2017) that major mergers (progenitors with mass ratio ) cause low-metallicity gas to flow toward the centre of the galaxies. This lowers the central abundances of metals, flattens the radial metallicity gradient, and could potentially explain why some massive galaxies fall below the observed mass-metallicity relation (Ellison et al., 2008a; Kewley et al., 2010; Scudder et al., 2012).
While some galaxies might experience major mergers and significant accretion up to the present epoch, others, in particular galaxies located in low-density environments, might complete most of their mass assembly at higher redshift. If, at that point, the mass gained by mergers and accretion becomes negligible, and tidal perturbations induced by encounters with other galaxies also become negligible, the galaxies can be considered as isolated. Hopkins et al. (2010) have used an analytical approach to determine under what conditions galaxies can be considered as isolated. Using multi-zoom cosmological simulations, L’Huillier et al. (2012) showed that galaxies can experience a wide range of mass assembly histories, with some galaxies growing all the way to the present, and others completing their mass assembly before redshift .
If a galaxy completes its mass assembly before the present, its subsequent evolution will be essentially secular. The physical processes driving secular evolution differ from the ones involved during mergers. While, in both cases, the flow of matter toward the centre of galaxies drives the chemical evolution, the origin of this flow is different. Simulations of merging galaxies show that the mass ratio and orbital geometry are the main factors determining the evolution and the resulting chemical abundances and distributions. In isolated galaxies, secular evolution will depend on intrinsic properties of the galaxy, both structural and kinematic, the most important one being the presence of absence of a bar. The torque exerted by a bar transports angular momentum from the inner to the outer regions of the galaxy (Debattista & Sellwood, 2000; Kim & Stone, 2012; Lokas et al., 2014; Seidel et al., 2015), leading to a redistribution of the gaseous and stellar component (Gadotti & dos Anjos, 2001; Grand et al., 2015). Gas flows from the outer to the inner regions of the galaxy and accumulates in the central region (Combes & Gerin, 1985; Combes & Elmegreen, 1993; Maciejewski et al., 2002; Regan & Teuben, 2004; Baba et al., 2010; Masters et al., 2012; Kubryk et al., 2015). This accumulation of gas can cause an increase in star formation (Devereux, 1987; Martin, 1995; Martinet & Friedli, 1997; Alonso-Herrero & Knapen, 2001; Hunt et al., 2008; Coelho & Gadotti, 2011), chemical enrichment (Friedli et al., 1994; Friedli & Benz, 1995), and AGN activity (Shlosman et al., 1989; Shlosman & Noguchi, 1993; Heller & Shlosman, 1994; Combes, 2003; Jogee, 2006).
To assess observationally the effect of bars on the secular evolution of isolated galaxies, we must choose an observable physical property that is predicted to be affected by the presence of bars. This could be the SFR, chemical abundances in the gas phase, chemical abundances in the stellar phase, abundance gradients, or AGN luminosity. We then compare barred and unbarred galaxies to look for variations that would result from the presence of the bar. However, these various quantities can vary greatly both among barred and unbarred galaxies. This leads to the issue of pairing, that is, determining which barred and unbarred galaxies should be compared to one another. To make meaningful one-to-one comparisons, one must select galaxies that are physically similar, except for the presence of the bar. Ideally, one would like to compare galaxies with the same total mass, or equivalently the same rotational velocity. However, this information is often not available. Instead, one must use a proxy such as the stellar mass, baryonic mass, or magnitude.
While several observational studies indeed show increases in SFR, metallicity, and AGN activity in barred galaxies, others have yielded conflicting results, suggesting that the details of the various physical processes involved are not fully understood. Several observational studies of the SFR in barred galaxies found no increase (Pompea & Rieke, 1990; Martinet & Friedli, 1997; Chapelon et al., 1999; Willett et al., 2015) or an increase only in early-type spiral galaxies (Ho et al., 1997; James et al., 2009). Cheung et al. (2013) showed that the specific star formation rate (SSFR) is anti-correlated with the presence of a bar.
Observations of central metallicities in barred galaxies have also yielded conflicting results. For the gaseous component, Henry & Worthey (1999) and Dutil & Roy (1999) compared barred and unbarred galaxies with the same magnitude , and found that in general barred galaxies have flatter metallicity gradients and lower central metallicities than unbarred ones. Considère et al. (2000) did a similar study, and found that bars have little impact on the star formation history and chemical evolution of starburst galaxies, and suggest that the bars in their sample are too young. More recently, Kaplan et al. (2016) selected eight spiral galaxies from the VENGA survey, and found that isolated barred and unbarred galaxies exhibit similar metallicity profiles up to large radii. Ellison et al. (2011) studied the SFR and gas metallicity in the central region of barred and unbarred galaxies, as captured by the 3 arcsecond SDSS fibre. The SDSS aperture size corresponds to a radius of approximately at . By comparing barred and unbarred galaxies with the same central stellar mass , they found that the SFRs of barred galaxies are enhanced by compared to unbarred galaxies, but only for galaxies with . In contrast, the central gas metallicity is enhanced by in barred galaxies, at all stellar masses. However, Cacho et al. (2014) also studied barred galaxies in the SDSS and found no significant differences in metallicity. These authors argue that differences in sample selection and metallicity indicator explain the discrepancy between there results and those of Ellison et al. (2011).
The metallicity of the stellar component has received less attention. Moorthy & Holtzman (2006) and Pérez & Sánchez-Blázquez (2011) compared barred and unbarred galaxies with the same rotational velocity or velocity dispersion, and found an enhancement in stellar metallicity in barred galaxies, though the differences might be too small to be statistically significant. The study of Coelho & Gadotti (2011); Cacho et al. (2014), and Sánchez-Blázquez et al. (2014) found no significant differences between barred and unbarred galaxies.
These observational results illustrate the complexity of the chemical evolution of galaxies. Numerous factors must be accounted for, including galaxy mass, morphological type, gas mass fraction, bar-strength and size, and the role of AGN. Numerical simulations can help shed a light on the physical processes driving chemical evolution and how they are affected by the presence of a bar. In a previous paper (Martel et al. 2013, hereafter Paper I) we presented a numerical study of star formation and metallicity enrichment in barred and unbarred galaxies. We showed that there is no direct connection between central star formation and central metallicity, because an important fraction of the central metals were produced by stars that formed outside of the central region. In two follow-up papers (Carles et al. 2016, hereafter Paper II; Robichaud et al. 2017, hereafter Paper III), we presented more extensive numerical studies of the star formation history in barred and unbarred galaxies, focussing on the effect of the total mass and initial gas fraction (Paper II) and the effect of feedback resulting from the presence of a central AGN (Paper III). In this paper, we are revisiting the simulations presented in Papers II and III, this time focusing on the history of chemical enrichment. This provides us with a much more extended set of simulations than the one previously used in Paper I (39 vs. 4). Our goal is to investigate the difference in metal production and distribution in barred and unbarred galaxies, the dependence on stellar mass, and the role played by AGN feedback, to ultimately understand the interplay between the various physical processes responsible for chemical enrichment in disc galaxies.
The remainder of this paper is organised as follows: In section 2, we describe our numerical algorithm. In section 3, we present our suite of simulations. Results are presented in section 4. Summary and conclusions are presented in section 5.
2 THE NUMERICAL ALGORITHM
2.1 The GCD+ algorithm
The simulations were performed using the numerical algorithm GCD+ (Kawata & Gibson, 2003; Rahimi & Kawata, 2012; Barnes et al., 2012; Kawata et al., 2013, 2014; Williamson et al., 2016). GCD+ is a particle-based, gas-dynamical algorithm specially designed to simulate galactic chemodynamical evolution. The algorithm tracks the dynamics and chemical evolution of the stellar and gaseous components, taking into account star formation, supernova feedback, metal enrichment, and diffusion. The algorithm was recently modified to include a subgrid treatment of AGN accretion and feedback (Paper III).
In all simulations, the gravitational softening length is fixed at . Smoothing length are adjusted such that each gas particles has neighbours. However, we impose a minimum smoothing length of , to be consistent with the resolution of the gravitational field. In simulations with a central AGN, the smoothing length of the particle representing the central black hole is adjusted such that the black hole has particles within its zone of influence.
2.2 Supernova feedback and chemical enrichment
In GCD+, the gaseous and stellar components are represented by gas particles and star particles, respectively. Each star particle represents an entire population of stars of a particular mass range. Different star particles represent stars of different mass ranges, and together they reproduce a Salpeter (1955) initial mass function (see Kawata et al. 2014 for details). When stars reach the end of their life, they deposit energy and metal-enriched gas into the surrounding gas. The algorithm calculates the amount of energy, and the mass and composition of the ejecta. That energy and ejecta is then deposited onto the gas particles located within one SPH smoothing length of the star particle. We calibrate the supernova feedback using the parameters given in Rahimi & Kawata (2012): each SN produces an energy , with only 10% of that energy contributing to feedback; the remainder is lost through radiation.
The algorithm include chemical enrichment from Type II and Type Ia SNe, using the yields tabulated from Woosley & Weaver (1995) and Iwamoto et al. (1999), respectively. We include the elements H, He, C, N, O, Ne, Mg, Si, and Fe. Hydrogen and helium are primordial elements that are produced primarily during the big bang. Carbon, nitrogen, oxygen, neon, magnesium, and silicon are produced by the explosion of massive stars in the form of Type II SNe. The lifetime of these stars being very short (5 to ), the delay between star formation and -element enrichment of the ISM is also very short (Tsujimoto et al., 1995). Iron is produced primarily by Type Ia SNe, whose progenitors have lifetimes of order , and therefore there is an important delay between the time when star formation takes place and the time when the ISM is enriched in iron.
We note that star particles inherit the metallicity of the interstellar gas out of which they form. Hence, the code keeps track of the metallicity both in the stellar and in the gaseous components. In this paper, we focus on the metallicity of the gaseous component, which we will simply refer to as “the metallicity.”
2.3 AGN feedback and dynamics
Feedback from a central supermassive black hole is a recent addition to GCD+, which was described in Paper III. We refer the reader to Wurster & Thacker (2013) and Paper III for details. In this implementation, the accretion rate onto the supermassive black hole is calculated analytically, using the Bondi accretion rate (Hoyle & Lyttleton, 1939; Bondi & Hoyle, 1944; Bondi, 1952), with an upper limit imposed by the condition that the accretion rate should never exceed the Eddington luminosity.
With this accretion rate, the mass of the black hole increases continuously during the course of the simulation. However, the GCD+ algorithm imposes a numerical constraint on the black hole mass: it can only be a multiple of the mass of the gas and star particles. To handle this situation, the mass of the black hole is represented by two values, a dynamical mass , and an internal sub-grid mass . The sub-grid mass is calculated using the analytical accretion rate, and its value is used to calculate the accretion rate itself, and the strength of the AGN feedback. The dynamical mass is used for the calculation of the gravitational field. In order to maintain a quasi-equality between the two masses, the dynamical mass increases discontinuously with time, by accreting gas particles which are then removed from the calculation. The mass accreted is used to calculate the amount of feedback energy that will be deposited into the surrounding ISM. That energy is divided evenly amongst all gas particles in the vicinity of the black hole, using a combination of thermal and kinetic feedback (see, e.g., Barai et al. 2014).
3 THE SIMULATIONS
The simulations were described in Papers II and III. In Paper II, we presented simulations of barred and unbarred galaxies of various masses and initial gas fractions, without AGN feedback. In Paper III, we presented simulations of massive barred and unbarred galaxies, with and without an AGN. These papers focused on the star formation history of galaxies. In this paper, we revisit these simulations, this time focusing on the metallicity evolution. This section presents a brief description of the simulations. For a more detailed description, we refer the reader to Papers II and III.
3.1 Initial conditions
Initial conditions are generated using the technique described in Grand et al. (2015). For each simulation, we first specify an initial stellar mass . The initial gas mass and dark matter mass are then determined using the scaling relations of Bell et al. (2003), Cox et al. (2006), and Moster et al. (2010), respectively. The proportion of stellar and gaseous mass is then adjusted for some of the runs which are either gas-poor or gas-rich (see Table 1 below). We assume a static dark matter halo described by a NFW profile with a concentration parameter . For barred galaxies, we use . For unbarred galaxies, we use , which has the effect of suppressing the bar instability.
The stellar and gaseous components are represented with equal-mass particles. In the initial conditions, the stellar and gas particles form axisymmetric discs with exponential surface density profiles. The scale length and scale height of the stellar disc are fixed by observational constraints (see, e.g., Shen et al. 2003). The scale length of the gas disc is twice as large as the one of the stellar disc. The scale height of the gaseous disc is determined by the condition of hydrostatic equilibrium. Particles are given an initial velocity equal to the circular velocity at their location.
Both discs are given an initial metallicity gradient, using
| (1) | |||||
| (2) |
where is in kpc. elements are initially present in the stellar component only. We modify the metallicity of each particle by adding a gaussian scatter of to create a local dispersion of their abundances. The star particles are assigned an initial age using an age-metallicity relation . This approach is somehow ad hoc since isolated galaxies of different masses might have had different abundance profiles when they complete their mass assembly and enter their secular evolution regime, not to mention possible variations amongst galaxies of a given mass. For these reasons, we focus on the changes of abundances during the secular evolution regime. A similar argument was made in Sillero et al. (2017).
Finally, for simulations with AGN feedback, the particle representing the central black hole is located at the centre of mass of the galaxy. The black hole masses (dynamic and subgrid) are initialised at .
3.2 Runs and parameters
The parameters of the simulations are listed in Table 1. Galaxies O–I are taken from Paper II. The second, third, and fourth column give the initial stellar mass, initial gas mass, and dark matter halo mass, respectively. The fifth and sixth columns indicate whether a bar will form by instability, or bar formation will be prevented by the use of a dark matter halo with a high concentration parameter. For most combinations of physical parameters, we simulated a barred and an unbarred galaxy. For instance, we will refer to the two galaxies A as “galaxy A barred” and “galaxy A unbarred.” The seventh, eighth, and ninth columns give the initial number of star particles, gas particles, and the initial gas fraction, respectively. Note that the high-mass galaxy I unbarred was included in the set of simulations in order to have an unbarred galaxy that has, at late time, a central stellar mass similar to that of galaxy H barred.
Galaxies , , , and are also taken from Paper II, and have the same initial stellar mass as galaxies D, but different initial gas masses, and therefore different initial gas fractions.
| Galaxy | barred | unbarred | Colour | ||||||||
| O | 4.00 | 1.72 | 265 | ✓ | ✓ | 52 501 | 22 546 | 0.300 | Purple | ||
| A | 5.00 | 2.04 | 299 | ✓ | ✓ | 66 584 | 27 244 | 0.289 | Magenta | ||
| B | 6.30 | 2.45 | 341 | ✓ | ✓ | 85 121 | 33 078 | 0.279 | Blue | ||
| C | 7.90 | 2.92 | 389 | ✓ | ✓ | 108 210 | 40 008 | 0.269 | Cyan | ||
| D | 10.00 | 3.51 | 450 | ✓ | ✓ | 138 869 | 48 749 | 0.259 | Green | ||
| E | 12.50 | 4.18 | 519 | ✓ | ✓ | 175 774 | 58 748 | 0.250 | Dark green | ||
| F | 15.80 | 5.02 | 609 | ✓ | ✓ | 225 010 | 71 426 | 0.241 | Lime | ||
| G | 20.00 | 6.03 | 726 | ✓ | ✓ | 288 333 | 86 901 | 0.231 | Orange | ||
| H | 25.00 | 7.17 | 872 | ✓ | ✓ | 364 460 | 104 583 | 0.222 | Red | ||
| I | 50.00 | 12.30 | 1848 | ✓ | 752 656 | 185 430 | 0.197 | Black | |||
| 10.00 | 2.50 | 450 | ✓ | ✓ | 138 869 | 34 717 | 0.200 | Purple | |||
| 10.00 | 2.98 | 450 | ✓ | ✓ | 138 869 | 41 480 | 0.229 | Blue | |||
| 10.00 | 4.10 | 450 | ✓ | ✓ | 138 869 | 50 721 | 0.290 | Lime | |||
| 10.00 | 4.70 | 450 | ✓ | ✓ | 138 869 | 65 350 | 0.319 | Red | |||
| 58.00 | 13.80 | 2 306 | ✓ | ✓ | 514 541 | 122 694 | 0.192 | Black/Redc | |||
| 58.00 | 13.80 | 2 306 | ✓ | 514 541 | 122 694 | 0.192 | 0 | 0 | Blue | ||
| 58.00 | 13.80 | 2 306 | ✓ | 514 541 | 122 694 | 0.192 | 0 | 0.1 | Green | ||
| 58.00 | 13.80 | 2 306 | ✓ | ✓ | 514 541 | 122 694 | 0.192 | 0 | 0.2 | Red | |
| 58.00 | 13.80 | 2 306 | ✓ | 514 541 | 122 694 | 0.192 | 0.5 | 0.1 | Cyan | ||
| 58.00 | 13.80 | 2 306 | ✓ | 514 541 | 122 694 | 0.192 | 0.5 | 0.2 | Lime | ||
| 64.90 | 6.90 | 2 306 | ✓ | 575 888 | 61 347 | 0.096 | Dark green | ||||
| 64.90 | 6.90 | 2 306 | ✓ | 575 888 | 61 347 | 0.096 | 0 | 0.2 | Dark green | ||
| 68.35 | 3.45 | 2 306 | ✓ | 606 561 | 30 674 | 0.048 | Purple | ||||
| 68.35 | 3.45 | 2 306 | ✓ | 606 561 | 30 674 | 0.048 | 0.5 | 0.2 | Purple |
a All masses in units of .
b Time in Gyr when AGN accretion and feedback is turned on.
c The colour red is used for galaxy barred in some figures of section 4.5, as indicated in the captions.
Galaxies – are taken from Paper III. We added the bullet to their name to identify them. These galaxies all contain a central AGN except galaxies barred, unbarred, , and .111In these simulations, we include the black hole particle of mass , but turn off accretion and feedback. The tenth column of Table 1 gives the time when AGN accretion and feedback is turned on, and the eleventh column gives the fraction of energy feedback that goes into kinetic energy, the remainder going into thermal energy. These galaxies have the same dark matter halo mass and the same total baryonic mass . Galaxies – have an initial gas fraction consistent with the relations of Bell et al. (2003) and Cox et al. (2006), while galaxies and are “gas-poor” and galaxies and are “very-gas-poor.” Note that in Paper III galaxies unbarred and unbarred were named K and L, respectively.
Finally, the last column of Table 1 indicates the colours that are used in the figures to identify the various runs.
4 RESULTS
4.1 Central properties
4.1.1 Star formation rate
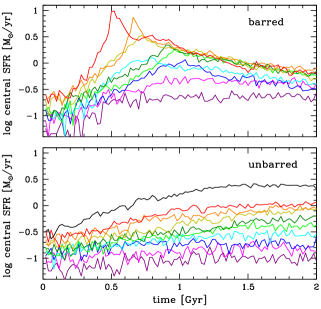
Figure 1 shows the central SFR in galaxies O – I as a function of time, where the central region is defined as a region of radius (these results were presented in greater detail in Paper II, but we review the SFR properties here for context). All of the galaxies start with a low central SFR. In barred galaxies, the central SFR rapidly increases as gas flows inwards along the bar, peaking at Gyr before dropping away or plateauing at later times. For more massive galaxies, the peak is earlier and more dramatic. Such a starburst is not present in the unbarred galaxies, and the central SFR steadily increases as gas slowly flows toward the central region.
4.1.2 Metal abundances in the gas phase
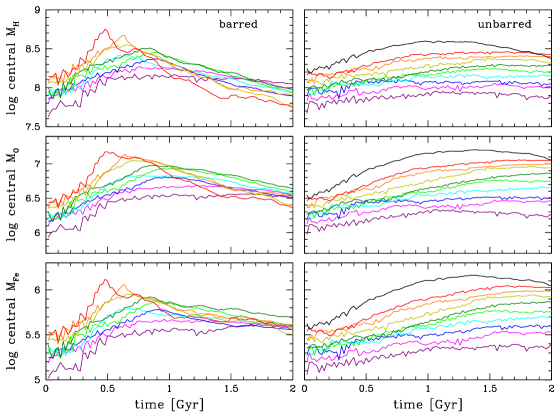
Fig. 2 shows the evolution of the central hydrogen mass , oxygen mass , and iron mass in galaxies. This is an extension of Fig. 6. in Paper II, which showed only the central hydrogen mass for the same simulations. Here we find that the central oxygen and iron masses follow a similar evolution to the central hydrogen mass. In the barred galaxies, all the masses of all three elements increase as gas flows inwards, reaching a peak at Gyr before decreasing through consumption by star formation. This depletion slows as gas is consumed and star formation is reduced. The more massive galaxies reach a higher peak masses, but are depleted more quickly due to their rapid star formation. At late times, the most massive galaxies have a smaller central metal mass than some of the less massive galaxies.
Again, unbarred galaxies show a much smoother evolution. The mass of all three elements steadily increases, and the values increase with the mass of the galaxy. The only exception is the very-massive galaxy I (black lines). The very high SFR in this galaxy results in gas starvation at late times, causing a drop in the masses of all three elements.
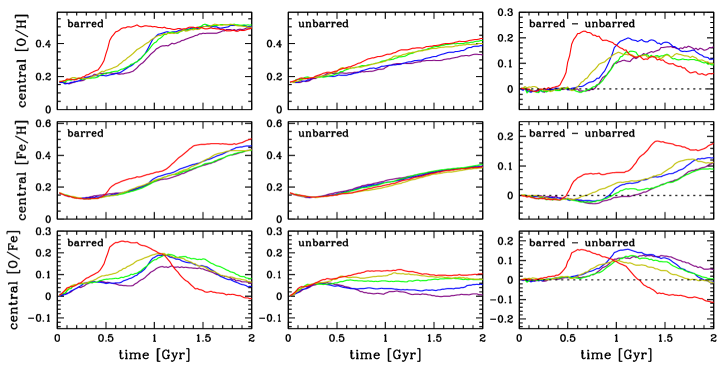
4.1.3 Metallicity
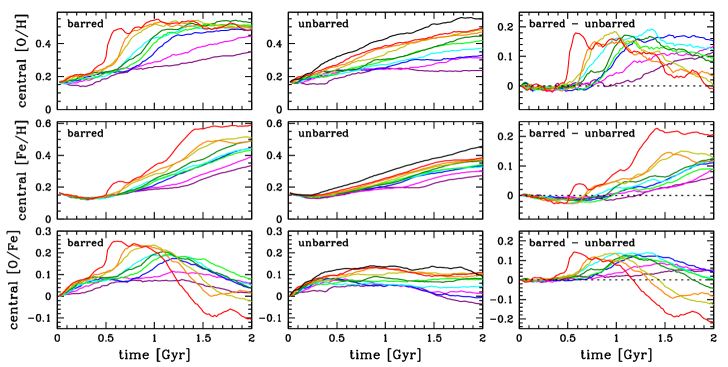
Fig. 3 shows the evolution of (top panels), (middle panels), and (bottom panels) in the central region in galaxies O–I. shows a very different trend for high-mass and low-mass barred galaxies. The oxygen abundance in high-mass barred galaxies evolves fairly rapidly with increasing by between 0.5 and . It then remains quite stable for the rest of the simulations. In contrast, low-mass galaxies show a slow and steady increase in , and intermediate-mass galaxies show a moderate increase, eventually reaching a plateau at late times. The oxygen abundance increases only during the important periods of star formation. As expected from their SFRs, unbarred galaxies have a gentle increase of their central . In the right panel, we plot the difference between barred and unbarred galaxies. Low- and intermediate-mass unbarred galaxies have a notably lower final than their barred counterpart, but this difference slowly disappears for higher-mass galaxies. Barred galaxies have, compared to unbarred galaxies, a quasi-instantaneous increase in oxygen abundance, which climbs by at least for all galaxies in less than . Unbarred galaxies, whose star formation remains stable throughout the simulation, have thus a continuous increase of their chemical abundances, for oxygen as well as iron. Among barred galaxies, the most massive ones show not only an especially rapid increase of the abundance, but also a levelling of the values of near the end of the simulation.
The evolution of does not proceed as rapidly as that of . All galaxies, barred and unbarred, show a dip in during the first , while only the lowest-mass galaxies O show a corresponding dip in . This decrease is caused by gas entering the central region, coming from regions that are farther from the centre and therefore poorer in metals. After the iron abundance in barred galaxies increases rapidly, which translates into a of for galaxies F, G, and H. In lower-mass barred galaxies, the iron abundance increases progressively and overtakes the ones of unbarred galaxies. At , barred galaxies have gas richer in iron in the central region than unbarred galaxies. While the of high-mass barred galaxies is not noticeably higher than high-mass unbarred galaxies, of barred galaxies is higher than the one from unbarred galaxies at all masses.
The evolution of shows an initial increase caused by Type II SNe, producing oxygen, followed by a decrease due to Type Ia SNe producing iron. Overall, high-mass barred galaxies end up with significantly lower central values of than the corresponding unbarred galaxies (by ), while in lower-mass galaxies the differences are much smaller. In section 1, we stressed the need to compare barred and unbarred galaxies that share a common observational property related to their total mass or evolutionary stage. In this paper, we will use the central stellar mass (stellar mass in the central region of radius ), following Ellison et al. (2011). As Fig. 3 shows, the central ratio would be a bad indicator of evolutionary stage. It varies non-monotonically for barred galaxies, and hardly varies for unbarred galaxies.
4.2 Initial gas fraction
In Paper II, we focused on the effect of stellar mass on the star formation history of barred and unbarred galaxies, but we complemented that study by considering the effect of changing the initial gas fraction. To do so, we resimulated galaxies D (barred and unbarred), using two lower initial gas fractions and two higher ones. These galaxies, named , , , and , are presented in Table 1, with the initial gas fractions listed in the ninth column.
Figure 4 shows the SFR inside the central region of the various D galaxies as a function of time. Barred galaxies from to have very similar SFR histories: their SFR increases steadily between 0 and before decreasing. The very-gas-rich barred galaxy shows a large SFR peak around , similar to the ones seen in massive barred galaxies F, G, and H (Fig. 1). As we argued in Paper II, it is the mass of gas, and not to total baryonic mass or virial mass which is the primary factor in determining the star formation history of barred galaxy. In unbarred galaxies, the SFR varies smoothly, and remains higher in galaxies with higher initial gas fraction throughout the simulation.
Fig. 5 shows the evolution of (top panels), (middle panels), and (bottom panels) in the central region in galaxies , , D, , and . Comparing with Fig. 3, we find that the evolution of the abundances in the gas-rich galaxies , barred and unbarred, resembles the ones of the massive, gas-normal galaxies F, G, and H, while the evolution of the other galaxies – resembles the ones of intermediate-mass galaxies B, C, D, and E. As for the SFR, it is the gas mass that determines primarily the evolution of the abundances.
Overall, the gas fraction has little effect until it gets above a certain value. Then, a small increase in gas fraction (from 0.290 for galaxy to 0.319 for galaxy ) causes a significant increase both in central SFR and central metallicities. Sillero et al. (2017) have performed two simulations of isolated galaxies with different gas fractions (0.2 and 0.5), and found that a larger gas fraction leads to a larger specific SFR and metallicity slope. These authors identify the formation of gas clumps as the cause for this effect. In our simulations, the effect is found only in barred galaxies. It would be interesting to see if the presence of bars favours the formation of clumps, but this is beyond the scope of this paper and will be considered in future work.
4.3 The mass-metallicity relation
4.3.1 Galaxy sample
In the previous sections, we have examined our results in terms of “simulation time” . This is a somewhat arbitrary measure, because the relation between simulation time and the evolutionary state of an observed galaxy will depend on our initial conditions, and the evolutionary history of the observed galaxy. In order to properly compare our results with observations, we need to parametrise these simulations in terms of observable variables, as done in, i.e., Scudder et al. (2015). One limitation of our simulations is our sample size (19 galaxies for runs O–I), which is much smaller that most samples of observed galaxies. However, each simulation produces a series a snapshots, which represent the galaxies at different evolutionary stages. If we consider each snapshot as a separate galaxy, we then end up with a large sample, covering a wide variety of physical properties222with the exception of the dark matter halo mass , which is still limited to the values listed in Table 1.. We exclude the first Myr from our numerical samples to allow the gas to relax to equilibrium. Note that this is the same procedure we used in Paper II.
To make meaningful comparison between barred and unbarred galaxies, we must select galaxies that share a common property. In the previous sections, we compared galaxies that have reached the same evolutionary time . However, this information is not available to observers, who must use a proxy to identify the evolutionary stages of the galaxies. In Paper II, we chose the central stellar mass , a quantity that increases monotonically with time, both in barred and unbarred galaxies. We use the same approach here. This has the added advantage of allowing direct comparisons with the observational results of Ellison et al. (2011).
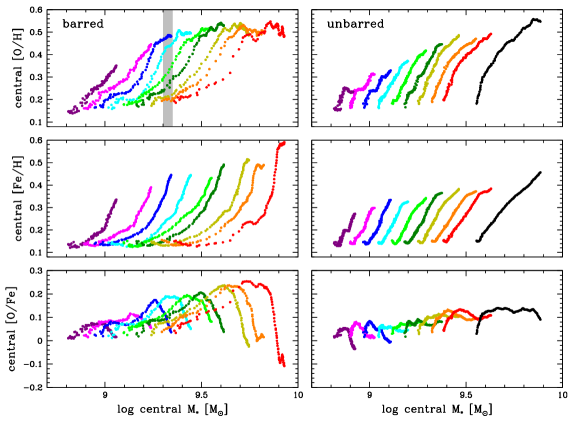
Fig. 6 shows the relation between abundance ratios and central stellar mass. Each dot represents one snapshot of a simulation, and the colours identify the runs that provided the snapshots. The values of and central increase with time for all runs. In barred galaxies, a substantial amount of gas is driven toward the central region, leading to a rapid increase of both and central . Note that some of gas driven toward the centre has been pre-enriched in oxygen by stars forming outside of the central region (Paper I). Overall, barred galaxies reached larger values of and central than unbarred ones (remember that galaxy I unbarred, shown in black in the right panels, does not have a barred counterpart). There is a levelling-off of at late time for the most massive galaxies. These galaxies are at very late stages of their evolution, well passed the peak of star formation. Stellar evolution produces modest amounts of oxygen at this point, and the infall of more pristine gas into the central region tends to compensate that increase, and can even reduce the central value of .
The middle panels of Fig. 6 shows the relation between and central stellar mass. Iron is produced by Type Ia supernovae, whose explosion is delayed relative to Type II supernovae. This explains the small values of in the early evolutionary stages. Once the late evolutionary stages are reached, rapidly increases. In barred galaxies, the central increases rapidly once the bar forms, and also starts increasing, while there is a significant delay before starts increasing, explaining the shape of the evolutionary tracks in the top left and middle left panels of Fig. 6.
The bottom panels of Fig. 6 show the relation between and central stellar mass. In the early evolutionary stages, increases roughly linearly with central . Then, the late production of iron brings the values of down, both in barred and unbarred galaxies. We still find a roughly linear relation for unbarred galaxies, but not for barred galaxies due to the large variations in in massive starburst galaxies (lime, orange, and red dots in bottom left panel of Fig. 6).
In our simulations, a mass-metallicity relation in isolated galaxies naturally appears as a result of secular evolution. The – relations shown in the top panels of Fig. 6 are similar in average values and dispersion to the observed ones (e.g. Tremonti et al. 2004, Fig. 6), except for an overall shift of toward higher values of . This is a combination of two effects. First, our simulated galaxies have a significant abundance gradient in the final state, and by considering only the central instead of the whole galaxy, we are shifting the distribution left (lower ) and up (higher ). Second, we only consider galaxies that have completed their mass assembly and experience secular evolution from that point. We are therefore ignoring mass accretion from the IGM, a process that would tend to reduce the values of . Until we have a more extended suites of simulations that includes non-isolated galaxies, we should refrain from making quantitative comparisons with observations.
4.3.2 Mass binning
In Paper II, we noted that galaxies with the same central can have different global . In our simulations the central increases over time, and so a low-global galaxy at a late stage of evolution can have the same central as a high-global at an early stage of evolution. In Paper II, we examined this effect in terms of the central SFR, but this affects the central metallicities as well. To illustrate this, we drew in the top left panel of Fig. 6 a central stellar mass bin of width . This mass bin contains high-mass galaxies in their early evolutionary stages (orange and lime dots), low- mass galaxies in their final evolutionary stages (blue dots), and everything in between. The galaxies in this bin cover a range of nearly Gyr in age, and their initial stellar masses varies from to , yet they have essentially the same central stellar mass.
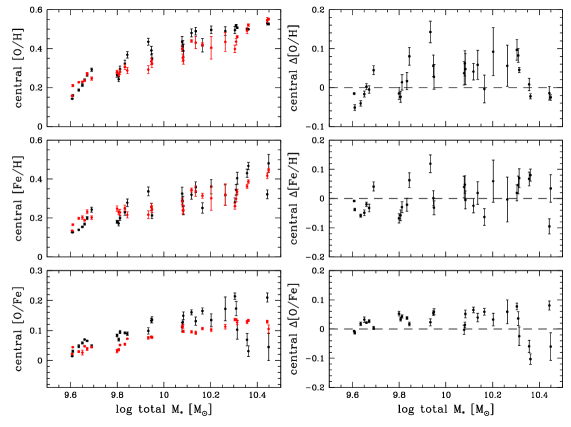
As in Paper II, we compare our results with the observations of Ellison et al. (2011), although here we compare metallicities instead of star formation rates. In Ellison et al. (2011), a sample of 294 barred galaxies was binned by central stellar mass, and the SFRs and metallicities (in terms of ) compared with the expected values of unbarred galaxies for the same bin. They found that massive () barred galaxies had an average SFR of higher than that of unbarred galaxies. In contrast, over all masses they found an enhancement in of in barred galaxies compared to unbarred ones. In Paper II, to investigate the SFR enhancement in our sample, we recreated the same method using a Gyr simulated sample, by calculating a weighted average SFR in 30 central stellar mass bins for barred and unbarred galaxies. Weights were selected to represent the relative likelihood of observing a particular galaxy, determined using the halo mass function of Murray et al. (2013). We found the low-mass barred galaxies had a small enhancement of of their central SFR when compared to unbarred galaxies with equivalent central stellar mass. This enhancement increases with mass, before reaching a plateau of at . Hence, our simulations essentially reproduced the results of Ellison et al. (2011), in particular the location and amplitude of the transition, except for an overall shift of at all masses.
We are now applying the same method as in Paper II, but calculating the averaged values of , , and in each mass bin instead of SFR. The results are shown in Fig. 7. We find an enhancement in metallicity in barred galaxies compared to unbarred ones between and . For iron (middle right panel), the results are quite noisy, but if we ignore one data point located at there is an enhancement of order with a lot of scatter. For oxygen (top right panel), there is a clear enhancement of order in barred galaxies, except at the lowest and highest mass bins, where we find no difference. By contrast, Ellison et al. (2011) found a uniform enhancement of in at all masses in the range . The highest-mass bins contain high-mass galaxies at their late evolutionary stages. These bins are missing even-higher-mass galaxies at earlier evolutionary stages, because they were no included in our series of simulations. Similarly, the lowest-mass bins contain low-mass galaxies at early evolutionary stages, but are missing even-lower-mass, more evolved galaxies.
Finally, the bottom panels of Fig. 7 show the results for . There is an enhancement of order in barred galaxies at all masses up to . At larger masses, the results are noisy and inconclusive. Finding an enhancement in in an age-limited sample is not surprising, since the late, iron-producing stages of some galaxies will always be excluded from the sample.
We note that the large fluctuations in , , and are caused primarily by large fluctuations in the values for barred galaxies. there are sudden jumps in and at , There is a sudden jump in at , for barred galaxies. We find no such sudden jumps for unbarred galaxies.
4.4 The SFR-metallicity relation
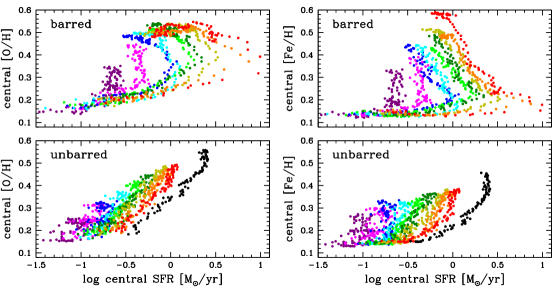
According to the basic scenario, bars drive gas toward the centres of galaxies, where this gas is converted into stars, which later deposit metals into their surroundings. Hence, we would expect to find a relation between the central SFR and the central metallicity. Indeed, the observed mass metallicity relation shows an additional dependence on SFR (e.g. Ellison et al. 2008b; Mannucci et al. 2010; Salim et al. 2014). We tested the inter-relation between metallicity and SFR rate in our simulations by using same sample as in the previous section. Fig. 8 shows the SFR-metallicity relations. In the early evolutionary stages, there is a general tendency of to increase with the SFR in unbarred galaxies (bottom left panel). For (bottom right panel), the effect is weaker. Because of the delay in Type Ia SNe explosions, each evolutionary track is initially flat, before finally stars increasing. By superposing these tracks, we end up with a relation that has a shallow slope and a large dispersion. At later times, there is still a tendency of and to increase with the SFR, but the dispersion becomes very large. If we do the same exercise as in Fig. 6, and draw a vertical line in the bottom panels of Fig. 8, we would see that a bin at a given SFR contains galaxies of very different masses, that are at different stages of their respective evolution: old, low-mass galaxies with high metallicity, and young, high-mass galaxies with low metallicity.
Within the context of our simulations, the tendency of to increase with SFR makes sense physically. A higher SFR implies that more stars will form and evolve, and eventually produce more metals. However, it goes contrary to observations, which show that at a given , tends to decrease when the SFR increases (e.g. Ellison et al. 2008b, Fig. 1; Mannucci et al. 2010, Fig. 1). In both papers, these authors suggest accretion of low-metallicity intergalactic gas as a possible explanation, a process which is not considered in our simulations.
The SFR-metallicity relation gets even messier with barred galaxies (top panels of Fig. 8). The evolutionary tracks turn to the left (lower SFR) because the evolution of the SFR is non-monotonic (see also Fig. 19 of Paper I). The metallicity dispersion becomes so large that there is essentially no SFR-metallicity relation to speak of. Because of the non-monotonic behaviour of the SFR, which increases before the starburst and decreases after the starburst, a bin at a given SFR will not only contain galaxies of different masses at different evolutionary stages, but also equal-mass galaxies at different evolutionary stages.
The difficulty in relating the central SFR to the central metallicity was highlighted in Paper I, where we showed that a large fraction of metals present in the centre of barred galaxies did not form in situ, but formed along the entire length of the bar, to be later transported to the centre by gas flows. But there is also a conceptual, and more fundamental problem. The stellar mass and gaseous metallicity are integrated quantities; their values are determined by the history of star formation and chemical enrichment, integrated over the life of the galaxies. More specifically, the stellar mass is the integral of the SFR, while the metallicity is the integral of the chemical yield. By contrast, the central SFR is an instantaneous quantity, measured only at the present epoch, and that can differ wildly from its value at earlier epochs. Integrated quantities like the stellar mass or central metallicity tend to vary monotonically with time, while instantaneous quantities like the central SFR might vary non-monotonically. Consequently, the relationship between an integrated quantity and an instantaneous one might not be one-to-one.
4.5 The effect of AGN feedback
In this section, we consider the effect of AGN feedback on the evolution of the metallicity. Runs – were presented in Paper III. The galaxies have a halo mass , and most of them have an initial stellar mass , consistent with the scaling relations of Bell et al. (2003) and Cox et al. (2006), the other galaxies being gas-poor or very-gas-poor. These masses were chosen for a specific reason: the shape of the relation shows that SNe feedback dominates at stellar masses , whereas most of the gas is blown out of the galaxy by AGN feedback at much larger masses (Behroozi et al., 2010; Moster et al., 2010). For this reason, we selected an initial stellar mass which is near the bottom of the AGN-dominated regime.
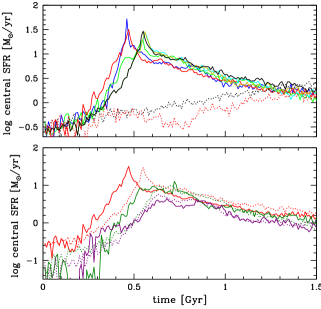
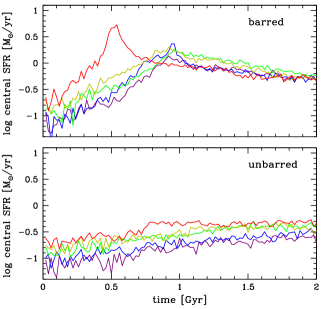
The top panel of Fig. 9 shows the SFR vs. time inside the central region, for galaxies –, with solid and dotted lines showing barred and unbarred galaxies, respectively. For the runs without feedback (black lines), the results are consistent with the ones shown in Fig. 1. In barred galaxies, the starburst peaks earlier in galaxies with feedback (, , ) than in galaxies with no feedback or delayed feedback (, , ), even though all galaxies have the same mass. The presence of feedback favours the growth of a bar instability, causing the bar to form earlier, which leads to an earlier starburst (Paper III). In Runs and , the AGN is turned on at , at a time when the bar is formed and star formation in the central regions is well under way, and the effect of AGN feedback is then negligible. After , the central SFR decreases at the same rate in all barred galaxies. The dotted lines in the top panel of Fig. 9 show the SFR for unbarred galaxies. The central SFR increases slowly, and the effect of feedback is small except for a brief period around .
The bottom panel of Fig. 9 shows the evolution of the SFR for gas-normal barred galaxies and (red lines), gas-poor barred galaxies and (dark green lines), and very-gas-poor barred galaxies and (purple lines), with solid and dotted lines showing galaxies with and without AGN feedback, respectively. The SFR drops significantly with gas fraction, both for galaxies with an AGN (solid lines) and without (dotted lines). With a lower gas fraction, the SFR rises slower, peaks at a lower value, and reaches this peak later. These results are discussed in more details in Paper III.
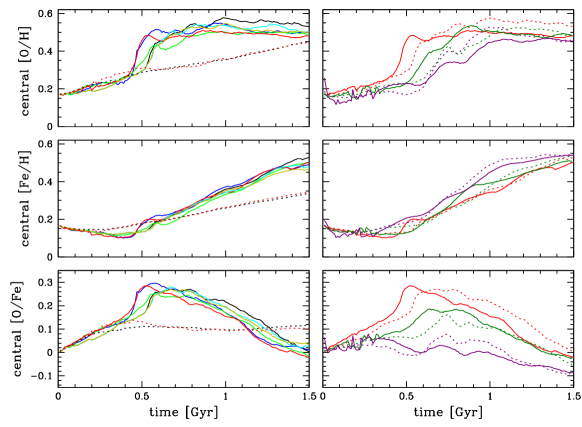
Fig. 10 shows the evolution of , , and . The left panels show the results for gas-normal galaxies –. All barred galaxies experience a starburst, which leads to a sudden increase of in oxygen abundance due to enrichment by Type II SNe. Once the starburst is passed, the SFR rapidly decreases, and the ratio levels off at . At late times, is larger in the absence of feedback (black line), because the SFR is larger. Because of the time delay for Type Ia SNe, the iron abundance increase slowly, and never reaches a plateau. At early times, the iron abundance actually decreases because the inflow of low-metallicity gas along the bar dilutes the central abundance. For oxygen, this effect is not sufficient to compensate for the enrichment caused by stars already present in the initial conditions. As a result, first rapidly increases, reaching soon after the peak of the starburst, and then drops progressively, reaching zero at . For unbarred galaxies, star formation increases very slowly (Fig. 9), resulting in a slow and continuous enrichment in oxygen and iron. and increase at the same rate, except at early times when stars present in the initial condition cause an increase in oxygen relative to iron. increases slowly, and then levels off at . AGN feedback makes hardly any difference in these unbarred galaxies, because the rate of AGN accretion is quite low, due to a lack of mechanism for driving gas toward the central regions (Paper III).
The right panels of Fig. 10 shows the evolution of , , and for gas-normal barred galaxies and , gas-poor barred galaxies and , and very-gas-poor barred galaxies and . The SFR is reduced and the starburst takes place later as the gas fraction goes down, leading to a slower and less sudden increase in . For gas-normal and gas-poor galaxies (red and dark green lines), the starburst takes place later when feedback is present (Fig. 9), delaying the increase in by . For very-gas-poor galaxies (purple lines), the effect of feedback on the SFR is small, so we find a different behaviour: increases faster in presence of feedback. increases slowly and steadily, and the values are actually larger for lower gas fraction. In this case, the dilution caused by infall of low-metallicity gas dominates over iron enrichment by Type Ia SNe. decreases significantly with gas fraction. While reaches at its peak for gas-normal galaxies, it never exceeds in very-gas-poor galaxies.
| Time | Galaxy | |||
|---|---|---|---|---|
| , , | 0.064 | 0.024 | 0.040 | |
| 0.150 | 0.054 | 0.095 | ||
| 0.098 | 0.036 | 0.061 | ||
| 0.242 | 0.081 | 0.168 | ||
| 0.072 | 0.051 | 0.021 | ||
| 0.054 | 0.022 | 0.022 | ||
| 0.051 | 0.036 | 0.015 | ||
| 0.055 | 0.036 | 0.012 | ||
| 0.061 | 0.037 | 0.024 | ||
| 0.057 | 0.030 | 0.027 |
Note: Entries show absolute values of slopes, in . All slopes are negative.
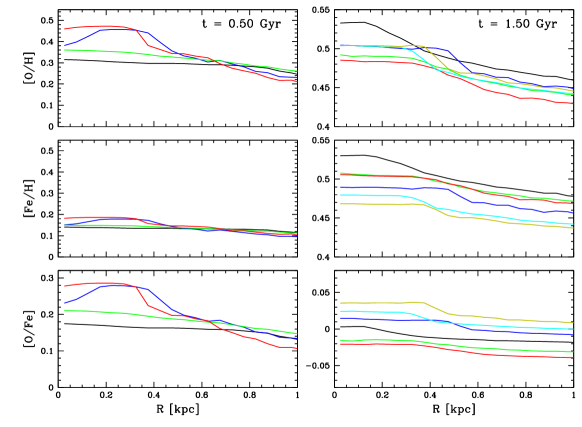
In Paper III, we found that the effect of AGN feedback in our simulated barred galaxies did not extend beyond the central region, for the particular galaxy mass we chose and our assumed AGN model. The SFR is reduced in the vicinity of the central black hole, and enhanced at larger radius, up to . Essentially, feedback pushes the central gas outward, where it collides supersonicly with infalling gas, forming a dense ring where star formation is enhanced. Thus, if any chemical signature of AGN feedback is to be found, it would be in the radial abundance profiles in the central region. The left panels of Fig. 11 show the radial , , and profiles in the central region of barred galaxies – at , when the SFR is near its peak. In presence of AGN feedback, the bar forms earlier, and this modifies the profile both at small and large radius. A bar that forms earlier results in an earlier starburst, and therefore an earlier oxygen enrichment of , but this effect is limited to the inner where most of the star formation takes place (Paper III). At larger radius, where the SFR is much lower, the dominant process is the infall of low-metallicity gas into the central region, resulting in a slight decrease of in . This process takes place earlier when the bar forms earlier.
For , the effect of feedback is much weaker, and the profiles are much flatter. In Table 2, we list the mean slope of the abundance profiles in the central region, in . The slopes are 3 times shallower for than for . The energy deposited into the central region by the AGN does not couple with the stellar component. Once gas is converted into stars, these stars can move through the central region unimpeded before they explode in Type Ia SNe, resulting in a fairly uniform distribution of iron. This results in a profile that shows an enhancement of in the central when feedback is present. The right panels of Fig. 11 show the central abundance profiles at . Two things happen between and . First, the Type Ia SNe exploded, allowing the central iron abundance to catch up with the oxygen abundance, and second, gas motion inside the central region mixed the elements, leading to much flatter abundance profiles with slopes shallower than 0.01 (in absolute value). The differences between galaxies with and without feedback are too small to be significant.
Overall, for the galaxies considered in this study, the effect of AGN feedback on the abundance ratios is small and transient. Differences between the galaxies are important during the peak of the star formation, and result from the fact that this peak occurs at different times in the different simulations. By the end of the simulations, the differences between AGN- and non-AGN-hosting galaxies, or between AGN-hosting galaxies with different feedback prescriptions, are insignificant. The effect of AGN feedback on chemical abundances in indirect, or “one-off.” The energy released by the AGN directly affects the kinematics of the gaseous component, but all chemical elements are equally affected by this process. AGN feedback can only affect abundance ratios indirectly, by (i) modifying the SFR, and the subsequent chemical enrichment history of the galaxy, or (ii) causing a mixing of regions with different abundance ratios, differences that originated from processes other than AGN feedback. One limitation of our study is the fact that, for galaxies hosting AGNs, we considered only one particular galaxy mass. This mass was chosen to be at the lower end of the AGN-dominated regime. It would be interesting to consider higher-masses galaxies with stronger AGN activity and feedback. We defer such study to further work.
5 SUMMARY AND CONCLUSIONS
We have conducted a numerical study of the history of chemical enrichment in barred and unbarred spiral galaxies, focussing on the dependence on total stellar mass, gas fraction, and AGN activity. The simulations consist of two separate suites that were presented in previous papers. The first set consists of 13 barred and 14 unbarred galaxies with stellar masses in the range to , and various initial gas fractions. The second set consists of 10 barred and 2 unbarred galaxies of stellar mass , with various prescriptions for AGN feedback. Our simulated barred galaxies experience a sudden increase in central SFR, followed by a slow decrease caused by gas exhaustion. This approach ignores the possibility of replenishing the supply of gas by accretion from the intergalactic medium, or mergers with other galaxies. As we explained in Papers I, II, and III, our simulations are most relevant to galaxies located at sufficiently low-redshift that most of their mass assembly is completed (e.g. L’Huillier et al. 2012). This raises an important question: was the observed mass-metallicity relation established during the period of mass assembly, or during the period of secular evolution, or both? By starting the simulations after the period of mass assembly and using initial conditions with a fixed metallicity gradient, we are studying the contribution of secular evolution on the evolution of the metallicity. For this reason, we reported the changes in abundances during the secular evolution phase, rather than the actual final values of these abundances. Our results are the following:
-
1.
The mass of metals in the central region generally follows a similar evolution to the total gas mass in the centre. Bars drive gas and entrained metals toward the centre. The effect is strongest in massive galaxies. However, these galaxies experience a starburst, which consumes most of the central gas and metals. As a result, the most massive barred galaxies eventually end up with a lower central metal mass and a lower central gas mass. In unbarred galaxies, the central metal and total gas masses steadily increase, except for the most massive unbarred galaxy (I), where the high SFR eventually causes a drop in central gas mass and metal mass.
-
2.
The starburst in massive barred galaxies results in a rapid increase in central values of . Once the starburst is passed, the SFR drops and levels off. Less massive barred galaxies experience a less sudden increase in . Eventually levels off at the same value in all barred galaxies except the least massive ones (O, A). In unbarred galaxies, increases slowly and steadily. The central values of in barred and unbarred galaxies initially decreases because of dilution by infalling gas. It then increases steadily, with a faster increase in barred galaxies. The central values of first increase because of oxygen production by Type II SNe, then decrease because of iron production by Type Ia SNe, both in barred and unbarred galaxies, though the variations in unbarred galaxies are small.
-
3.
Changing the initial gas fraction has little effect on the evolution of the central abundance ratios, except for the gas-rich galaxy barred, which is the only D-galaxy that experiences a starburst. This galaxy has an initial gas mass comparable to barred galaxies F and G, which also experienced a starburst. In Paper II, we concluded that the initial gas mass was the key factor in determining the star formation history of the galaxies, and the same is true for the chemical evolution.
-
4.
Using all snapshots provided by our simulations, we build a mock sample of barred and unbarred galaxies. With this sample, we qualitatively reproduced the results of Ellison et al. (2011), an enhancement in of order in barred galaxies, at all central stellar masses except at small and large masses, where again our sample might suffer from incompleteness. We also find, in this sample, enhancements in of order and in of order in barred galaxies.
-
5.
The SFR-metallicity relation shows that the central metallicity tends to increase with central SFR in all galaxies, up to a point. If massive, post-starburst barred galaxies are include in the sample, the SFR does not vary monotonically, and is no longer a good proxy for identifying the evolutionary stage. In this case, the dispersion in the SFR-metallicity relation is so large that this relation is probably useless.
-
6.
For the galaxy masses and the AGN feedback model we considered, the effect of AGN feedback on the central metallicity is small and transient. Feedback essentially changes the timing: the bar forms earlier, leading to an earlier starburst, accompanied by an earlier oxygen enrichment. Once the galaxies are in their post-starburst phases, there subsequent evolution are essentially similar. The final values of and in barred galaxies are about lower when feedback is included. AGN feedback has no effect of the metallicity of unbarred galaxies, because in the absence of a bar driving gas toward the centre, the AGN luminosity is too low to have any effect.
Our results emphases the main difficulty in assessing the effect of bars on galaxy evolution: deciding which barred and which unbarred galaxies should be compared to one another. Comparing galaxies with the same stellar mass is a reasonable (and common) choice, but is not without problems. Since increases with time in all galaxies, very different galaxies can have the same value of because they are being observed at different evolutionary stages. We considered other possibilities, which turned out to be worse. The SFR and the ratio are very bad indicators of evolutionary stages, because they tend vary non-monotonically. Note that Montuori et al. (2010) and Perez et al. (2011) reached a different conclusion. However, the simulations of Perez et al. (2011) did not extend into the regime when iron enrichment by Type Ia SNe becomes important, while the simulations of Montuori et al. (2010) did, but their analysis focused on the earlier stages evolution, during which oxygen enrichment by Type II SNe dominates. Overall, we reach the same conclusion as in Papers I and II, that it takes at least two observables to estimate unambiguously at what evolutionary stage a particular galaxy is seen.
Our study shows that the history of metallicity enrichment in barred galaxies is more complex than the basic scenario suggests. Our goal was to understand the interplay between the various physical processes responsible for chemical enrichment in disc galaxies. Based on our results and the ones presented in Paper I–III, we can identify three specific processes that play a key role:
-
1.
In barred galaxies, the presence of a bar drives a substantial amount of gas toward the central region, while the effect on the stellar component is weaker (Paper I). There is exchange of gas and stars between the central region and its surrounding. As a result, there is no direct connection between local star formation and local metallicity. Stars, once they form, can migrate inside the galaxy before exploding, and gas, once enriched, can flow inside the galaxy from one region to another (Di Matteo et al. 2013; Paper I; Kubryk et al. 2013). This weakens the significance of any mass-metallicity relation based on masses and metallicities that are estimated using central values.
-
2.
There is a time delay between the explosions of Type II and Type Ia SNe, leading to different chemical enrichment histories for iron and for -elements such as oxygen. The effect is particularly important in starburst galaxies, where most of the stars form during a brief period of time. In galaxies with long, steady periods of star formation, this effect is much weaker.
-
3.
In isolated galaxies, the processes of star formation and AGN growth compete for the same limited supply of gas. Each process has the potential to suppress the other by gas exhaustion.
The potentially most important process not included in these study is accretion from the IGM. This will be the subject of a follow-up study.
acknowledgments
We are very thankful to Daisuke Kawata for providing useful comments. This research is supported by the Canada Research Chair program and NSERC. DJW is supported by European Research Commission grant ERC-StG-6771177 DUST-IN-THE-WIND.
References
- Alonso-Herrero & Knapen (2001) Alonso-Herrero A., Knapen J. H. 2001, AJ, 122, 1350
- Baba et al. (2010) Baba J., Saitoh T. R., Wada K. 2010, PASJ, 62, 1413
- Barai et al. (2014) Barai P., Viel M., Murante G., Gaspari M., Borgani S. 2014, MNRAS, 437, 1456
- Barnes et al. (2012) Barnes D. J., Kawata D., Wu K. 2012, MNRAS, 420, 3195
- Behroozi et al. (2010) Behroozi P. S., Conroy C., & Wechsler R. H. 2010, ApJ, 717, 379
- Bell et al. (2003) Bell E. F., Mcintosh D. H., Katz N., Weinberg M. D. 2003, ApJ. 585, L117
- Bondi (1952) Bondi H. 1952, MNRAS, 112, 195
- Bondi & Hoyle (1944) Bondi H., Hoyle F. 1944, MNRAS, 104, 273
- Cacho et al. (2014) Cacho R., Sánchez-Blázquez P., Gorgas J., Pérez I. 2014, MNRAS, 442, 2496
- Carles et al. (2016) Carles C., Martel H., Ellison S. L., Kawata, D. 2016, MNRAS, 463, 1074 (Paper II)
- Chapelon et al. (1999) Chapelon S., Contini T., Davoust E. 1999, A&A, 345, 81
- Cheung et al. (2013) Cheung E., Athanassoula E., Masters K. L., et al. 2013, ApJ, 779, 162
- Combes (2003) Combes F. 2003, in ASP Conf. Ser. 209, Active Galactic Nuclei: From Central Engine to Host Galaxy, eds. S. Collin, F. Combes, & I. Shlosman (San Francisco, CA: ASP), 441
- Combes & Elmegreen (1993) Combes F., Elmegreen B. G. 1993, A&A, 271, 391
- Combes & Gerin (1985) Combes F., Gerin M. 1985, A&A, 150, 327
- Coelho & Gadotti (2011) Coelho P., Gadotti D. A. 2011, ApJ, 743, L13
- Considère et al. (2000) Considère S., Coziol R., Contini T., Davoust E., 2000, A&A, 356, 89
- Cox et al. (2006) Cox T. J., Jonsson P., Primack J. R., Somerville R. S. 2006, MNRAS, 373, 1013
- Debattista & Sellwood (2000) Debattista V. P., & Sellwood J. A. 2000, ApJ, 543, 704
- Devereux (1987) Devereux N. 1987, in NASA Conference Publication, Vol. 2466, 219–226
- Di Matteo et al. (2009) Di Matteo P. D., Pipino A., Lehnert M. D., Combes F., Semelin B., 2009, A&A, 499, 427
- Di Matteo et al. (2013) Di Matteo P. D., Haywood M., Combes F., Semelin B., Snaith O. N. 2013, A&A, 553, 102
- Dutil & Roy (1999) Dutil Y., Roy J. R., 1999, ApJ, 516, 62
- Ellison et al. (2011) Ellison S. L., Nair P., Patton D. R., Scudder J. M., Mendel J. T., Simard L. 2011, MNRAS, 416, 2182
- Ellison et al. (2008a) Ellison S. L., Patton D. R., Simard L., McConnachie A. W. 2008a, AJ, 135, 1877
- Ellison et al. (2008b) Ellison S. L., Patton D. R., Simard L., McConnachie A. W. 2008b, ApJ, 672, 107L
- Friedli & Benz (1995) Friedli D., Benz W. 1995, A&A, 301, 649
- Friedli et al. (1994) Friedli D., Benz W., Kennicutt R. 1994, ApJ, 430, L105
- Gadotti & dos Anjos (2001) Gadotti D. A., dos Anjos S. 2001, AJ, 122, 1298
- Grand et al. (2015) Grand, R J. J., Kawata D., Cropper M. 2015, MNRAS, 447, 4018
- Heller & Shlosman (1994) Heller C. H., & Shlosman I., 1994, ApJ, 424, 84
- Henry & Worthey (1999) Henry R. B. C., Worthey G., 1999, PASP, 111 919
- Ho et al. (1997) Ho L. C., Filippenko A. V., Sargent W. L. W., 1997, ApJ, 487, 591
- Hopkins et al. (2010) Hopkins P. F., Kereš D., Ma C.-P., Quataert E. 2010, MNRAS, 401, 1131
- Hoyle & Lyttleton (1939) Hoyle F., & Lyttleton R. A. 1939, proceedings of the Cambridge Philosophical Society, 34, 405
- Hunt et al. (2008) Hunt L. K. et al. 2008, A&A, 482, 133
- Iwamoto et al. (1999) Iwamoto K., Brachwitz F., Nomoto K., et al. 1999, ApJSS, 125, 439
- James et al. (2009) James P. A., Bretherton C. F., & Knapen J. H. 2009, A&A, 501, 207
- Jogee (2006) Jogee S. 2006, in Physics of Active Galactic Nuclei at all Scales, eds. D. Alloin, R. Johnson, & P. Lira (Lecture Notes in Physics, Vol 693; Berlin:Springer), 143
- Jogee et al. (2005) Jogee S., Scoville N., Kenney J. D. P. 2005, ApJ, 630, 837
- Kaplan et al. (2016) Kaplan K. F. et al. 2016, MNRAS, 462, 1642
- Kawata & Gibson (2003) Kawata D., Gibson B. K. 2003, MNRAS, 340, 908
- Kawata et al. (2014) Kawata D., Gibson B. K., Barnes D. J., Grand R. J. J., Rahimi A. 2014, MNRAS, 438, 1208
- Kawata et al. (2013) Kawata D., Okamoto T., Gibson B. K., Barnes D. J., Cen R. 2013, MNRAS, 428, 1968
- Kewley et al. (2006) Kewley L. J., Geller M. J., Barton, E. J. 2006, AJ, 131, 2004
- Kewley et al. (2010) Kewley L. J., Rupke D., Zahid H. J., Geller M. J., Barton, E. J. 2010, ApJ, 721, L48
- Kim & Stone (2012) Kim W.-T., Stone J. M. 2012, ApJ, 751, 124
- Kubryk et al. (2013) Kubryk M., Prantzos N., Athanassoula E. 2013, MNRAS, 436, 1479
- Kubryk et al. (2015) Kubryk M., Prantzos N., Athanassoula E. 2015, A&A, 580, A127
- L’Huillier et al. (2012) L’Huillier B., Combes F., Semelin B. 2012, A&A, 544, A68
- Lokas et al. (2014) Lokas E. L., Athanassoula E., Debattista V. P., et al. 2014, MNRAS, 445, 1339
- Maciejewski et al. (2002) Maciejewski W., Teuben P. J., Sparke L. S., & Stone J. M. 2002, MNRAS, 329, 502
- Mannucci et al. (2010) Mannucci F., Cersci G., Maiolino R., Marconi A., Gnerucci, A. 2010, MNRAS, 408, 2115
- Martel et al. (2013) Martel H., Kawata D., Ellison S. L. 2013, MNRAS, 431, 2560 (Paper I).
- Martin (1995) Martin P. 1995, AJ, 109, 2428
- Martin & Roy (1994) Martin P., Roy J.-R. 1994, ApJ, 424, 599
- Martinet & Friedli (1997) Martinet L., Friedli D. 1997, A&A, 323, 363
- Masters et al. (2012) Masters K. L., Nichol R. C., Haynes M. P., et al. 2012, MNRAS, 424, 2180
- Montuori et al. (2010) Montuori M., Di Matteo P., Lehnert M. D., Combes F., Semelin B. 2010, A&A, 518, A56
- Moorthy & Holtzman (2006) Moorthy B. K., & Holtzman J. A. 2006, MNRAS, 371, 583
- Moster et al. (2010) Moster B. P., Somerville R. S., Maulbetsch C., et al. 2010, ApJ, 710, 903
- Murray et al. (2013) Murray S. G., Power C., Robotham A. S. G. 2013, Astronomy and Computing, 3, 23
- Pérez & Sánchez-Blázquez (2011) Pérez I., Sánchez-Blázquez P. 2011, A&A, 529, A64
- Perez et al. (2011) Perez J., Michel-Dansac L., Tiserra P. B. 2011, MNRAS, 417, 580
- Pompea & Rieke (1990) Pompea S. M., Rieke G. H. 1990, ApJ, 356, 416
- Powers et al. (2011) Powers C., Nayakshin S., King A. 2001, MNRAS, 412, 269
- Rahimi & Kawata (2012) Rahimi A., & Kawata D. 2012, MNRAS, 422, 2609
- Regan & Teuben (2004) Regan M. W., Teuben P. J. 2004, ApJ, 600, 595
- Rich et al. (2012) Rich J. A., Torrey P., Kewley L. J., Dopita M. A., Rupke D. S. N., 2012, ApJ, 753, 5
- Robichaud et al. (2017) Robichaud F., Williamson D., Martel H., Kawata D., Ellison S. L. 2017, MNRAS, 469, 3722 (Paper III)
- Rupke et al. (2010a) Rupke D. S. N., Kewley L. J., Barnes J. E. 2010, ApJ, 710, L156
- Rupke et al. (2010b) Rupke D. S. N., Kewley L. J., Chien L.-H. 2010, ApJ, 723, 1255
- Salim et al. (2014) Salim S., Lee J. C., Ly C., Brinchmann J., Davé R., Dickinson M., Salzer J. J., Charlot S. 2014, ApJ, 797, 126
- Salpeter (1955) Salpeter E. E. 1955, ApJ, 121, 161
- Sánchez et al. (2014) Sánchez S. F. et al. 2014, A&A, 563, 49
- Sánchez-Blázquez et al. (2014) Sánchez-Blázquez, P. et al. 2014, A&A, 570, 6
- Scudder et al. (2012) Scudder J. M., Ellison S. L., Torrey P., Patton D. R., Mendel J. T. 2012, MNRAS, 426, 549
- Scudder et al. (2015) Scudder J. M., Ellison S. L., Momjian E. et al. 2015, MNRAS, 449, 3719
- Seidel et al. (2015) Seidel M. K., Falcón-Barroso J., Martínez-Valpuesta I., et al. 2015, MNRAS, 451, 5455
- Shen et al. (2003) Shen S., Mo H. J., White S. D. M. et al. 2003, MNRAS, 343, 978
- Shlosman et al. (1989) Shlosman I., Frank J., & Begelman M. C. 1989, Nature, 338, 45
- Shlosman & Noguchi (1993) Shlosman I., Noguchi, M. 1993, ApJ, 414, 474
- Sillero et al. (2017) Sillero E., Tissera P. B., Lambas D. G., Michel-Dansac L. 2017, MNRAS, 472, 4404
- Tremonti et al. (2004) Tremonti C. A. et al. 2004, ApJ, 613, 898
- Tsujimoto et al. (1995) Tsujimoto, T., Nomoto, K., Yoshii, Y. et al. 1995, MNRAS, 277, 945
- Willett et al. (2015) Willett K. W., Schawinski K., Simmons B. D. et al. 2015, MNRAS, 449, 820
- Williamson et al. (2016) Williamson D., Martel H., Kawata D. 2016, ApJ, 822, 91
- Woosley & Weaver (1995) Woosley S. E., Weaver T. A. 1995, ApJSS, 101, 181
- Wurster & Thacker (2013) Wurster J., Thacker R. J. 2013, MNRAS, 431, 2513