The dust and [CII] morphologies of redshift sub-millimeter galaxies at pc resolution: The absence of large clumps in the interstellar medium of high-redshift galaxies
Abstract
We present deep high resolution (003, 200 pc) ALMA Band 7 observations covering the dust continuum and [CII] m emission in four sub-millimeter galaxies (SMGs) selected from the ALESS and AS2UDS surveys. The data show that the rest-frame 160 m (observed 345 GHz) dust emission is consistent with smooth morphologies on kpc scales for three of the sources. One source, UDS 47.0, displays apparent substructure but this is also consistent with a smooth morphology, as indicated by simulations showing that smooth exponential disks can appear clumpy when observed at high angular resolution (003) and depth of these observations ( Jy beam-1). The four SMGs are bright [CII] emitters, and we extract [CII] spectra from the high resolution data, and recover % of the [CII] flux and % of the dust continuum emission, compared to the previous lower resolution observations. When tapered to 02 resolution our maps recover % of the continuum emission, indicating that % of the emission is resolved out on pc scales. We find that the [CII] emission in high-redshift galaxies is more spatially extended than the rest-frame 160 m dust continuum by a factor of . By considering the / ratio as a function of the star-formation rate surface density () we revisit the [CII] deficit, and suggest that the decline in the / ratio as a function of is consistent with local processes. We also explore the physical drivers that may be responsible for these trends and can give rise to the properties found in the densest regions of SMGs.
=1 \fullcollaborationNameThe Friends of AASTeX Collaboration
1 Introduction
The most luminous galaxies at high redshift () are dusty star-forming galaxies, originally identified at sub-millimeter wavelengths and therefore known as sub-millimeter galaxies (SMGs, Casey et al., 2014). This galaxy population has many properties similar to those of local ultra-luminous galaxies (ULIRGs, Sanders & Mirabel 1996), such as high infrared luminosities (typically L⊙), as well as high gas and dynamical masses and gas fractions (e.g., Tacconi et al., 2008; Engel et al., 2010; Riechers et al., 2011; Bothwell et al., 2013). However, studies have shown important differences between SMGs and ULIRGs. For example, the spatial extent of the gas and star formation in SMGs appears to be much larger than that typically seen in local ULIRGs ( few kpc in SMGs compared to just 100s of pc in local ULIRGs, e.g., Chapman et al. 2004; Sakamoto et al. 2008; Kennicutt et al. 2011; Ivison et al. 2012; Croxall et al. 2012; Simpson et al. 2015a; Ikarashi et al. 2015; Hodge et al. 2016), and while the intense star formation seen in local ULIRGs appears to be triggered by major mergers (e.g., Clements & Baker, 1996; Farrah et al., 2001; Surace et al., 2001; Veilleux, 2002), theoretical predictions have suggested that SMGs at comprise a heterogeneous mix of star formation occurring in extended disks, pre-coalescence mergers, and late-stage mergers (e.g., Hayward et al., 2011; Cowley et al., 2017), which may be consistent with Hubble Space Telescope (HST) imaging (Chen et al., 2015).
Rest-frame ultraviolet (UV)/optical observations of high-redshift ‘main-sequence’ star-forming galaxies show ‘clumpy’ star-forming structures, more massive and brighter than seen locally (e.g., Livermore et al., 2012; Genzel et al., 2012). In a simple framework for gas collapse in a gas-rich disk the masses of these ‘clumps’ are governed by the average gas surface density of the surrounding interstellar medium. In high-redshift galaxies with high gas fractions the masses of collapsing clouds are therefore expected to be shifted to higher masses. This could result in M⊙ ‘clumps’ (e.g., Genzel et al., 2012; Förster Schreiber et al., 2011; Livermore et al., 2012), and since more massive regions host proportionally more star formation (Kennicutt & Chu, 1988), these giant clumps can dominate the galaxy morphology and so explain the clumpy nature of the UV/optical images of high-redshift galaxies (e.g., Elmegreen et al., 2009; Shibuya et al., 2015).
| Source name | R.A. | Dec. | Discovery | FWHM | ||||
|---|---|---|---|---|---|---|---|---|
| (J2000) | resolution | [mJy] | [Jy km s-1] | [km s-1] | [ L⊙] | |||
| ALESS 61.1 | 03:32:45.88 | 28:00:23.4 | ||||||
| ALESS 65.1 | 03:32:52.25 | 27:35:26.2 | ||||||
| ALESS 73.1 | 03:32:29.30 | 27:56:19.6 | ||||||
| UDS 47.0∗ | 02:19:24.85 | 05:09:20.8 | ||||||
The resolution provided by ALMA is now allowing sub-millimeter observations on spatial scales comparable to those provided by optical and UV observations from HST. Recent studies have searched for giant clumps at sub-millimeter wavelengths (e.g., Swinbank et al., 2010, 2015; ALMA Partnership et al., 2015; Iono et al., 2016; Oteo et al., 2017). In a study of 16 ALESS SMGs at 016 resolution ( kpc), Hodge et al. (2016) identified disk-like morphologies with no significant evidence for clumps in dust emission in the majority of their galaxies. However, giant HII regions in local galaxies are a few pc (e.g., Hill et al., 2005; Sakamoto et al., 2008). This means that, although this study measures structures on kpc scales, even higher resolution is required to search for extended clumpy disks with 200–500 pc size clumps, as seen in some simulations (Dekel et al., 2009; Bournaud et al., 2014) and locally (e.g., Hill et al., 2005; Sakamoto et al., 2008).
One particularly powerful tool to study the structure of high-redshift galaxies in the sub-millimeter waveband is the bright [CII] m line. This far-infrared (FIR) fine-structure emission line is emitted by the 2PP1/2 transition in singly ionized carbon ([CII]) and accounts for up to % of the cooling in the interstellar medium (Stacey et al., 1991; Brauher et al., 2008; Graciá-Carpio et al., 2011). It is therefore one of the brightest and best studied atomic lines. The [CII] emission line arises from both photo dominated regions (PDRs), which form on the UV-illuminated surfaces of molecular clouds, diffuse HII regions, and also from diffuse ISM (Madden et al., 1993; Lord et al., 1996). Early studies of [CII] in local ULIRGs using the Kuiper Airborne Observatory and Infrared Space Observatory (ISO) (Stacey et al., 1991; Malhotra et al., 1997; Luhman et al., 1998; Malhotra, 2001; Luhman et al., 2003) revealed a deficit in the [CII] line strength compared to the far-infrared emission for lower luminosity galaxies. For galaxies with L⊙, the / ratio is constant at %, however at L⊙, the / ratio decreases to %. This decrease is known as the ‘[CII] deficit’, and many attempts have been made over the past two decades to investigate its origin (e.g., Hailey-Dunsheath et al., 2010; Ivison et al., 2010; Stacey et al., 2010; Valtchanov et al., 2011; Graciá-Carpio et al., 2011; Farrah et al., 2013; Gullberg et al., 2015; Lutz et al., 2016a; Díaz-Santos et al., 2017).
Among the various explanations proposed for this behaviour are: [CII] self-absorption, strong continuum extinction at 158 m; collisional quenching of [CII] emission; high ionization parameters; and metallicity dependence (see Smith et al. 2017 for an extensive discussion).
By exploring the / ratio as a function of the star-formation rate surface density () in spatially resolved local galaxies in the KINGFISH sample, Smith et al. (2017) identify a declining relation of the / ratio as a function of . The authors suggest that the [CII] deficit is driven by local physical processes of interstellar gas (e.g., [CII] self-absorption, dust extinction, and dust grain charge), not related to the global properties of the galaxies. Another study of spatially resolved local galaxies in the GOALS sample by Díaz-Santos et al. (2017), likewise suggest that local processes are the cause of the [CII] deficit, proposing that the radiation field strength to gas density ratio is the driver.
In this paper we present high-resolution (003) ALMA Cycle 3 Band 7 observations of four SMGs at , mapping their structure in dust and [CII] emission on pc scales. Our observations show a range of morphologies in the observed 345 GHz dust continuum emission (rest-frame 160 m) and [CII] emission lines. In § 3 we describe the observations and data reduction, while in § 4 we present our analysis and in § 5 and § 6 our discussion and conclusions. We assume a cosmology with , and km s-1 Mpc-1, in which 1″ corresponds to a physical scale of 6.7 kpc at .
2 Sample
Three of our targets (ALESS 61.1, ALESS 65.1, and ALESS 73.1) were selected from ALMA Band 7 (observed 870 m/345 GHz) follow-up observations of sources detected in the single-dish LABOCA Extended Chandra Deep Field South (ECDFS) Submm Survey (LESS, Weiß et al. 2009). The ALMA Cycle 0 continuum observations of these SMGs were reported in Hodge et al. (2013) (see Table 1) and revealed serendipitous detections of [CII] in ALESS 61.1 and ALESS 65.1, establishing the redshifts as and respectively (Swinbank et al., 2012). The redshift of ALESS 73.1 was already known () and is also detected in [CII] emission from ALMA Cycle 0 observation (Coppin et al., 2009; De Breuck et al., 2014).
| Natural weighting (003) | Low-resolution (02) | Sizes | ||||||||
| Source | RMS | S/N | Recovered | RMS | S/N | Recovered | FWHM | Aperture | ||
| [Jy beam-1] | [mJy] | flux | [Jy beam-1] | [mJy] | flux | [arcsec] | [arcsec] | |||
| ALESS 61.1 | 42 | 7.4 | % | 0.32 | 7.7 | % | 0.40 | |||
| ALESS 65.1 | 42 | 7.5 | % | 0.22 | 9.8 | % | 0.30 | |||
| ALESS 73.1 | 27 | 8.3 | % | 0.16 | 11.7 | % | 0.36 | |||
| UDS 47.0 | 47 | 6.6 | % | 0.25 | 20.8 | % | 0.30 | |||
In addition to the three ALESS sources we include UDS 47.0111The numerical identifier for this SCUBA-2 source from Simpson et al. (2017) changed in the final version of the S2CLS UDS catalog Geach et al. (2017) with the source corresponding to UDS0051 in that work. This ALMA identified SMG is cataloged as AS2UDS0051.0 in Stach et al. in prep. from the ALMA follow-up program of the SCUBA-2 Cosmology Legacy Survey (Geach et al., 2017). A pilot study observed the 30 brightest SCUBA-2 sources in the deg2 UKIDSS/UDS field (Simpson et al., 2015a, b, 2017). These 03 resolution ALMA observations revealed a serendipitous detection of [CII] emission at GHz, establishing the redshift as . The now complete ALMA survey of sub-millimeter sources in the UDS field will be reported in Stach et al. (in prep.).
2.1 Physical properties
We determine the far-infrared luminosity of the galaxies in our sample by fitting modified black bodies to their spectral energy distributions (SEDs), including (deblended) 250, 350, 500 m flux densities (see Swinbank et al. 2014). We adopt an average dust temperature of K, a dust emissivity index of and assume the dust is optically thick at m. The choice of dust temperature is motivated by recent studies by Faisst et al. 2017 and Cooke et al. (in prep.), both of which suggest that high-redshift galaxies with high specific star-formation rates have higher characteristic dust temperatures than redshift SMGs ( K e.g., Chapman et al., 2005; Swinbank et al., 2012; Weiß et al., 2013). Cooke et al. (in prep.) stack Herschel PACs and SPIRE photometry (including from 100 m, 160 m, 250 m, 350 m, 500 m) and ALMA m continuum measurements of thirteen ALMA SMGs with similar selection criteria to our sample and show that the ALMA SMGs at redshift have characteristic dust temperatures of K. We note that the far-infrared luminosity is sensitive to the dust temperature, where a lower dust temperature will result in a lower far-infrared luminosity. In Table 1 we provide the far-infrared luminosities from from the best fit modified blackbodies.
| Source name | |||
|---|---|---|---|
| [ M⊙] | [ M⊙] | [ M⊙] | |
| ALESS 61.1 | |||
| ALESS 65.1 | |||
| ALESS 73.1 | |||
| UDS 47.0 |
We calculate the dust masses using the measured continuum flux from ALMA listed in 1 and , where is the Planck-function modified by the dust absorption coefficient of m2 kg-1 (James et al., 2002) which has been corrected from the rest-frame wavelength of m to observed wavelength of m assuming , is the luminosity distance and is the observed flux density at frequency and adopt a characteristic dust temperatures of 50 K and (Table 3). Here we only use a single modified blackbody, however, the dust mass for ALESS 73.1 was determined by Swinbank et al. (2014) to be M⊙ for a multi-component model. This difference in masses is likely due to the different dust temperatures and assumed -values, combined with the fact that the multi-component model trace a larger fraction of the dust mass at multiple temperatures. None of the other three SMGs have previously derived dust masses.
Adopting a single gas-to-dust mass ratio of (Swinbank et al., 2014), we estimate the gas masses (Table 3). Also listed in Table 3 are gas masses estimated using the [CII] luminosities and the scaling relation: (Swinbank et al., 2012). The two independent methods of estimating the gas masses result in masses agreeing within the uncertainties.
3 Observations and reduction
The four SMGs in our sample were observed with ALMA in Band 7 on 2015 November 9–14 for 22.7 to 40.7 min on source, using 44 to 47 antenna in extended configurations, with the longest baselines being km (2015.1.00456.S). The receivers were tuned such that one of the two spectral windows in the 7.5 GHz side-band was centered to cover the expected frequency of the [CII] emission line. The FWHM of the ALMA primary beam is 18″at 345 GHz. For the three ALESS sources, the QSOs J05223627, J03344008, and J03482749 were used as bandpass, flux and phase calibrator, while the QSOs J0238+1636 and J02170820 were used for UDS 47.0.
We used the Common Astronomy Software Application (casa, McMullin et al., 2007) version 4.5.3 to reduce the data for all four sources and version 4.6.0 for further analysis. The ALMA pipeline was used for the reduction and delivered a high-quality product adopted for the analysis without further modifications. The data were imaged using the clean algorithm in casa with natural weighting (ROBUST ) in order to recover as much of the extended emission as possible. We CLEAN the images to the RMS level of 27–47 Jy beam-1 (see Table 2). Using natural weighting and the full available -coverage results in a synthesized beam size of 003002 at position angle (P.A.) of 50–59∘ for all four SMGs. We created maps at intermediate resolution by applying an outer -taper of 3500 k to the data when imaging. This results in a synthesised beam size of 005004 at P.A. of 51–59∘ and an RMS of 35–60 Jy beam-1. Finally, we create our lowest resolution (022018) maps with RMS of 0.2–0.3 mJy beam-1 by applying an outer -taper of 350 k to the data when imaging.
We note that the observations were taken in ALMA’s most extended configuration, which resulted in a well covered -plane for baselines k, but poorer coverage at short baselines equivalent to the largest angular resolution (LAS) of . This means that low surface-brightness emission, normally traced by shorter baselines (i.e. lower resolution) is difficult to detect. As we will show the dust continuum sizes of our sources are LAS and so we recover most of the flux in the naturally weighted maps. However, the [CII] emission in these sources appear more extended and so our high-resolution observations resolve out most of the emission. This can result in an incomplete picture of the morphology and extent of the system and such high-resolution data therefore have to be interpreted with care.
4 Analysis
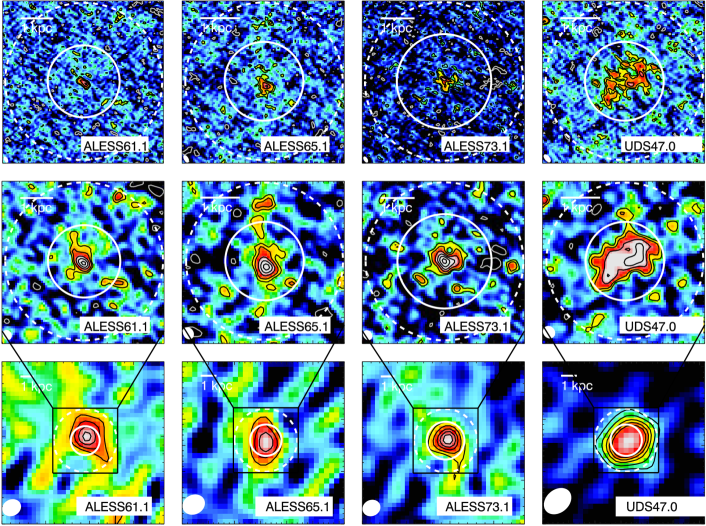
The resolution of the naturally weighted maps (i.e., ) enables us to search for sub-structures in these sources on pc scales. Figure 1 shows the 345 GHz continuum maps at this resolution, which reveal a broad range of apparent morphologies: smooth and compact sources in ALESS 61.1, ALESS 65.1 and ALESS 73.1, and extended structure that appears to break up into pc scale clumps in UDS 47.0.
The peaks of the 345 GHz continuum for the four sources are detected at and with an optimized aperture size determined by using a curve of growth we recover between and % of the integrated flux density measured from the low resolution ALMA Cycle 0/1 observations (Swinbank et al., 2012; De Breuck et al., 2014; Simpson et al., 2015a). This suggests that our maps are missing a fraction of the emission from the most extended low surface brightness dust on scales kpc.
To try to recover more of the extended emission in our maps we also applied an outer -taper to the data, thereby giving a greater weight to the shortest baselines at the cost of reduced resolution. The middle row of Fig. 1 shows the intermediate resolution continuum maps with an outer -taper of 3500 k at a resolution of pc. These maps show more of the extended lower surface brightness emission, and have a higher signal-to-noise ratio than the naturally weighted maps. We therefore fit exponential profiles to these maps and find mean Sérsic indices of , which is in agreement with the indices from resolution imaging of 16 ALESS SMGs (Hodge et al., 2016).
To maximise the recovered flux we applied an outer -taper of 350 k, resulting in our lowest resolution maps of kpc (see bottom row of Fig. 1), which recover 80 to 100% of the continuum flux detected in the ALMA Cycle 0/1 observations (Swinbank et al., 2012; De Breuck et al., 2014; Simpson et al., 2015a, see Table 2). It is only for ALESS 73.1 that there is an indication that we are still resolving out some flux in these low resolution maps, where we recover % of the flux detected in ALMA Cycle 0/1. In later calculations we treat the flux recovered at our low resolution data as the total flux.
4.1 [CII] emission lines
| Source | RMS | S/N | FWHM | FWHM | Aperture | Recovered | |
|---|---|---|---|---|---|---|---|
| [mJy] | [Jy km s-1] | [km s-1] | [arcsec] | [arcsec] | [%] | ||
| ALESS 61.1 | 7.4 | 2.7 | 0.72 | ||||
| ALESS 65.1 | 4.0 | 4.7 | 0.6 | ||||
| ALESS 73.1 | 2.0 | 3.0 | 0.72 | ||||
| UDS 47.0 | 4.4 | 3.1 | 0.6 |
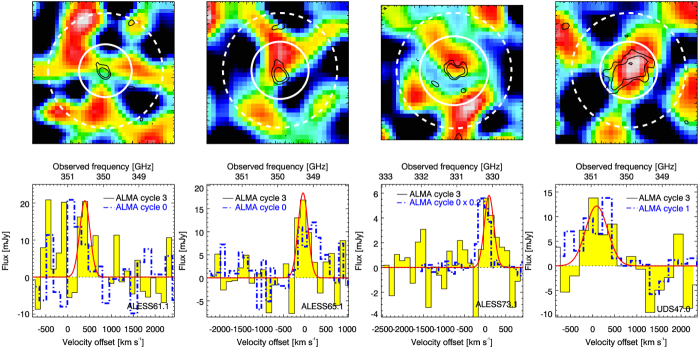
Lower resolution ALMA studies have demonstrated that these four SMGs are all bright [CII] emitters (Swinbank et al., 2012; De Breuck et al., 2014). By using -tapering we recovered between 80-100% of the continuum flux detected in ALMA cycle 0/1. However, -tapering only recovers emission in the image-plane, and does not improve the signal-to-noise of the spectral line. We therefore search for [CII] emission in our 003 observations and select extraction apertures to maximize the recovered signal-to-noise of the line emission. This results in the recovery of modest significant () [CII] emission lines (see Fig. 2), with measured RMS values for the spectra of mJy in 130–210 km s-1 channels (see Table 4). Figure 2 shows the moment-zero maps with a -taper of 500 k () and compares the recovered [CII] emission with the spectra from the lower resolution observations from ALMA Cycle 0 and 1 (Swinbank et al., 2012; De Breuck et al., 2014).
ALESS 61.1 and ALESS 65.1 were detected in [CII] emission in ALMA Cycle 0 and we recover between 90 and 100% of the velocity integrated line flux at 003 resolution, using apertures with diameters of 06 and 072 respectively.
For ALESS 73.1 at 003 resolution (Fig. 2) our observations recover only of the peak flux emission in the 05 resolution map from De Breuck et al. (2014). To compare with the emission line profiles detected in the 05 resolution data (De Breuck et al., 2014), we simply scale the peak of the 05 resolution [CII] line to that of the 003 emission line (i.e., multiply by 0.2). This results in the red wing of the [CII] emission line we detect being consistent with the red wing of the [CII] emission line from the 05 resolution data before down-scaling.
Emission from [CII] was detected for UDS 47.0 as a very broad line at GHz in the shallower 03 data from ALMA Cycle 1 (Simpson et al., 2015b, 2017). In our deeper 003 resolution observations we detect a broad [CII] emission line. Adopting an optimized aperture size of 06 we recover the full flux seen in the shallower low resolution observations from ALMA Cycle 1.
4.2 Size estimates from -plane fits
4.2.1 Continuum
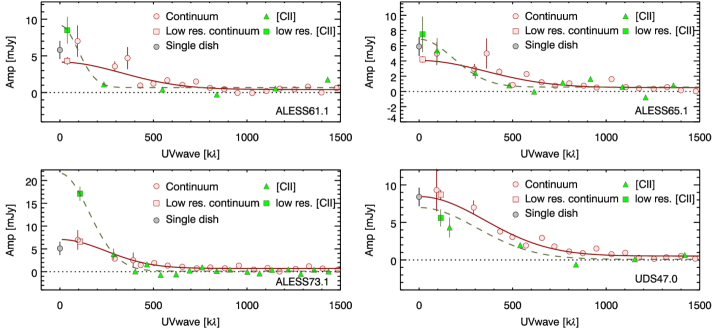
The natural-weighted resolution 345 GHz dust continuum maps recover between 44 to 81% of the continuum flux detected at lower resolution. This suggests that around % of the flux has been resolved out at 003 resolution compared to the Cycle 0/1 maps. To estimate the size of the rest frame 160 m emission in the SMGs we determine the behavior of the amplitude as a function of -distance. We do this by first aligning the phase center of our cubes with the source position listed in Table 1 and then radially average the data in 75 k bins to extract the amplitudes as a function of -separation. For the continuum a binning of 75 k is the most optimal to minimize the scatter, however, the overall trend of the amplitude as a function of -distance is independent of the binning. Figure 3 shows the amplitude as a function of the -distance for the inner 1500 k in each of the four SMGs.
For a point source the observed amplitudes will be constant as a function of -distance, while for an extended source the amplitude declines at larger -distances. Hence the physical size of the source can be determined from the FWHM of a half-Gaussian profile fit to these -profiles. In that case the total flux is represented by the peak value of the half-Gaussian fit. As Fig. 3 shows, the amplitude declines as a function of -distance for the continuum emission in all four SMGs and they are therefore consistent with a centrally peaked brightness profile, meaning that the sources are resolved. We add the low resolution observations from Cycle 0/1 to the plots at the -distance corresponding to the LAS of the observations and the single dish flux at 0 k as these represent our best estimate of the total integrated flux. We fit a half-Gaussian profile plus a constant (representing a point source) to the amplitudes in order to measure the physical size of the emission, and to establish whether a point source is present. The fitted FWHMs converted into physical sizes are listed in Table 2.
We find that the continuum point source components of the fits are non-zero for all four sources, with flux densities of mJy. This suggests that on average about % of the total continuum flux in each source is emitted from a component with a size pc.
There is a published size for the 330 GHz continuum reported of ALESS 73.1 (De Breuck et al., 2014). To compare with this we derive a size from a single Gaussian fit without a point source of which is consistent.
As already stated we only recover the total continuum flux density from the low-resolution observations in the -tapered map by applying an outer taper of k. Figure 3 illustrates that, since the amplitudes only diverge from the constant value of mJy at -distances of k, only a strong -taper gives enough weight to the shortest baselines to lower the resolution sufficiently to make a significant difference in the recovered flux density.
4.2.2 [CII] emission
We recover [CII] emission lines in all four SMGs, but only at low significance (2.7–4.7). To determine whether the [CII] emission is resolved and to estimate its extent, we extract the amplitude as a function of the -distance for the spectral channels spanning the [CII] emission. We align the phase centre to the same position as for the continuum and fit a zero-order polynomial in the -plane to the line free channels to determine the continuum level. We then subtract the fitted continuum in the -plane and extract the amplitude as a function of -distance for the spectral channels spanning the [CII] emission. Estimates of the physical extent of the [CII] emission use the same method as for the continuum, i.e., by fitting a half-Gaussian profile plus a point source component to the amplitude as a function of the -distance, and converting the fitted FWHMs of the Gaussian profile to arc-seconds. Figure 3 shows the profiles of the continuum emission and the [CII] emission, with the FWHMs given in Table 4. Note that besides the poor sampling of the inner part of the -plane, the visibilities for the [CII] data are derived from only a limited spectral range and so contain fewer data points, and we therefore have to apply a larger binning of 300 k for ALESS 61.1 and UDS 47.0 and 75 k for ALESS 65.1 and ALESS 73.1. De Breuck et al. (2014) measure the [CII] emission to have a FWHM of in ALESS 73.1, which is consistent with our measurements (FWHM).
Our data are not well enough sampled to establish whether unresolved [CII] emitting components are present in these four SMGs. The lower sampling of visibility points in the [CII] data also means that the measured sizes are more uncertain than that measured for the 345 GHz continuum. We include the lower resolution observations from Cycle 0/1 in our fits yielding estimated FWHMs of , comparable or larger than the LAS of recoverable at the antenna configuration of our Cycle 3 observations.
5 Discussion
5.1 Continuum and [CII] sizes
From the half-Gaussian profile fits in Fig. 3 we measure the median continuum size to be 032003 and the [CII] size to be (see Tables 2 and 4). The measured size ratio for our sample suggest that on average the [CII] emitting gas is times more extended than the continuum emitting dust. The fact that the continuum sizes are smaller than the LAS, allows us to recover between 80 to 100% of the flux detected in ALMA cycle 0/1. The [CII] sizes, however, are larger than the LAS, meaning it is not possible to recover the emission distributed on scales larger than the LAS. This therefore results in low signal-to-noise [CII] emission lines and low significance moment-zero maps (Fig. 2).
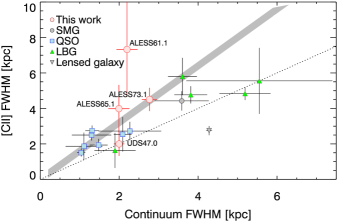
Figure 4 compares our estimated [CII] and rest-frame 160 m continuum sizes for our SMGs. It also shows the [CII] and rest-frame 160 m dust continuum sizes for four quasars at (Wang et al., 2013; Kimball et al., 2015; Díaz-Santos et al., 2016; Venemans et al., 2017), a starburst galaxy at (Nesvadba et al., 2016), a Lyman- Blob at (Umehata et al., 2017) and LBGs at (Capak et al., 2015; Jones et al., 2017). The [CII] and rest-frame 160 m dust continuum observations have been taken at the same spatial resolution in each source, but this varies between 02 and 1″. These observations appear to support the conclusion that [CII] emitting components are more extended than the rest-frame 160 m dust components in a majority of the systems.
Although the resolution of these studies is times lower than our observations, the relative sizes of the [CII] and rest-frame 160 m dust emission still suggest that the [CII] emitting gas is more extended than the rest-frame 160 m continuum. The weighted mean of the [CII] to rest-frame 160 m dust continuum size, including our four SMGs and the comparison sample, is . Only three of the eighteen galaxies have apparently larger rest-frame 160 m continuum than [CII] sizes and therefore lie off this relation, and only one of these is significantly different: a lensed starburst galaxy, where the relative sizes are sensitive to the details of the lens model. The fact that the majority of the galaxies follow a trend, although they are very different populations with different gas masses and AGN luminosities, suggests that these global physical parameters are unlikely to account for the observed size differences. This means that the nature of the dominant heating source (whether, for example, it is AGN or starburst activity) does not appear to significantly influence the relative size of the rest-frame 160 m dust continuum and [CII] emitting gas.
At these high redshifts () the temperature of the cosmic microwave background (CMB) is K. This means that if the star-forming dust has similar temperature to the CMB, it will not be detectable (da Cunha et al., 2013; Zhang et al., 2016). We note that given that the dust temperature is higher than the background CMB, this means that the CMB is unlikely to be the reason why the [CII] emission is times more extended than the rest-frame 160 m dust emission.
5.2 Velocity gradients and dynamical masses
The [CII] emission line is one of the brightest cooling lines of the interstellar medium and traces the ionized, neutral and molecular gas. It is therefore a good tracer of the gas dynamics in high-redshift galaxies (e.g., Carniani et al., 2013; Capak et al., 2015). Only ALESS 73.1 and UDS 47.0 have low-resolution observations from Cycle 0/1 deep enough to allow us to search for possible velocity gradients. From the study of De Breuck et al. (2014) it is already known that the gas in ALESS 73.1 has a rotating configuration, and the broad line of UDS 47.0 suggests that a velocity gradient may also be present there.
To investigate the velocity gradient in these two SMGs we make moment-zero maps (i.e., narrow-band images) in the low resolution (from ALMA Cycle 0/1, see Table 1) continuum-subtracted cube of the channels covering the [CII] emission. We make two independent maps; one of the redshifted half of the line and the other of the blueshifted half. These cover km s-1 for UDS 47.0 and km s-1 for ALESS 73.1. We find that the peak of the [CII] emission shifts by ( kpc) between the red and blue halves of the line for UDS 47.0 and ( kpc) for ALESS 73.1. This implies a velocity gradient across the [CII] emitting gas in both SMGs.
Having established the presence of a velocity gradient and using a disk model for the dynamics, we estimate the dynamical masses () of ALESS 73.1 and UDS 47.0 within a region given by twice the size of the [CII] sizes listed in Table 2 corresponding to kpc and kpc for ALESS 73.1 and UDS 47.0, respectively. Using the line widths of the [CII] lines detected in ALMA Cycle 0/1 (see Table 1), this yields dynamical masses of M⊙ for ALESS 73.1 and M⊙ for UDS 47.0. Using a similar disk model De Breuck et al. (2014) estimate an inclination angle of for ALESS 73.1, which is similar to the average inclination angle calculated by Law et al. (2009). By assuming the same inclination angle for UDS 47.0 and the gas masses listed in Table 3, we estimate an average gas mass fraction within the half mass radii assumed to calculate the dynamical masses of . This is in agreement with the result from Tacconi et al. (2017) for redshift star forming galaxies when converting to the same units.
5.3 Morphologies
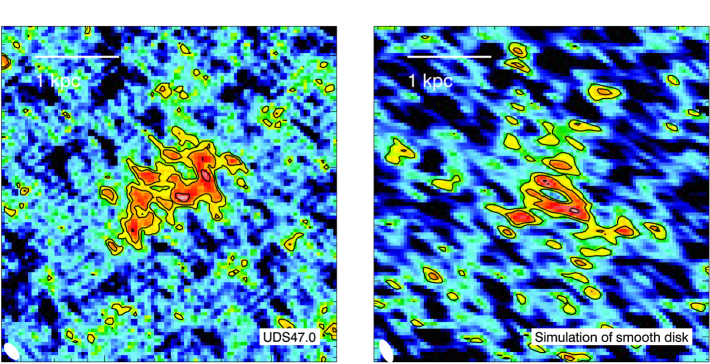
Figure 1 demonstrates that three SMGs in our sample (ALESS 61.1, ALESS 65.1, and ALESS 73.1) show smooth 345 GHz dust continuum morphology, while one (UDS 47.0) appears to have structure. However, the apparent structures seen for UDS 47.0 have significance levels of just . Similarly, a recent high-resolution (003) resolution 345 GHz dust continuum study by Iono et al. (2016) of three AzTEC SMGs claimed to reveal about 200 pc clumps. These visually identified structures are similar to the features we see in UDS 47.0.
To test whether the structures in UDS 47.0 are likely to be real, or if they could arise from noise in smooth disk light profiles we model a set of observations of smooth profiles. We use the casa tasks simobservations and simanalysis to create a library of simulated interferometry observations of exponential disks as they would appear if observed with ALMA in the same configuration as used for our observations and with similar noise properties (following the example of Hodge et al. 2016). Our 50 input models of smooth exponential disk models have Sérsic indices of (comparable to what we see in our sample) and flux densities and sizes of mJy and , as seen for UDS 47.0 (Simpson et al., 2015a). The results of these simulations also reveal apparently clump-like structures (Fig. 5). While these structures qualitatively look similar to those seen in UDS 47.0, we attempt to quantitatively compare the flux distribution between the simulated maps and the observed map for UDS 47.0. We do this by fitting single smooth profiles (with the Sérsic index as a free parameter, to the simulated maps), and subtracting the best fit model. For the central part of the residual image, the number of pixels as a function of the flux has a Gaussian profile with a tail of excess emission at positive values. This excess flux should represent the emission seen in possible structures, and we isolate it by subtracting a one-dimensional-Gaussian profile fit to the histogram.
We apply this analysis to both the simulated smooth disks, and the observation of UDS 47.0. A Kolmogorov-Smirnov test comparing the average of the residual pixel distribution from the simulated smooth disks and that of the observations, reveals that the likelihood of the observed map being drawn from the simulated library of smooth disks is . Applying the same analysis for the three other SMGs in our sample, show that they are consistent with smooth morphologies.
Our simulated library of smooth disks in combination with the apparently smooth morphology of three out of four SMGs in our sample, illustrates that smooth disks can appear to have substructures when observed at high-resolution and with sparse coverage of the inner part of the -plane. We conclude that it is therefore not possible to rule out the hypothesis that all four SMGs in our sample are smooth exponential disks.
We note that the structures identified by Iono et al. (2016) in their sources have similar significances to those seen in UDS 47.0. Moreover only % of the continuum flux detected at 07 resolution with the SMA (Iono et al., 2016; Younger et al., 2008) has been recovered in their 003 ALMA maps, with less than % of that in the claimed clumps. The fact that the resolution and depth of the observations in Iono et al. (2016) are similar to our 003 maps and that their claimed structures contain only a small fraction of the total flux, casts doubt on whether their clumps are real structures either.
5.4 Expected size of clumps
As noted above, one of the sources in our sample (UDS 47.0) appears to have a clumpy morphology in our high resolution ALMA continuum maps, however we have suggested that this is not statistically significant. Nevertheless, we can also ask if we should expect to see sub-structures at this resolution, given the estimated star-formation rate surface densities of these galaxies.
The average sizes of star-forming clumps in a self-gravitating gas disk are given by the Jeans length,
| (1) |
where is the gravitational constant, is the gas surface density, and the velocity dispersion of the gas within a clump (Toomre, 1964). We estimate using:
| (2) |
where and (Kennicutt, 1998; Swinbank et al., 2012). For clumps to have a size of pc (and thus be observable at the resolution of our observations at the estimated gas surface density), the velocity dispersions within the gas disk have to be km s-1 for ALESS 61.1, which has the lowest estimated gas surface density of our sample, and km s-1 for UDS 47.0, which has the highest gas surface density.
A recent high resolution () observation of the lensed SMG SDP.81 (ALMA Partnership et al., 2015; Hatsukade et al., 2015) measured the velocity dispersions in regions within the gas disk in this system to be in the range km s-1 (Swinbank et al., 2015). The velocity dispersion of the gas disk in ALESS 73.1 was likewise estimated to be km s-1 (De Breuck et al., 2014). Thus the required velocity dispersions to observe clumps at 200 pc resolution are 1.5–2 times higher than that observed in other SMGs. Hence if our sources have velocity dispersions comparable to that observed for other SMGs, then any clumps in their gas disks would have sizes below the resolution limit of our ALMA observations. This suggests that the clumps in UDS 47.0, if real, are unlikely to represent self-gravitating physical structures.
5.5 The [CII] deficit
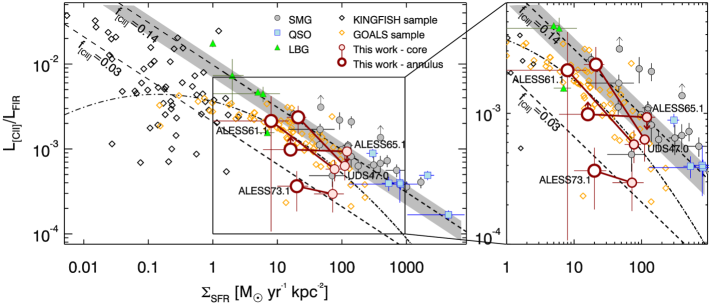
We now turn to the overall energetics of these systems and their cooling. As noted earlier, emission from [CII] is a major contributor to the gas cooling, carrying 0.1–1% of the far-infrared luminosity in luminous starburst galaxies (Stacey et al., 1991; Brauher et al., 2008; Graciá-Carpio et al., 2011). The [CII] to far-infrared luminosity ratio (/) varies with far-infrared luminosity in local galaxies, such that the most far-infrared-luminous galaxies have a lower / ratio. Figure 6 shows / as function of star-formation rate surface density for the low-redshift KINGFISH sample (Kennicutt et al., 2011; Dale et al., 2016; Croxall et al., 2017), the GOALS sample (Díaz-Santos et al., 2013; Lutz et al., 2016b), and a high-redshift sample of SMGs (Gullberg et al., 2015; Lutz et al., 2016a, typically lensed).
At the highest star-formation rate surface densities (i.e., typically smaller sizes, FWHM kpc) we see that the lowest / ratios, are frequently associated with active galactic nuclei (AGN), while normal star-forming galaxies (including Lyman Break galaxies) have higher / ratios.
We see in Fig. 6 that the / ratios for our sample agree with the high redshift comparison sample, but both show a large scatter when compared to the local galaxies from KINGFISH and GOALS. Figure 6 shows that the high redshift sources in general have higher / compared to local galaxies at a fixed far-infrared luminosity.
To investigate if the [CII] deficit is due to a local or global process, we plot two points for each of our SMGs: a core measurement from an aperture the same size as the 345 GHz dust continuum (Table 2); and an annulus the size of the optimised [CII] aperture listed in Table 4. The [CII] luminosities are calculated by extracting two spectra, one within the continuum aperture and one within the [CII] aperture; the [CII] luminosity in the annulus is then given by the difference between the two luminosities. Note that for ALESS 65.1 the [CII] emission line is undetected in the core, meaning that the / ratio for the core is an upper limit and therefore a lower limit within the annulus. We scale the far-infrared luminosities and star-formation rates according to the fraction of emission we recover within the 345 GHz dust continuum apertures (see Table 2), and assume that the remaining fraction originates from the annulus. The star-formation rate surface densities are then calculated using the areas of the continuum apertures for the core measurement and the difference between the [CII] and continuum apertures for the annuli.
We use these measurements to investigate the variations of the / ratio within our SMGs. The expanded part of Fig. 6 shows the trend between the core measurements and the annuli. All four of the galaxies show the same behavior: the core has lower / and higher star-formation rate surface density than the surrounding annulus. This follows the relation seen by Smith et al. (2017) for local star-forming galaxies. A higher star-formation rate surface density in the core regions compared with the outer annuli is expected, however, the same expectation is not true for the / ratio.
The fact that our SMGs follow the same trend seen by for example Smith et al. (2017), implies that the [CII] deficit in SMGs is also due to a local process, where the core regions have a higher [CII] deficit than the regions further out from the core.
Smith et al. (2017) suggest that the [CII] deficit is related to the metallicity of the gas, where a low metallicity results in a high / ratio. Alternatively a recent study by Muñoz & Oh (2016) explored the possibility of [CII] saturation. This hypotheses had been proposed before but had not been investigated in detail (e.g., Stacey et al., 2010; Díaz-Santos et al., 2013; Magdis et al., 2014; Gullberg et al., 2015). Muñoz & Oh (2016) show that the [CII] emission can be thermally saturated at high temperatures. At gas temperatures K (the ground state temperature of [CII]) the [CII] cooling rate becomes constant, forcing the gas to cool through other channels (e.g., the [OI]63 m fine structure line). This means that the [CII] emission line saturates, and a [CII] deficit can therefore occur as a result of the further increase of the far-infrared luminosity. By considering the specific [CII] luminosity (the [CII] luminosity to [CII] mass ratio, /) and specific far-infrared luminosity (the far-infrared luminosity to gas mass ratio, /), Muñoz & Oh (2016) predict an / relation dependent on the infrared surface density () and fraction of the gas mass in ionized carbon ():
| (3) |
Here is estimated to between 0.10 and 0.17, assuming a fixed CO(1–0) to [CII] luminosity ratio, the CO to H2 conversion factor (), a gas density higher than the critical density of [CII] ( cm-3, e.g., Stacey et al. 2010) and a temperature higher than 92 K. This fraction does not take into account that some of the carbon is in the neutral phase, meaning that the actual mass fraction is likely to be lower. The relation between the [CII] to far-infrared luminosity ratio as a function of the star-formation rate surface density found by Muñoz & Oh (2016) adopt fixed values of and cm-3 for the radiation field strength and the gas density. We plot the predicted trend line on Fig. 6 for =0.03 and 0.14 which span the range of the data, suggesting that fraction of the total mass in ionised carbon is between 3–14%.
However, other studies, for example Díaz-Santos et al. (2017) and Lagache et al. (2017), argue the [CII] deficit arises from other factors. In particular, they emphasise the importance of a varying radiation field strength to gas density ratio (). Díaz-Santos et al. (2017) fits a power law to local ULIRGs from GOALS (see Equation 3 in Díaz-Santos et al. 2017) and find that the suppression of the [CII] to far-infrared luminosity ratio at high far-infrared surface densities could be due to high ratios. Using semi-analytical models Lagache et al. (2017) likewise suggest that the [CII] to far-infrared deficit is correlated with the intensity of the interstellar radiation field. This suggests that the star-formation rate surface density is dependent on the geometric of the photon dominated regions and the distribution of the gas and dust within it.
We show the relation between the [CII] to far-infrared luminosity ratio and the star-formation rate surface density with in Fig. 6 along with the power law relation determined by Díaz-Santos et al. (2017). Both the power law from Díaz-Santos et al. (2017) and the model of Muñoz & Oh (2016) are in agreement with our observations. This means that it is not possible with the existing data to distinguish between the two models and determine if the [CII] deficit can be explained by a saturation of the [CII] emission at high temperatures and densities in the dense core regions of the SMGs or a high ratio of radiation field strength to gas density. We also note that contributions from other local processes (e.g., [CII] self-absorption, dust extinction, and dust grain charge), may also play a role in the deficit (Smith et al., 2017).
6 Conclusions
We present deep high-resolution (003) ALMA Band 7 observations of the dust continuum and the redshifted [CII] m emission line in four SMGs from the ALESS and AS2UDS surveys at .
These observations resolve the dust and gas distribution on pc scales and reveal a range of morphologies, ranging from compact and smooth to extended and apparently clumpy.
By determining the amplitudes as function of the -distance for both the continuum and [CII] emission, we conclude that the [CII] emission is more extended than the rest-frame 160 m dust continuum emission by a factor of .
This behavior is also seen in a sample of high-redshift galaxies from the literature, where we find a mean ratio of the [CII] to rest-frame 160 m dust size of .
Three of our four SMGs show smooth continuum morphologies at sub-kpc resolution, the fourth, UDS 47.0 appears clumpy at 200 pc resolution. To determine whether the apparent clumps in UDS 47.0 are real we compare with simulated observations of smooth exponential disks.
These comparisons show that smooth morphologies can appear clumpy if observed at high resolution, even in deep observations such as those used here.
We conclude that it is not possible to rule out the hypothesis that all of our SMGs are smooth exponential disks.
Deeper observations are required to further test this.
By comparing the / ratio as a function of the star-formation rate surface density for the core with a diameter of kpc of our SMGs to that in the lower-density outskirts, we conclude that the [CII] deficit is likely to be due to local processes, which is in agreement with the conclusion of Smith et al. (2017).
Comparing the observed relation between the / ratio and the star-formation rate surface density, we find trends which agree with both the relation derived by Muñoz & Oh (2016) based on a thermal saturation of the [CII] emission and Díaz-Santos et al. (2017) based on high radiation field strength to gas density ratios.
It is not possible therefore at this stage to determine which of these models best explains the [CII] deficit.
Deeper [CII] observations with -coverage at both long, medium and short baselines are necessary to test the hypothesis that SMGs having smooth or clumpy structures and to establish what physical processes drive the [CII] deficit.
References
- ALMA Partnership et al. (2015) ALMA Partnership, Vlahakis, C., Hunter, T. R., et al. 2015, ApJ, 808, L4
- Armus et al. (2009) Armus, L., Mazzarella, J. M., Evans, A. S., et al. 2009, PASP, 121, 559
- Bothwell et al. (2013) Bothwell, M. S., Smail, I., Chapman, S. C., et al. 2013, MNRAS, 429, 3047
- Bournaud et al. (2014) Bournaud, F., Perret, V., Renaud, F., et al. 2014, ApJ, 780, 57
- Brauher et al. (2008) Brauher, J. R., Dale, D. A., & Helou, G. 2008, ApJS, 178, 280
- Capak et al. (2015) Capak, P. L., Carilli, C., Jones, G., et al. 2015, Nature, 522, 455
- Carniani et al. (2013) Carniani, S., Marconi, A., Biggs, A., et al. 2013, A&A, 559, A29
- Casey et al. (2014) Casey, C. M., Narayanan, D., & Cooray, A. 2014, Phys. Rep., 541, 45
- Chapman et al. (2005) Chapman, S. C., Blain, A. W., Smail, I., & Ivison, R. J. 2005, ApJ, 622, 772
- Chapman et al. (2004) Chapman, S. C., Smail, I., Blain, A. W., & Ivison, R. J. 2004, ApJ, 614, 671
- Chen et al. (2015) Chen, C.-C., Smail, I., Swinbank, A. M., et al. 2015, ApJ, 799, 194
- Clements & Baker (1996) Clements, D. L., & Baker, A. C. 1996, A&A, 314, L5
- Coppin et al. (2009) Coppin, K. E. K., Smail, I., Alexander, D. M., et al. 2009, MNRAS, 395, 1905
- Cowley et al. (2017) Cowley, W. I., Béthermin, M., Lagos, C. d. P., et al. 2017, MNRAS, 467, 1231
- Croxall et al. (2012) Croxall, K. V., Smith, J. D., Wolfire, M. G., et al. 2012, ApJ, 747, 81
- Croxall et al. (2017) Croxall, K. V., Smith, J. D., Pellegrini, E., et al. 2017, ApJ, 845, 96
- da Cunha et al. (2013) da Cunha, E., Groves, B., Walter, F., et al. 2013, ApJ, 766, 13
- Dale et al. (2016) Dale, D. A., Beltz-Mohrmann, G. D., Egan, A. A., et al. 2016, AJ, 151, 4
- De Breuck et al. (2014) De Breuck, C., Williams, R. J., Swinbank, M., et al. 2014, The Messenger, 156, 38
- Dekel et al. (2009) Dekel, A., Sari, R., & Ceverino, D. 2009, ApJ, 703, 785
- Díaz-Santos et al. (2013) Díaz-Santos, T., Armus, L., Charmandaris, V., et al. 2013, ApJ, 774, 68
- Díaz-Santos et al. (2016) Díaz-Santos, T., Assef, R. J., Blain, A. W., et al. 2016, ApJ, 816, L6
- Díaz-Santos et al. (2017) Díaz-Santos, T., Armus, L., Charmandaris, V., et al. 2017, ApJ, 846, 32
- Elmegreen et al. (2009) Elmegreen, D. M., Elmegreen, B. G., Marcus, M. T., et al. 2009, ApJ, 701, 306
- Engel et al. (2010) Engel, H., Tacconi, L. J., Davies, R. I., et al. 2010, ApJ, 724, 233
- Faisst et al. (2017) Faisst, A. L., Capak, P. L., Yan, L., et al. 2017, ApJ, 847, 21
- Farrah et al. (2001) Farrah, D., Rowan-Robinson, M., Oliver, S., et al. 2001, MNRAS, 326, 1333
- Farrah et al. (2013) Farrah, D., Lebouteiller, V., Spoon, H. W. W., et al. 2013, ApJ, 776, 38
- Förster Schreiber et al. (2011) Förster Schreiber, N. M., Shapley, A. E., Genzel, R., et al. 2011, ApJ, 739, 45
- Geach et al. (2017) Geach, J. E., Dunlop, J. S., Halpern, M., et al. 2017, MNRAS, 465, 1789
- Genzel et al. (2012) Genzel, R., Tacconi, L. J., Combes, F., et al. 2012, ApJ, 746, 69
- Graciá-Carpio et al. (2011) Graciá-Carpio, J., Sturm, E., Hailey-Dunsheath, S., et al. 2011, ApJ, 728, L7
- Gullberg et al. (2015) Gullberg, B., De Breuck, C., Vieira, J. D., et al. 2015, MNRAS, 449, 2883
- Hailey-Dunsheath et al. (2010) Hailey-Dunsheath, S., Nikola, T., Stacey, G. J., et al. 2010, ApJ, 714, L162
- Hatsukade et al. (2015) Hatsukade, B., Tamura, Y., Iono, D., et al. 2015, PASJ, 67, 93
- Hayward et al. (2011) Hayward, C. C., Kereš, D., Jonsson, P., et al. 2011, ApJ, 743, 159
- Hill et al. (2005) Hill, T., Burton, M. G., Minier, V., et al. 2005, MNRAS, 363, 405
- Hodge et al. (2013) Hodge, J. A., Karim, A., Smail, I., et al. 2013, ApJ, 768, 91
- Hodge et al. (2016) Hodge, J. A., Swinbank, A. M., Simpson, J. M., et al. 2016, ApJ, 833, 103
- Ikarashi et al. (2015) Ikarashi, S., Ivison, R. J., Caputi, K. I., et al. 2015, ApJ, 810, 133
- Iono et al. (2016) Iono, D., Yun, M. S., Aretxaga, I., et al. 2016, ApJ, 829, L10
- Ivison et al. (2010) Ivison, R. J., Swinbank, A. M., Swinyard, B., et al. 2010, A&A, 518, L35
- Ivison et al. (2012) Ivison, R. J., Smail, I., Amblard, A., et al. 2012, MNRAS, 425, 1320
- James et al. (2002) James, A., Dunne, L., Eales, S., & Edmunds, M. G. 2002, MNRAS, 335, 753
- Jones et al. (2017) Jones, G. C., Willott, C. J., Carilli, C. L., et al. 2017, ApJ, 845, 175
- Kennicutt et al. (2011) Kennicutt, R. C., Calzetti, D., Aniano, G., et al. 2011, PASP, 123, 1347
- Kennicutt (1998) Kennicutt, Jr., R. C. 1998, ARA&A, 36, 189
- Kennicutt & Chu (1988) Kennicutt, Jr., R. C., & Chu, Y.-H. 1988, AJ, 95, 720
- Kimball et al. (2015) Kimball, A. E., Lacy, M., Lonsdale, C. J., & Macquart, J.-P. 2015, MNRAS, 452, 88
- Lagache et al. (2017) Lagache, G., Cousin, M., & Chatzikos, M. 2017, ArXiv e-prints, arXiv:1711.00798
- Law et al. (2009) Law, D. R., Steidel, C. C., Erb, D. K., et al. 2009, ApJ, 697, 2057
- Livermore et al. (2012) Livermore, R. C., Jones, T., Richard, J., et al. 2012, MNRAS, 427, 688
- Lord et al. (1996) Lord, S., Malhotra, S., Helou, G., et al. 1996, in Bulletin of the American Astronomical Society, Vol. 28, American Astronomical Society Meeting Abstracts #188, 929
- Luhman et al. (2003) Luhman, M. L., Satyapal, S., Fischer, J., et al. 2003, ApJ, 594, 758
- Luhman et al. (1998) —. 1998, ApJ, 504, L11
- Lutz et al. (2016a) Lutz, D., Berta, S., Contursi, A., et al. 2016a, A&A, 591, A136
- Lutz et al. (2016b) —. 2016b, A&A, 591, A136
- Madden et al. (1993) Madden, S. C., Geis, N., Genzel, R., et al. 1993, ApJ, 407, 579
- Magdis et al. (2014) Magdis, G. E., Rigopoulou, D., Hopwood, R., et al. 2014, ApJ, 796, 63
- Malhotra (2001) Malhotra, S. 2001, in ESA Special Publication, Vol. 460, The Promise of the Herschel Space Observatory, ed. G. L. Pilbratt, J. Cernicharo, A. M. Heras, T. Prusti, & R. Harris, 155
- Malhotra et al. (1997) Malhotra, S., Helou, G., Stacey, G., et al. 1997, ApJ, 491, L27
- McMullin et al. (2007) McMullin, J. P., Waters, B., Schiebel, D., Young, W., & Golap, K. 2007, in Astronomical Society of the Pacific Conference Series, Vol. 376, Astronomical Data Analysis Software and Systems XVI, ed. R. A. Shaw, F. Hill, & D. J. Bell, 127
- Muñoz & Oh (2016) Muñoz, J. A., & Oh, S. P. 2016, MNRAS, 463, 2085
- Nesvadba et al. (2016) Nesvadba, N., Kneissl, R., Cañameras, R., et al. 2016, A&A, 593, L2
- Oteo et al. (2017) Oteo, I., Zwaan, M. A., Ivison, R. J., Smail, I., & Biggs, A. D. 2017, ApJ, 837, 182
- Riechers et al. (2011) Riechers, D. A., Cooray, A., Omont, A., et al. 2011, ApJ, 733, L12
- Sakamoto et al. (2008) Sakamoto, K., Wang, J., Wiedner, M. C., et al. 2008, ApJ, 684, 957
- Sanders & Mirabel (1996) Sanders, D. B., & Mirabel, I. F. 1996, ARA&A, 34, 749
- Shibuya et al. (2015) Shibuya, T., Ouchi, M., & Harikane, Y. 2015, ApJS, 219, 15
- Simpson et al. (2015a) Simpson, J. M., Smail, I., Swinbank, A. M., et al. 2015a, ApJ, 807, 128
- Simpson et al. (2015b) —. 2015b, ApJ, 799, 81
- Simpson et al. (2017) —. 2017, ApJ, 839, 58
- Smith et al. (2017) Smith, J. D. T., Croxall, K., Draine, B., et al. 2017, ApJ, 834, 5
- Stacey et al. (1991) Stacey, G. J., Geis, N., Genzel, R., et al. 1991, ApJ, 373, 423
- Stacey et al. (2010) Stacey, G. J., Hailey-Dunsheath, S., Ferkinhoff, C., et al. 2010, ApJ, 724, 957
- Surace et al. (2001) Surace, J. A., Sanders, D. B., & Evans, A. S. 2001, AJ, 122, 2791
- Swinbank et al. (2010) Swinbank, A. M., Smail, I., Longmore, S., et al. 2010, Nature, 464, 733
- Swinbank et al. (2012) Swinbank, A. M., Karim, A., Smail, I., et al. 2012, MNRAS, 427, 1066
- Swinbank et al. (2014) Swinbank, A. M., Simpson, J. M., Smail, I., et al. 2014, MNRAS, 438, 1267
- Swinbank et al. (2015) Swinbank, A. M., Dye, S., Nightingale, J. W., et al. 2015, ApJ, 806, L17
- Tacconi et al. (2008) Tacconi, L. J., Genzel, R., Smail, I., et al. 2008, ApJ, 680, 246
- Tacconi et al. (2017) Tacconi, L. J., Genzel, R., Saintonge, A., et al. 2017, ArXiv e-prints, arXiv:1702.01140
- Toomre (1964) Toomre, A. 1964, ApJ, 139, 1217
- Umehata et al. (2017) Umehata, H., Matsuda, Y., Tamura, Y., et al. 2017, ApJ, 834, L16
- Valtchanov et al. (2011) Valtchanov, I., Virdee, J., Ivison, R. J., et al. 2011, MNRAS, 415, 3473
- Veilleux (2002) Veilleux, S. 2002, in Astronomical Society of the Pacific Conference Series, Vol. 254, Extragalactic Gas at Low Redshift, ed. J. S. Mulchaey & J. T. Stocke, 313
- Venemans et al. (2017) Venemans, B. P., Walter, F., Decarli, R., et al. 2017, ApJ, 837, 146
- Wang et al. (2013) Wang, R., Wagg, J., Carilli, C. L., et al. 2013, ApJ, 773, 44
- Weiß et al. (2009) Weiß, A., Kovács, A., Coppin, K., et al. 2009, ApJ, 707, 1201
- Weiß et al. (2013) Weiß, A., De Breuck, C., Marrone, D. P., et al. 2013, ApJ, 767, 88
- Younger et al. (2008) Younger, J. D., Fazio, G. G., Wilner, D. J., et al. 2008, ApJ, 688, 59
- Zhang et al. (2016) Zhang, Z.-Y., Papadopoulos, P. P., Ivison, R. J., et al. 2016, Royal Society Open Science, 3, 160025