HI Observations of Major-merger Pairs at z = 0: atomic gas and star formation
Abstract
We present a study of the Hi gas content of a large K-band selected sample of 88 close major-merger pairs of galaxies (H-KPAIR) which were observed by . We obtained the 21 cm Hi fine-structure emission line data for a total of 70 pairs from this sample, by observing 58 pairs using the Green Bank Telescope (GBT) and retrieving the Hi data for an addition 12 pairs from the literature. In this Hi sample, 34 pairs are spiral-spiral (S+S) pairs, and 36 are spiral-elliptical (S+E). Based on these data, we studied the Hi-to-stellar mass ratio, the Hi gas fraction and the Hi star formation efficiency (SFE= star formation rate/) and searched for differences between S+S and S+E pairs, as well as between pairs with and without signs for merger/interaction. Our results showed that the mean Hi-to-stellar mass ratio of spirals in these pairs is , consistent with the average Hi gas fraction of spiral galaxies in general. The differences in the Hi gas fraction between spirals in S+S and in S+E pairs, and between spirals in pairs with and without signs of merger/interaction are insignificant (). On the other hand, the mean SFE of S+S pairs is higher than that of S+E pairs. This difference is very significant () and is the main result of our study. There is no significant difference in the mean SFE between galaxies with and without signs of merger/interaction. The mean SFE of the whole pair sample is , corresponding to a Hi consumption time of Gyrs.
Subject headings:
galaxies: interactions — galaxies: evolution — galaxies: star formation1. INTRODUCTION
It has been well documented that galaxy-galaxy interaction can induce enhanced star formation (Larson & Tinsley, 1978; Keel et al., 1985; Kennicutt et al., 1987; Bushouse et al., 1988; Telesco et al., 1988; Sulentic, 1989; Xu & Sulentic, 1991; Barton et al., 2000; Lambas et al., 2003; Alonso et al., 2004; Nikolic et al., 2004; Li et al., 2008; Ellison et al., 2008; Xu et al., 2010). More recently, Scudder et al. (2012) and Patton et al. (2013) found that wide galaxy pairs with separation as large as 80 kpc still show significant star formation rate (SFR) enhancement at 40% level. Early studies (Hummel, 1981; Haynes & Herter, 1988; Bergvall et al., 2003) that failed to detect SFR enhancement in interacting galaxies may have suffered from biases in selecting the interacting galaxy sample and the control sample (Xu et al., 2010; Ellison et al., 2010, c.f.).
Of particular interest are close (separation ) major mergers of galaxies of nearly equal mass (primary-to-secondary mass ratio ). Most extreme starbursts such as ultra-luminous infrared galaxies (ULIRGs) are close major mergers (Sanders & Mirabel, 1996; Dasyra et al., 2006). For a sample of K-band selected close major-merger pairs, IR observations carried out using (Xu et al., 2010) and (Cao et al., 2016) found that in these pairs the average specific SFR (sSFR = SFR/) in spirals is a factor of 2 higher than that of their counterparts in the control sample. Furthermore, spirals in spiral-spiral pairs (S+S pairs) are strongly enhanced with the mean sSFR 3 times higher than that of control galaxies, but spirals in mixed spiral-elliptical pairs (S+E pairs) do not show any significant SFR enhancement compared to the control galaxies. Using and data, Domingue et al. (2016) also found that spirals in S+S pairs exhibit significant enhancements in interstellar radiation field and dust temperature while spirals in S+E pairs do not.
Why is the sSFR enhancement of spirals in mixed S+E pairs different from that of spirals in S+S pairs? If the enhancement is purely due to gravitational tidal effect, then the spirals in S+E pairs should behave similarly to spirals in S+S pairs unless the former have systematically less cold gas (i.e. the fuel for star formation) than the latter. This possibility has been tested by Cao et al. (2016). Using fluxes in six bands (70, 100, 160, 250, 350, and 500 ), they estimated dust mass () and, assuming a constant dust-to-gas mass ratio, total gas mass () for the paired spirals. They found only marginal evidence for spirals in S+E pairs having slightly lower gas content than those in S+S pairs (). It appears that the difference between the sSFR enhancements of spirals in mixed S+E pairs and of those in S+S pairs is mainly due to their different star formation efficiency (SFE = SFR/), suggesting significant roles for non-tidal effects (e.g. collision between gas in two galaxies) in the interaction induced star formation.
In this paper, we represent a study on the Hi gas content of pairs. The main science goal is to constrain the relation between Hi gas content and SFR enhancement, and check the consistency with the relation between gas content (estimated using the dust mass) and SFR enhancement obtained in the study (Cao et al., 2016). In section 2, 3 and 4, we describe the sample, GBT observations, and data reduction. Literature data are described in Section 5. Main results are presented in Section 6. Section 7 is devoted to discussions. Section 8 is the summary. Through out this paper, we adopt the -cosmology with and , and H (km s-1 Mpc-1).
2. THE H-KPAIR SAMPLE
The KPAIR is an unbiased and large sample of 170 close major-merger galaxy pairs selected in the K-band, from cross matches between the Two Micron All Sky Survey (2MASS) and the Sloan Digital Sky Survey (SDSS)-DR5 galaxies (Domingue et al., 2009). The parent sample includes 77,451 galaxies of Ks mag, with a sky coverage of 5800 deg2 and redshift completeness of 86%. The selection criteria are: (1) Ks magnitude of the primary is not fainter than 12.5; (2) at least one component has a measured redshift; (3) if both components have measured redshifts, the velocity difference is not larger than 1000 ; (4) the Ks difference between the two galaxies is not larger than 1 mag; (5) the projected separation is in the range of . When only one component has a measured redshift, the separation is calculated according to that redshift and the angular separation of the components. Visual inspections, complemented by results of an automatic algorithm, classified 62 pairs as S+S, 56 as S+E, and 52 as E+E.
The H-KPAIR sample (Cao et al., 2016) includes all S+S and S+E pairs in the original KPAIR sample that have (1) measured redshifts for both components, (2) relative velocity , and (3) pair recession velocity . It contains 88 pairs (44 S+S and 44 S+E). We did some of these comparison in Xu et al. (2010) and Cao et al. (2016). We will do a comprehensive comparison between S+S and S+E in a future paper.
3. OBSERVATIONS
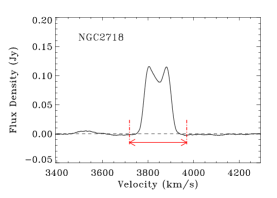
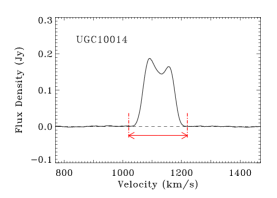
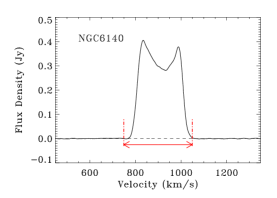
For 67 pairs, the 21 cm Hi fine-structure line observations were carried out using the National Radio Astronomy Observatory (NRAO)111The National Radio Astronomy Observatory is a facility of the National Science Foundation operated under cooperative agreement by Associated Universities, Inc. Robert C. Byrd Green Bank 110-m Telescope (GBT)222The Green Bank Observatory is a facility of the National Science Foundation operated under cooperative agreement by Associated Universities, Inc. Spectrometer in the L-band (1.15-1.73 GHz) between 2012 August and 2013 January. For each object, the data were collected in 2 hrs on-off source pairs with 12.5 MHz bandwidth. The two spectral windows were centered at the same frequency (1420.4058 MHz). Using 9-level sampling and two IFs, the observations provide 1.5 kHz (0.3 km s-1) spectral resolution for the dual polarization L-band system. The beam size is . GBT has a well-calibrated structure and a stable gain at the 21 cm wavelength. We observed 3C 286 as the primary flux calibrator to monitor the instrumental performance. This observation of a bright calibration source verified the stability of the telescope gain factor. As a test, we also observed 5 nearby normal galaxies: NGC895, NGC2718, NGC3027, UGC10014, and NGC6140. Comparisons with literature show a systematic difference of 15% between our measurements and data in the literature (see Appendix A), suggesting a minor deviation in the calibration. This shall not affect our main conclusions significantly.
4. DATA REDUCTION
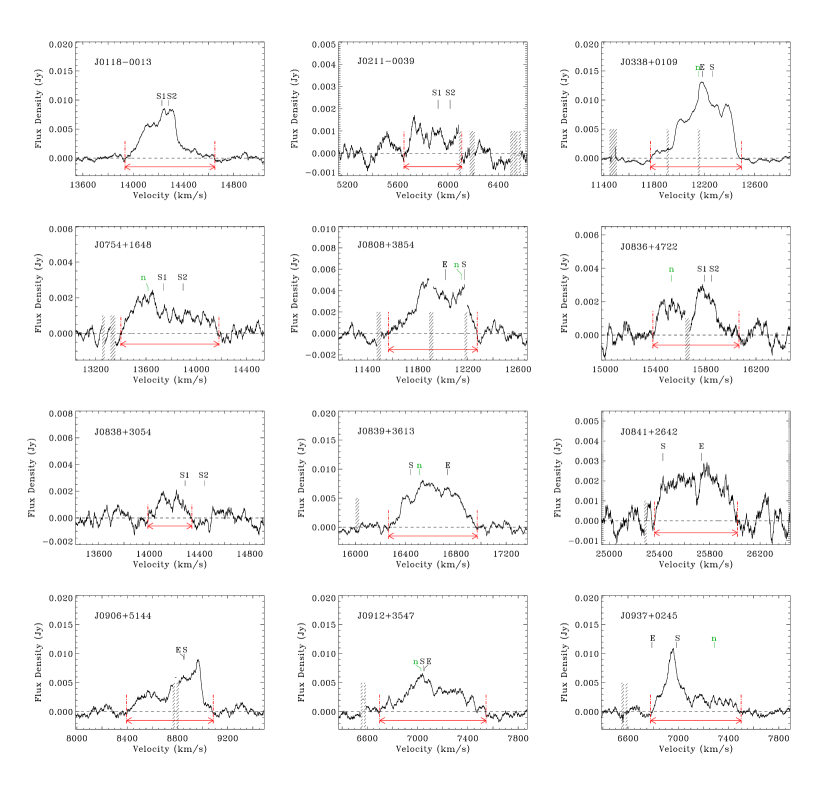
The Hi spectra were reduced using GBTIDL (Marganian et al., 2006). We used the Jy/K calibration to convert the Hi line fluxes to the units of Jy, applying an atmospheric opacity of 0.008 and aperture efficiency of 0.71. The scans and channels with Radio Frequency Interferences (RFIs) were flagged. For each polarization, the data were accumulated and averaged together. A polynomial of the order of 3 - 8 was used to fit the baseline over a range of channels for every pair. The Hanning-smoothed and then decimated spectra were used to subtract the baseline. The velocity resolution is 30 km s-1 per channel after boxcar smoothing. The two polarizations were then averaged together to produce the full intensity spectra shown in Figure 1.
Some observations were significantly affected by RFIs. For 9 pairs (J0913+4742, J0926+0447, J1010+5440, J1020+4831, J1137+4728, J1148+3547, J1205+0135, J1505+3427, J1628+4109), the RFIs are so severe that no informative signals could be extracted from the data. The pairs are excluded from our analysis. Forty-six targets are detected with the Hi 21 cm emission peak . Their Hi masses were calculated using the relationship of (Condon & Ransom, 2016), where is the luminosity distance in Mpc and is the velocity integrated Hi flux density in Jy km s-1. The Hi velocity range was visually decided, with the constraint that the center is within km s-1 from the system velocity (optical) of the target. The Hi masses of the 12 undetected pairs were calculated based on the 3 upper limits of the spectral line with assumed line-width of 800 km s-1. The error was estimated by the quadratic sum of the 10% systematic uncertainty (mostly due to the calibration and the baseline subtraction error) and the measured rms noise. We also measured the mean Hi velocity (weighted by signal) and the of the spectral line for detected pairs.
For the 46 detected pairs, we visually inspected their SDSS images and found that 22 have neighboring spiral galaxies with redshifts inside the bandwidth of the Hi observation and locations within 10′ from the pair center (Figure B1 in Appendix B). We performed our search down to the limit of 17.71 mag (band), 18.35 mag (band) and 17.78 mag (band). All spiral galaxies in the search radius and brighter than these limits had observed redshifts. As the beam of GBT is 9′, contamination due to blending could be significant for these sources, therefore a correction was carried out based on the algorithm developed by Zhang et al. (2009). Details about the contamination correction are presented in Appendix B. Most of the neighboring galaxies cause minor corrections. The average and the range of the factor by which was changed due to the correction are 1.26 and 1.03-1.84, respectively. Also, as a test for the algorithm, we found that for paired galaxies in our sample the ratio between estimated and observed Hi mass is consistent with being unity (0.80.2). The Hi mass after this correction was listed as in column (7) in Table 1.
5. LITERATURE DATA
The 21 pairs in H-KPAIR that we did not observe with GBT were covered by previous Hi emission line observations. However, detailed inspections showed that among them 9 pairs (J0915+4419, J1015+0657, J1150+1444, J1211+4039, J1219+1201, J1429+3534, J1506+0346, J1514+0403, J1608+2529) are in galaxy groups and the Hi observations were not pointed to the pairs but to neighboring galaxies in the same group, as shown in Figure B1. Therefore their Hi mass are too uncertain and they are excluded from our analysis. For each of the remaining 12 pairs, the Hi data collected from the literature are listed in Table 2. No neighboring spiral galaxies that can cause significant Hi contaminations were found for these pairs (Figure B1 in Appendix B).
| (1) | (2) | (3) | (4) | (5) | (6) | (7) | (8) | (9) | (10) | (11) | (12) |
|---|---|---|---|---|---|---|---|---|---|---|---|
| Pair ID | R.A. | decl. | 100 | SFR | Type | ||||||
| (H-KPAIR) | (J2000) | (J2000) | (km s-1) | (km s-1) | (109M⊙) | (109M⊙) | (km s-1) | (109M⊙) | (109M⊙) | (M⊙ yr-1) | |
| J0118-0013 | 01:18:34.9 | -00:13:50 | 14160 | 14235 | 22.64 2.29 | 389.38 | 26.51 | 140.17 | 61.83 | SS | |
| J0211-0039 | 02:11:07.4 | -00:39:17 | 5970 | 5874 | 0.45 0.06 | *301.24 | 4.54 | 76.05 | 2.95 | SS | |
| J0338+0109 | 03:38:12.6 | +01:09:55 | 12240 | 12194 | 29.76 2.98 | 21.72 | 491.08 | 13.49 | 50.12 | 5.02 | SE |
| J0754+1648 | 07:54:32.1 | +16:48:28 | 13812 | 13741 | 8.42 0.90 | 7.24 | *612.13 | 42.90 | 232.46 | 30.02 | SS |
| J0808+3854 | 08:08:34.7 | +38:54:52 | 12040 | 11964 | 12.21 1.26 | 11.21 | 519.60 | 2.29 | 51.29 | 1.35 | SE |
| J0836+4722 | 08:36:45.4 | +47:22:14 | 15768 | 15684 | 11.03 1.28 | 6.00 | 507.72 | ¡4.95 | 230.40 | 0.82 | SS |
| J0838+3054 | 08:38:17.8 | +30:54:57 | 14344 | 14167 | 2.52 0.54 | 294.54 | 4.26 | 162.11 | 4.21 | SS | |
| J0839+3613 | 08:39:00.5 | +36:13:10 | 16569 | 16619 | 46.29 4.70 | 44.05 | 551.70 | 13.49 | 81.28 | 1.91 | SE |
| J0841+2642 | 08:41:50.1 | +26:42:52 | 25600 | 25685 | 8.46 2.10 | 617.95 | 4.90 | 257.04 | 1.43 | SE | |
| J0906+5144 | 09:06:03.9 | +51:44:24 | 8737 | 8795 | 8.30 0.87 | 538.90 | 6.92 | 39.81 | 1.26 | SE | |
| J0912+3547 | 09:12:36.6 | +35:47:32 | 7056 | 7112 | 5.98 0.62 | 5.61 | 629.60 | ¡0.37 | 17.38 | ¡0.04 | SE |
| J0937+0245 | 09:37:44.6 | +02:45:14 | 6890 | 7056 | 5.23 0.55 | 5.01 | *275.36 | 23.44 | 144.54 | 9.83 | SE |
| J1022+3446 | 10:22:56.5 | +34:46:51 | 16761 | 16733 | 15.25 1.75 | 572.21 | 7.59 | 143.43 | 5.65 | SS | |
| J1023+4220 | 10:23:36.7 | +42:20:55 | 13659 | 13651 | 32.74 3.33 | 28.44 | *451.30 | 15.11 | 100.05 | 13.36 | SS |
| J1027+0114 | 10:27:29.6 | +01:15:02 | 6670 | 6718 | 6.01 0.62 | 5.63 | *139.39 | 2.75 | 26.30 | 1.91 | SE |
| J1032+5306 | 10:32:53.2 | +53:06:50 | 19186 | … | ¡3.06 | … | ¡2.85 | 104.71 | 1.03 | SE | |
| J1033+4404 | 10:33:30.7 | +44:04:27 | 15658 | 15791 | 24.21 2.62 | *432.10 | 34.32 | 216.94 | 18.53 | SS | |
| J1036+5447 | 10:36:43.4 | +54:47:42 | 13743 | … | ¡2.39 | … | ¡1.93 | 60.26 | ¡0.17 | SE | |
| J1039+3904 | 10:39:24.3 | +39:04:53 | 13017 | … | ¡1.32 | … | 1.93 | 52.48 | ¡0.17 | SE | |
| J1045+3910 | 10:45:24.9 | +39:10:09 | 7879 | … | ¡0.72 | … | 4.27 | 42.66 | 0.67 | SE | |
| J1051+5101 | 10:51:44.1 | +51:01:25 | 7325 | … | ¡0.57 | … | ¡0.45 | 63.09 | ¡0.16 | SE | |
| J1059+0857 | 10:59:58.9 | +08:57:28 | 18490 | … | ¡3.20 | … | ¡2.98 | 72.44 | ¡0.32 | SE | |
| J1101+5720 | 11:01:43.6 | +57:20:19 | 14208 | 14130 | 7.90 1.13 | 280.37 | ¡2.34 | 34.67 | ¡2.01 | SE | |
| J1106+4751 | 11:06:50.1 | +47:51:10 | 19464 | 19516 | 47.27 5.01 | 647.25 | 16.60 | 228.83 | 8.47 | SS | |
| J1120+0028 | 11:20:47.3 | +00:28:10 | 7295 | 7308 | 7.81 0.79 | 5.59 | 449.42 | 1.16 | 94.00 | 1.12 | SS |
| J1125+0226 | 11:25:17.1 | +02:26:54 | 14730 | 14713 | 20.91 2.23 | 613.87 | 10.94 | 145.81 | 1.13 | SS | |
| J1127+3604 | 11:27:33.8 | +36:04:01 | 10528 | 10397 | 14.87 1.51 | 11.97 | 555.50 | 21.55 | 224.07 | 5.76 | SS |
| J1144+3332 | 11:44:03.8 | +33:32:20 | 9489 | 9519 | 4.64 0.54 | 2.77 | 336.63 | 3.80 | 22.39 | 1.11 | SE |
| J1150+3746 | 11:50:13.7 | +37:46:20 | 16587 | 16491 | 39.70 4.03 | 923.50 | 13.72 | 158.31 | 4.10 | SS | |
| J1154+4932 | 11:54:23.0 | +49:32:48 | 21200 | … | ¡4.41 | … | 3.11 | 89.13 | ¡0.42 | SE | |
| J1202+5342 | 12:02:04.8 | +53:42:40 | 19290 | 19269 | 12.57 1.64 | *282.80 | 10.72 | 75.86 | 1.78 | SE | |
| J1243+4405 | 12:43:39.1 | +44:05:52 | 12412 | 12455 | 5.77 0.67 | *255.70 | 4.36 | 69.18 | 1.17 | SE | |
| J1252+4645 | 12:52:51.1 | +46:45:28 | 18346 | 18246 | 5.80 1.41 | *111.90 | 11.75 | 112.20 | 1.84 | SE | |
| J1301+4803 | 13:01:17.5 | +48:03:33 | 9018 | 8938 | 8.75 0.89 | 361.96 | 6.86 | 52.78 | 8.57 | SS | |
| J1313+3910 | 13:13:14.5 | +39:10:37 | 21475 | … | ¡4.70 | … | ¡3.01 | 83.18 | ¡0.68 | SE | |
| J1315+4424 | 13:15:15.6 | +44:24:26 | 10740 | 10634 | 5.58 0.63 | 352.93 | 10.16 | 163.35 | 10.63 | SS | |
| J1332-0301 | 13:32:55.9 | -03:01:37 | 14643 | 14145 | 14.15 1.89 | 10.18 | *165.80 | 12.81 | 122.97 | 11.45 | SS |
| J1346-0325 | 13:46:21.1 | -03:25:23 | 7030 | 6883 | 4.40 0.46 | 2.57 | *109.61 | 2.82 | 48.98 | 0.28 | SE |
| J1400-0254 | 14:00:37.3 | -02:54:27 | 7390 | 7491 | 8.12 0.87 | 669.25 | ¡1.09 | 75.29 | 0.08 | SS | |
| J1400+4251 | 14:00:58.3 | +42:51:01 | 9939 | 9739 | 7.37 0.79 | *418.83 | 17.48 | 91.10 | 17.99 | SS | |
| J1405+6542 | 14:05:52.1 | +65:42:43 | 9208 | 9224 | 5.45 0.60 | 3.31 | *304.06 | 6.31 | 19.95 | 0.73 | SE |
| J1407-0234 | 14:07:07.1 | -02:34:45 | 17020 | 16954 | 40.54 4.29 | 659.52 | 10.23 | 95.50 | 1.49 | SE | |
| J1424-0304 | 14:24:58.7 | -03:04:00 | 15400 | 15517 | 46.18 4.73 | 702.46 | 17.36 | 213.11 | 4.07 | SS | |
| J1433+4004 | 14:33:47.6 | +40:05:15 | 7871 | 7773 | 9.28 0.95 | 8.67 | *269.16 | 19.34 | 148.76 | 9.67 | SS |
| J1500+4317 | 15:00:24.4 | +43:17:04 | 9399 | 9046 | 14.65 1.50 | 14.03 | 661.15 | ¡0.90 | 53.70 | ¡0.10 | SE |
| J1510+5810 | 15:10:16.8 | +58:10:39 | 9303 | … | ¡0.81 | … | 4.79 | 81.74 | 2.04 | SS | |
| J1523+3748 | 15:23:38.3 | +37:48:44 | 7048 | … | ¡0.47 | … | 0.89 | 13.80 | 0.47 | SE | |
| J1526+5915 | 15:26:48.3 | +59:15:47 | 13525 | … | ¡1.96 | … | ¡1.16 | 58.88 | ¡0.14 | SE | |
| J1528+4255 | 15:28:14.7 | +42:56:13 | 5530 | 5473 | 8.54 0.86 | 7.21 | *490.79 | 8.42 | 141.32 | 3.07 | SS |
| J1552+4620 | 15:52:33.3 | +46:20:20 | 18060 | 17708 | 17.55 1.93 | 554.70 | 14.45 | 83.18 | 3.53 | SE | |
| J1556+4757 | 15:56:24.7 | +47:57:23 | 5850 | 5815 | 3.36 0.35 | 2.89 | 831.43 | 2.34 | 14.12 | 1.50 | SE |
| J1558+3227 | 15:58:37.7 | +32:27:42 | 14679 | 14432 | 7.03 0.85 | 342.53 | 10.89 | 113.93 | 4.81 | SS | |
| J1602+4111 | 16:02:43.7 | +41:11:54 | 10026 | 10024 | 28.16 2.84 | 27.45 | *490.18 | 18.62 | 94.76 | 13.50 | SS |
| J1614+3711 | 16:14:54.2 | +37:11:10 | 17450 | 17541 | 34.27 3.65 | 31.37 | 723.05 | ¡1.93 | 131.83 | 0.46 | SE |
| J1635+2630 | 16:35:43.3 | +26:30:49 | 21207 | 21191 | 60.97 6.30 | 53.61 | *342.6 | ¡3.33 | 169.82 | 0.90 | SE |
| J1637+4650 | 16:37:26.7 | +46:50:10 | 17915 | 17398 | 16.29 1.80 | *532.28 | 31.34 | 277.47 | 3.73 | SS | |
| J1702+1859 | 17:02:03.5 | +18:59:55 | 16965 | … | ¡2.61 | … | ¡1.71 | 46.77 | ¡0.31 | SE | |
| J1704+3448 | 17:04:50.9 | +34:48:57 | 17028 | 16990 | 15.43 1.71 | *348.13 | 23.80 | 152.68 | 32.12 | SS |
| (1) | (2) | (3) | (4) | (5) | (6) | (7) | (8) | (9) | (10) | (11) |
|---|---|---|---|---|---|---|---|---|---|---|
| Pair ID | R.A. | decl. | 100 | SFR | Type | ref. | beam size | |||
| (H-KPAIR) | (J2000) | (J2000) | (km s-1) | (109M⊙) | (109M⊙) | (109M⊙) | (M⊙ yr-1) | |||
| J0020+0049 | 00:20:27.4 | +00:49:59 | 5498 | 3.300.49 | 1.90 | 31.24 | 1.39 | SE | 1 | 3.3′ |
| J0823+2120 | 08:23:32.6 | +21:20:16 | 5400 | 12.121.17 | 3.96 | 33.79 | 3.98 | SS | 2 | 10.0′ |
| J0829+5531 | 08:29:15.0 | +55:31:21 | 7758 | 25.592.65 | 21.48 | 85.47 | 3.98 | SS | 1 | 10.0′ |
| J1043+0645 | 10:43:51.9 | +06:46:00 | 8238 | 6.700.27 | 12.34 | 59.98 | 5.01 | SS | 3 | 3.5′ 3.8′ |
| J1308+0422 | 13:08:28.3 | +04:22:01 | 7251 | 8.260.26 | 4.93 | 23.58 | 0.66 | SS | 3 | 3.5′ 3.8′ |
| J1315+6207 | 13:15:34.6 | +62:07:28 | 9100 | 5.000.83 | 12.77 | 103.90 | 62.89 | SS | 2 | 10.0′ |
| J1406+5043 | 14:06:21.7 | +50:43:29 | 1860 | 1.630.17 | 2.09 | 13.92 | 0.92 | SE | 1 | 10.0′ |
| J1423+3400 | 14:23:42.5 | +34:00:30 | 3865 | 1.030.10 | 2.90 | 25.92 | 1.23 | SS | 1 | 3.3′ |
| J1425+0313 | 14:25:05.5 | +03:13:59 | 10680 | 1.500.35 | 23.11 | SE | 4 | 3.5′ | ||
| J1444+1207 | 14:44:20.7 | +12:07:55 | 8895 | 5.930.64 | 12.84 | 186.60 | 4.64 | SS | 1 | 3.3′ |
| J1608+2328 | 16:08:22.5 | +23:28:46 | 12121 | 14.871.50 | 17.42 | 71.43 | 12.19 | SS | 1 | 3.3′ |
| J2047+0019 | 20:47:19.0 | +00:19:17 | 4204 | 22.443.45 | 15.14 | 123.10 | 1.84 | SE | 1 | 3.3′ |

6. RESULTS
Our final sample includes 70 pairs (34 S+S pairs, 36 S+E pairs) whose Hi mass can be found in Table 1 and Table 2. For S+S pairs, since the GBT beam cannot resolve them into individual galaxies, we treated each pair (including both components) as a single source. In these tables, we also listed as an estimate of total gas mass, stellar mass , and SFR, all taken from Cao et al. (2016). The corresponding , and SFR for each S+S pair are sums of the two components. In cases that one of the two ( or SFR) is undetected by Herschel, the true value for the pair should be limited between the detection and the sum of the detection plus the upper-limit of the undetected component. A test has shown that, for our statistical results (Table 3), the difference between calculations adopting either of these two limits is negligibly small (0.01-0.02 dex). We choose to take the detection as the value of the pair. For each S+E pair, we assumed that the Hi mass is associated only with S component and contribution from the E component is negligible. We tested this assumption using the gas mass derived from the dust mass (Cao et al., 2016). We calculated the mean and error of the ratio of (E)/(S) using the K-M estimator (Kaplan & Meier, 1958) which exploits the information in the upperlimits of (E). The result is 0.110.01. This indicates that E galaxies contribute only 10% of the gas mass of S+E pairs, which is indeed negligible. Other variables, including , and SFR, are also for the S component only.
In Table 3, means and errors of log[/()], log(/), and log(SFE) are presented for the total sample of pairs and for the following three sets of contrasting sub-samples: (1) S+S vs. S+E; (2) log(/) 10.7 vs. log(/) 10.7 (for an S+S pair, is the mean of the two components); (3) “JUS” vs. “INT & MER” pairs. According to Cao et al. (2016), “JUS” pairs are those without clear signs of interaction, “INT” and “MER” are pairs with signs of interaction and merging. In order to exploit information in the upper limits, the calculations were carried out using the maximum likelihood Kaplan-Meier (K-M) estimator (Kaplan & Meier, 1958). We derived the survival curves of these ratios through VOStat (VOStat Development Group, 2013). The means and errors of statistical calculations are based on the integrated areas of the curves. The log[/()] analysis is confined to sources (55) with detections, and the log[SFR/] analysis to sources (58) with detections.
In Figure 2 we compare (contamination corrected) with . There is a good correlation between the two values, both probing the cold gas content in these pairs. The linear correlation coefficient is 0.53. For the Spearman’s rank correlation, the coefficient is 0.61 and the significance is . The strong correlation suggests that a significant fraction of dust resides in Hi gas, or the ratio between and is relatively constant. For the total sample, the mean log[/()]. Cao et al. (2016) adopted as an estimate of the total gas mass . Taken at face value, our result indicates that the contribution of the Hi gas to the total gas mass is . Draine et al. (2007) found an average dust-to-gas mass ratio of 0.007 for nearby spiral galaxies, corresponding to / . Assuming this gas-to-dust mass ratio for our pairs, the contribution of the Hi gas to the total gas mass would be .
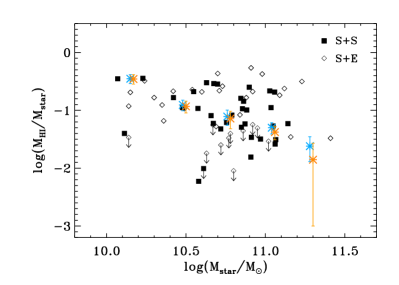
In Figure 3, we plot log(/) against log() for S+S and S+E pairs using different symbols. Since each S+S pair has two spirals while an S+E pair has only one, both and of the former are divided by 2. The mean log(/) () for the total pair sample corresponds to a Hi gas fraction of . More massive paired galaxies () have a slightly lower average (mean log(/), corresponding to ) compared with less massive paired galaxies of which have mean log(/) (corresponding to ). This is consistent with the results of Catinella et al. (2010) who showed that for a large sample of SFGs of , there is a significant trend for the Hi gas fraction to decrease with increasing , with an overall average of (Figure 3). We found no significant difference () between the means of log(/) of S+S and of S+E pairs (Table 3). This is different from Cao et al. (2016) who found, although with only marginal significance, that spirals in S+E pairs have on average lower total gas mass (estimated using the dust mass) to stellar mass ratio than those in S+S pairs.

In Figure 4, we present log(SFR) vs. log() plot for S+S and S+E pairs. Here again, and of S+S pairs are divided by 2. There is a sub-population of very active star-forming galaxies (with ) in S+S pairs. These galaxies are largely missing in S+E pairs.
In Figure 5, log(SFR) is plotted against Hi gas fraction /. It shows again that SFR of S+S pairs is systematically higher than that of S+E pairs. There is no clear dependence of SFR on Hi gas fraction.

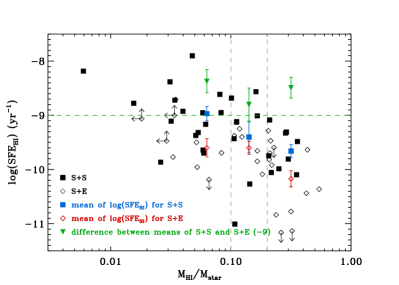
The ratio SFR/ measures the star formation rate per unit Hi gas mass, which will be referred as SFE hereafter. In Figure 6, log(SFE) is plotted against the Hi gas fraction /. It appears that for a given /, the SFE of S+E pairs is systematically lower than that of S+S pairs, and the difference is not sensitive to the Hi fraction. As listed in Table 3, the mean SFE of S+S pairs () is higher than that of S+E pairs (). There is a small but insiginificant difference between the mean SFE of pairs with signs of merger/interaction () and that of pairs without (). The mean SFE of the whole pair sample is , corresponding to a Hi consumption time of Gyrs.
| (1) | (2) | (3) | (4) | (5) | (6) | (7) | (8) | (9) | (10) |
| Samples | log[/(100)] | Error | Count | log(/) | Error | Count | log(SFR/) | Error | Count |
| S+S | -0.09 | 0.07 | 32 | -1.09 | 0.08 | 34 | -9.26 | 0.11 | 33 |
| S+E | 0.002 | 0.08 | 23 | -1.01 | 0.07 | 36 | -9.92 | 0.11 | 25 |
| log 10.7 | -0.12 | 0.10 | 23 | -1.06 | 0.11 | 28 | -9.59 | 0.14 | 24 |
| log 10.7 | -0.02 | 0.06 | 32 | -1.13 | 0.07 | 42 | -9.53 | 0.12 | 34 |
| JUS | -0.05 | 0.09 | 28 | -1.10 | 0.10 | 34 | -9.60 | 0.09 | 29 |
| INT & MER | -0.07 | 0.07 | 27 | -1.11 | 0.07 | 36 | -9.45 | 0.14 | 29 |
| Total | -0.06 | 0.06 | 55 | -1.12 | 0.06 | 70 | -9.55 | 0.09 | 58 |
7. DISCUSSION
Given the large beam () of the GBT observations, the Hi detected for each pair includes both gas inside the discs and the stripped gas in tidal features and debris. Because of the exclusion of mergers with component separation less than 5 kpc and nearby pairs with recession velocity less than 2000 km s-1, the H-KPAIR sample preferentially selects massive ( ) early stage merger systems (before the final coalescence). Our observations show that these systems have similar Hi gas fractions compared to normal spiral galaxies (Figure 3). For gas-rich dwarf galaxy pairs , Stierwalt et al. (2015) reached similar results. On the other hand, spiral galaxies in compact groups are found to be Hi deficient (Verdes-Montenegro et al., 2001; Borthakur et al., 2015; Walker et al., 2016).
A major science goal of this study is to address the puzzling result of the significant difference between the sSFR enhancement of spirals in S+E pairs and in S+S pairs (Xu et al., 2010; Cao et al., 2016). Because all pairs were selected using the same criteria regardless of morphological type (Domingue et al., 2009; Cao et al., 2016), this difference cannot be due to any selection bias. One possibility is that the sSFR in a paired galaxy is influenced by the immediate surrounding environment. This hypothesis is in agreement with the correlation between sSFRs of the primaries and secondaries in major-merger S+S pairs (i.e., the “Holmberg effect” Kennicutt et al. 1987; Xu et al. 2010). On the other hand, Xu et al. (2010, 2012) did not find any significant difference between the local densities around S+E pairs and S+S pairs within projected radius of 2 Mpc. Therefore, the linear scale of the environment effect must be less than 2 Mpc. Xu et al. (2010, 2012) speculated that the IGM in the dark matter halo (DMH) shared by both galaxies of a pair may play a significant role here. For example, when a DMH has strong (weak) cold flows (Dekel et al., 2009; Kereš et al., 2009), galaxies inside it may have abundant (scarce) cold gas supply to fuel active star formation. A prediction of this hypothesis is that spiral galaxies in S+E pairs have systematically lower gas content than those in S+S pairs.
However, this is not supported by our result which shows no significant difference between the mean log(/) of S+S and that of S+E pairs. It appears that the higher sSFR and SFE of S+S pairs are mainly due to a sub-population of very active SFGs, which are missing in S+E pairs (Figure 4). It will be very interesting to find out how the high star formation enhancement in these pairs is triggered, and why it is not happening in S+E pairs.
Some insights can be gained from the examples studied by Hibbard et al. (2001) using high resolution VLA Hi maps for galaxies in the “merger sequence”. Three of the five systems in their sample are early stage mergers with active star formation. They all show very extended tidal features in the Hi gas distribution. However, most active star formation is confined to the central region where high density molecular gas and bright emission are found. Dynamical simulations of Olson & Kwan (1990) demonstrated that, in the central 2 of merging galaxies, interaction induced collisions between gas clouds may play very important roles in triggering enhanced star formation, and the effect is stronger in S+S systems than in S+E systems.
Scudder et al. (2015) carried out VLA observations (beam ) of the Hi 21 cm line emission for 34 galaxies in 17 nearby S+S pairs, and obtained 17 detections. Compared to a control sample of galaxies, they found marginal evidence (at 2 level) for a positive correlation between the Hi fraction and the SFR enhancement. On the other hand, Cao et al. (2016) did not see any significant correlation between SFR/ enhancement and gas fraction in H-KPAIR. Our results in Figure 5 (Figure 6) show also that the difference between SFR (SFE) of spirals in S+S and S+E pairs does not depend on Hi gas fraction.
8. SUMMARY
In this paper we present a study of the Hi gas content of a large K-band selected sample of galaxy pairs (H-KPAIRs). Among 88 pairs (44 S+S pairs, 44 S+E pairs), we observed 67 pairs using GBT for the 21 cm Hi fine-structure emission. Except for 9 pairs that have severe RFIs and thus no informative signals could be extracted from the data, we derived Hi mass from the spectral line. The results include detections (46 pairs) and upper limits (12 pairs). In addition, Hi mass of other 12 pairs are collected from the literature. Compared with the data of the same sample, the relations between and , and SFR, and and SFE and Hi fraction are studied. The means and errors of log[/)], log(/), and log(SFE) are derived and analyzed for the total sample and for three sets of contrasting sub-samples. The primary results are as follows.
-
1. Both linear and Spearman rank correlation analyses show a significant correlation between and . For the total sample, the mean log[/()], corresponding to a Hi-to-total gas ratio of if the gas-to-dust mass ratio is assumed as 100.
-
2. The mean Hi-to-stellar mass ratio of spirals in these pairs is , consistent with the average Hi gas fraction of spiral galaxies in general. There is no significant difference () between the means of log(/) of S+S and of S+E pairs (Table 3).
-
3. The mean SFE of S+S pairs () is higher than that of S+E pairs (), and the difference is not sensitive to the Hi fraction. A sub-population of very active star-forming galaxies in S+S pairs are largely missing in S+E pairs.
-
4. The difference between the mean SFE of pairs with signs of merger/interaction () and that of pairs without () is insignificant ().
-
5. The mean SFE of the whole pair sample is , corresponding to a Hi consumption time of Gyrs.
Appendix A Appendix A
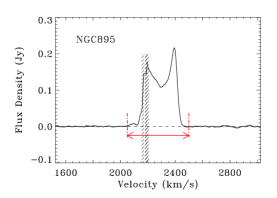
In Figure A1, we present the full intensity spectra of 5 nearby normal galaxies NGC895, NGC2718, NGC3027, UGC10014, and NGC6140. Hi observations and data reduction of these galaxies are the same as for the paired galaxies (Sections 3 & 4). The results are compared with literature data in Table A1. When there are more than one previous Hi observation for a given galaxy, its literature data is chosen according the following order of preference: (1) the latest GBT observation, (2) the latest NRAO 91m observation, (3) the latest Arecibo observation, (4) the latest observation by other telescopes. The comparison shows a systematic difference on a 15% level, possibly due to a minor deviation in the calibration. This shall not significantly affect our main conclusions.

| (1) | (2) | (3) | (4) | (5) | (6) | (7) | (8) | (9) | (10) | (11) |
| Galaxy ID | R.A. | decl. | dj | di | Dev. | ref. | ||||
| (J2000) | (J2000) | (km s-1) | (km s-1) | (′) | (′) | (Jy km s-1) | (Jy km s-1) | (%) | ||
| NGC895 | 02:21:36.5 | -05:31:17 | 2288 | 2294 | 3.6 | 2.6 | 33.39 | 40.39 | 18.98 | GBT100m(1) |
| NGC2718 | 08:58:50.5 | +06:17:35 | 3843 | 3842 | 1.74 | 0.91 | 13.07 | 15.67 | 18.09 | Arecibo(2) |
| NGC3027 | 09:55:40.6 | +72:12:13 | 1058 | 1057 | 4.3 | 2.0 | 71.72 | 85.5 | 17.53 | NRAO91m(3) |
| UGC10014 | 15:45:43.9 | +12:30:38 | 1121 | 1121 | 1.3 | 1.2 | 19.00 | 21.2 | 10.95 | GB91m(4) |
| NGC6140 | 16:20:58.1 | +65:23:26 | 910 | 906 | 6.3 | 4.6 | 70.93 | 84.6 | 17.58 | NRAO91m(3) |
Appendix B Appendix B
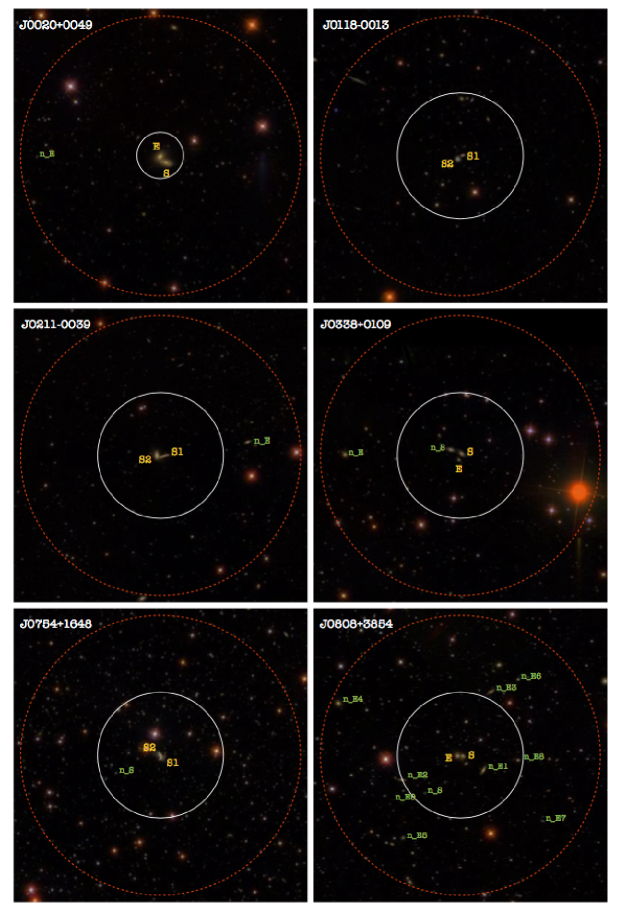
In this appendix, we present the algrorithm of the correction for contaminations due to neighboring galaxies, and the postage stamp images (taken from SDSS-DR14) used in the correction (Figure B1).
In order to correct for the contamination, we estimated the Hi mass of neighboring spiral galaxies using the following algorithm: First the Hi-gas-to-stellar-mass ratio is estimated by log (Zhang et al., 2009), where is the -band surface brightness and is the optical colour derived from the - and -band Petrosian magnitudes. The surface brightness used here is defined as , where is the apparent Petrosian -band magnitude and the radius (in units of arcsecond) enclosing 50 percent of the total Petrosian -band flux. Then the stellar mass was estimated from the -band luminosity and colour using the formula (Bell et al., 2003). The estimated Hi mass was then multiplied by the GBT beam response function at the distance of the galaxy, assuming the beam is a Gaussian with FWHM = 9′. Finally, for each pair, the contamination due to Hi mass of neighboring spiral galaxies so estimated was subtracted from its observed Hi mass.
In Figure B1, postage stamp images taken from SDSS-DR14 are presented for individual pairs. In each image, paired galaxies are marked with yellow letters and neighboring galaxies with redshifts inside the bandwidth of the Hi observation with green letters. For pairs with Hi detections, the white circle represents the beam and the red circle the searching circle (′). For pairs observed but undetected by GBT, only the beam circle is plotted. For pairs with bad data, neither circle is plotted. Besides, there are 9 pairs in galaxy groups and their Hi observations were not pointed to the pairs, which are excluded from our analysis.
References
- Alonso et al. (2004) Alonso, M. S., Tissera, P. B., Coldwell, G., & Lambas, D. G. 2004, MNRAS, 352, 1081
- Barton et al. (2000) Barton, E. J., Geller, M. J., & Kenyon, S. J. 2000, ApJ, 530, 660
- Bell et al. (2003) Bell, E. F., McIntosh, D. H., Katz, N., & Weinberg, M. D. 2003, ApJS, 149, 289
- Bergvall et al. (2003) Bergvall, N., Laurikainen, E., & Aalto, S. 2003, A&A, 405, 31
- Borthakur et al. (2015) Borthakur, S., Yun, M. S., Verdes-Montenegro, L., et al. 2015, ApJ, 812, 78
- Bushouse et al. (1988) Bushouse, H. A., Werner, M. W., & Lamb, S. A. 1988, ApJ, 335, 74
- Cao et al. (2016) Cao, C., Xu, C. K., Domingue, D., et al. 2016, ApJS, 222, 16
- Catinella et al. (2010) Catinella, B., Schiminovich, D., Kauffmann, G., et al. 2010, MNRAS, 403, 683
- Condon & Ransom (2016) Condon, J. J., & Ransom, S. M. 2016, Essential Radio Astronomy
- Courtois et al. (2009) Courtois, H. M., Tully, R. B., Fisher, J. R., et al. 2009, AJ, 138, 1938
- Dasyra et al. (2006) Dasyra, K. M., Tacconi, L. J., Davies, R. I., et al. 2006, ApJ, 638, 745
- Dekel et al. (2009) Dekel, A., Birnboim, Y., Engel, G., et al. 2009, Nature, 457, 451
- Domingue et al. (2016) Domingue, D. L., Cao, C., & Xu, C. K. e. a. 2016, ApJ, 829, 78
- Domingue et al. (2009) Domingue, D. L., Xu, C. K., Jarrett, T. H., & Cheng, Y. 2009, ApJ, 695, 1559
- Draine et al. (2007) Draine, B. T., Dale, D. A., Bendo, G., et al. 2007, ApJ, 663, 866
- Ellison et al. (2008) Ellison, S. L., Patton, D. R., Simard, L., & McConnachie, A. W. 2008, AJ, 135, 1877
- Ellison et al. (2010) Ellison, S. L., Patton, D. R., Simard, L., et al. 2010, MNRAS, 407, 1514
- Haynes & Herter (1988) Haynes, M. P., & Herter, T. 1988, AJ, 96, 504
- Haynes et al. (2011) Haynes, M. P., Giovanelli, R., Martin, A. M., et al. 2011, AJ, 142, 170
- Hibbard et al. (2001) Hibbard, J. E., van der Hulst, J. M., Barnes, J. E., & Rich, R. M. 2001, AJ, 122, 2969
- Huchtmeier & Richter (1989) Huchtmeier, W. K., & Richter, O.-G. 1989, A General Catalog of HI Observations of Galaxies. The Reference Catalog., 350
- Hummel (1981) Hummel, E. 1981, A&A, 96, 111
- Kaplan & Meier (1958) Kaplan, E. L., & Meier, P. 1958, Journal of the American Statistical Association, 53, 457
- Keel et al. (1985) Keel, W. C., Kennicutt, Jr., R. C., Hummel, E., & van der Hulst, J. M. 1985, AJ, 90, 708
- Kennicutt et al. (1987) Kennicutt, Jr., R. C., Roettiger, K. A., Keel, W. C., van der Hulst, J. M., & Hummel, E. 1987, AJ, 93, 1011
- Kereš et al. (2009) Kereš, D., Katz, N., Fardal, M., Davé, R., & Weinberg, D. H. 2009, MNRAS, 395, 160
- Lambas et al. (2003) Lambas, D. G., Tissera, P. B., Alonso, M. S., & Coldwell, G. 2003, MNRAS, 346, 1189
- Larson & Tinsley (1978) Larson, R. B., & Tinsley, B. M. 1978, ApJ, 219, 46
- Li et al. (2008) Li, C., Kauffmann, G., Heckman, T. M., Jing, Y. P., & White, S. D. M. 2008, MNRAS, 385, 1903
- Marganian et al. (2006) Marganian, P., Garwood, R. W., Braatz, J. A., Radziwill, N. M., & Maddalena, R. J. 2006, in Astronomical Society of the Pacific Conference Series, Vol. 351, Astronomical Data Analysis Software and Systems XV, ed. C. Gabriel, C. Arviset, D. Ponz, & S. Enrique, 512
- Nikolic et al. (2004) Nikolic, B., Cullen, H., & Alexander, P. 2004, MNRAS, 355, 874
- Olson & Kwan (1990) Olson, K. M., & Kwan, J. 1990, ApJ, 361, 426
- Patton et al. (2013) Patton, D. R., Torrey, P., Ellison, S. L., Mendel, J. T., & Scudder, J. M. 2013, MNRAS, 433, L59
- Sanders & Mirabel (1996) Sanders, D. B., & Mirabel, I. F. 1996, ARA&A, 34, 749
- Scudder et al. (2015) Scudder, J. M., Ellison, S. L., Momjian, E., et al. 2015, MNRAS, 449, 3719
- Scudder et al. (2012) Scudder, J. M., Ellison, S. L., Torrey, P., Patton, D. R., & Mendel, J. T. 2012, MNRAS, 426, 549
- Shostak (1978) Shostak, G. S. 1978, A&A, 68, 321
- Springob et al. (2005) Springob, C. M., Haynes, M. P., Giovanelli, R., & Kent, B. R. 2005, VizieR Online Data Catalog, 8077
- Stierwalt et al. (2015) Stierwalt, S., Besla, G., Patton, D., et al. 2015, ApJ, 805, 2
- Sulentic (1989) Sulentic, J. W. 1989, AJ, 98, 2066
- Telesco et al. (1988) Telesco, C. M., Wolstencroft, R. D., & Done, C. 1988, ApJ, 329, 174
- Tifft & Cocke (1988) Tifft, W. G., & Cocke, W. J. 1988, ApJS, 67, 1
- Verdes-Montenegro et al. (2001) Verdes-Montenegro, L., Yun, M. S., Williams, B. A., et al. 2001, A&A, 377, 812
- VOStat Development Group (2013) VOStat Development Group. 2013, VOStat: Statistical analysis of astronomical data, Astrophysics Source Code Library, ascl:1309.008
- Walker et al. (2016) Walker, L. M., Johnson, K. E., Gallagher, S. C., et al. 2016, AJ, 151, 30
- Xu & Sulentic (1991) Xu, C., & Sulentic, J. W. 1991, ApJ, 374, 407
- Xu et al. (2012) Xu, C. K., Zhao, Y., Scoville, N., et al. 2012, ApJ, 747, 85
- Xu et al. (2010) Xu, C. K., Domingue, D., Cheng, Y.-W., et al. 2010, ApJ, 713, 330
- Zhang et al. (2009) Zhang, W., Li, C., Kauffmann, G., et al. 2009, MNRAS, 397, 1243