A Wide and Deep Exploration of Radio Galaxies with Subaru HSC (WERGS).
I. the Optical Counterparts of FIRST Radio Sources
Abstract
We report the result of optical identifications of FIRST radio sources with the Hyper Suprime-Cam Subaru Strategic Program survey (HSC-SSP). The positional cross-match within 1″ between the FIRST and HSC-SSP catalogs () produced more than 3600 optical counterparts in the 156 deg2 of the HSC-SSP field. The matched counterparts account for more than 50% of the FIRST sources in the search field, which substantially exceed previously reported fractions of SDSS counterparts () of %. Among the matched sample, 9% are optically unresolved sources such as radio-loud quasars. The optically faint () radio galaxies (RGs) show that the fitting linear function of the 1.4 GHz source counts has a slope that is flatter than that of the bright RGs, while optically faint radio quasars show a slope steeper than that of bright radio quasars. The optically faint RGs show a flat slope in the -band number counts down to 24 mag, implying either less-massive or distant radio-active galactic nuclei (AGNs) beyond 24 mag. The photometric redshift and the comparison of colors with the galaxy models show that most of the matched RGs are distributed at redshifts from 0 to 1.5. The optically faint sample includes the high radio-loudness sources that are not seen in the optically bright sample. Such sources are located at redshift . This study gives radio AGNs lying at the optically faint end and high-redshift regime not probed by previous searches.
1 Introduction
Radio galaxies (RGs), as well as radio-loud active galactic nuclei (AGNs) themselves, will provide us with great opportunities for understanding galaxy formation and evolution. RGs prefer massive host galaxies (stellar mass of more than 10; Seymour et al. 2007). The powerful radio jets from RGs can drive AGN feedback to regulate star formation in massive host galaxies (McNamara et al., 2005; Fabian, 2012; Morganti et al., 2013). Thus, RGs are thought to be a key population in the formation of massive galaxies. Moreover, high- RGs () could be a valuable beacon to find protoclusters, because high- RGs tend to reside in overdensity regions (McCarthy, 1993; Miley & De Breuck, 2008). In this paper, RGs are defined as radio-loud galaxies with rest-frame 1.4 GHz radio luminosities of W Hz-1 (Tadhunter, 2016) and optically resolved morphologies, while radio-loud quasars are optically unresolved objects satisfying the same criterion as the radio luminosity. We refer to both RGs and radio-loud quasars as radio AGNs.
The bright radio radiation of RGs is advantageous for probing high- AGNs. Such radio sources should be found by wide-area surveys in radio wavelengths (NVSS, Condon et al. 1998; FIRST, Becker et al. 1995; Helfand et al. 2015; SUMSS, Bock et al. 1999; TGSS ADR, Intema et al. 2017), which follows the pioneering Cambridge Catalog series (e.g., Edge et al. 1959). It is greatly helpful to identify optical counterparts of the radio sources to investigate the properties of host galaxies and the optical emission of AGNs.
The Sloan Digital Sky Survey (SDSS; York et al. 2000) allowed identifications of the optical counterparts of radio sources, taking advantage of its large sky coverage. Ivezić et al. (2002) and subsequently Helfand et al. (2015) performed the positional cross-match between the SDSS and FIRST catalogs and identified SDSS counterparts only for % of the FIRST radio core sources. Even though radio sources with an extended complex radio morphology, which are a minority in all the FIRST sources (%; Ivezić et al. 2002), were taken into consideration, the matching fraction of the SDSS objects with FIRST sources did not improve (e.g., Ching et al. 2017). This means that more than half of all the FIRST sources do not have SDSS counterparts. This is likely due to the shallow optical sensitivities of SDSS imaging ( mag).
In fact, a deep optical survey in the VVDS 1 deg2 field showed that more than half of radio sources with a flux of mJy in 1.4 GHz, which is the same level as the FIRST sensitivity, match optically faint counterparts with mag (Ciliegi et al., 2005). In a 1.4 GHz VLA survey in the 1.3 deg2 SXDF, Simpson et al. (2006, 2012) found a few hundred optical counterparts of high- radio AGNs with mag up to . Recently, Smolčić et al. (2017a, b) performed a 3 GHz VLA deep imaging and reported more than a thousand radio AGNs with mag in the optical bands, up to in the 2.6 deg2 COSMOS field. Williams et al. (2018) performed an identification of radio sources in the deep 150 MHz LOFAR observation with -band-selected objects (), and they reported RGs up to in 9.2 deg2 of the Boötes field. The previous deep optical surveys in the radio survey regions have successfully identified high- radio AGNs, but the number of the radio AGNs, in particular for high radio luminosity sources, is limited to a few hundred due to their small survey areas of typically deg2. The Hyper Suprime-Cam (HSC) Subaru strategic program (SSP; Aihara et al. 2018a) reaches a limiting magnitude of 25.9 in the -band in a 1400 deg2 area, thus providing a key combination for identifying rare and faint objects such as radio AGNs.
This paper presents a new exploration for radio AGNs using a combination of the wide and deep optical catalog of the Subaru HSC-SSP and the wide-field radio catalog of FIRST. This exploration is carried out by an ongoing project, WERGS (a Wide and Deep Exploration of RGs with Subaru HSC). In this paper, we particularly focus on the optical and radio properties of RGs discovered in this project. We refer to radio loudness, , which is the measure of radio activity of AGNs. We use radio loudness as an observable value, which is defined as the ratio of the 1.4 GHz flux to the HSC band flux. Radio loudness is typically defined as a ratio of the 5 GHz flux to the -band flux derived from AGN emission, where AGNs and quasars with are considered to be radio-loud (Kellermann et al., 1989). Because the HSC band flux is assumed to be dominated by a host galaxy of an RG, the radio loudness in this study could be underestimated. This paper is organized as follows. We introduce the two catalog data sets in Section 2. The method and statistical results of a cross-match between the catalogs are presented in Section 3. The optical and radio properties of the entire HSC-FIRST radio AGN sample are shown in Section 4. The properties of optically faint RGs are discussed in Section 5. A summary is presented in Section 6. Throughout this paper, we use the AB magnitude system and a CDM cosmological model with , , and .
2 The Data
This search for radio AGNs is based on the positional cross-match between the HSC-SSP optical source catalog and the FIRST radio source catalog. In this section, the two source catalogs are described.
2.1 Subaru HSC Survey
The HSC-SSP is a multiband (five broadband filters, , , , , and , and four narrowband filters) imaging survey with HSC (Furusawa et al. 2018; Kawanomoto et al. 2018, in preparation; Komiyama et al. 2018; Miyazaki et al. 2018) installed on the Subaru 8.2 m telescope. Three complementary layers—the Wide, the Deep, and the UltraDeep—are included in the survey. These layers are different from each other in area and depth.
We utilized the broadband forced photometry catalogs of the early data products internally released as S16A (Aihara et al., 2018b), which were obtained by observations from 2014 March to 2016 January. The typical seeing is in the -band. The astrometric uncertainty is mas in RMS according to the comparison with the Pan-STARRS1 Surveys. The forced photometry of each band image is performed using a position and shape parameters determined in a reference band. The highest priority band of a reference band is the -band, followed in order by , , , and (see Bosch et al. 2018 for more details). We used the two extremes of the survey layers: the Wide layer originally covering 456 deg2 with a depth for point sources of , and the UltraDeep layer of 4 deg2 with a depth of (Aihara et al., 2018b). The saturation magnitudes for point sources are 18.4 and 18.7 in the -band for the Wide layer and the UltraDeep layer, respectively. Using the two extreme layers, we investigate the dependence of the rate of optical identification on the depth of optical imaging. We do not use the Deep layer because the imaging depth of the S16A Deep layer data is still as shallow as that of the S16A Wide layer due to an incomplete observation in the Deep layer. The Wide layer is composed of six distinct areas, and the UltraDeep layer has two areas, the UD-COSMOS and the UD-SXDS. Because the UD-SXDS area in the S16A data has a shallower depth (10–40%) than that of the UD-COSMOS, we use only the UD-COSMOS out of the UltraDeep layer. The detailed properties and the data process of the early data products are described in Aihara et al. (2018b) and Bosch et al. (2018).
We produced two clean HSC-SSP samples of the HSC-SSP Wide and UltraDeep layers, from the original HSC-SSP forced catalogs in order to exclude detector edges with low sensitivities and junk sources from the original catalogs. Here, we use cModel magnitudes from HSC-SSP photometry and corrected them for Galactic extinction (Schlegel et al., 1998). First, we masked the edges of each area. Around the edges, the number of visits at an object position is much smaller than that in the central regions. The coordinates of the consequent areas after masking the edges are shown in Table 2.1. Additionally, we removed coadded patches with poor modeling of the PSF due to extremely good seeings (see section 5.8.4 in Aihara et al. 2018b for details). A patch is the minimum unit of images for data processing. The removed patches have color offsets larger than 0.075 mag from the stellar sequence in the color-color planes of either and , and , or and (Akiyama et al., 2018; He et al., 2018). We also removed subregions in two patches in the XMM area, where some cModel photometries are significantly overestimated compared with aperture photometries.
Then, we imposed the following criteria:
(i) the number of visits at an object position (countinputs)
is greater than or equal to 3 (5) for the and (, , and ) bands
in the Wide layer to ensure an observing depth of more than a certain sensitivity,
and greater than or equal to 14, 26, and 42 for and , and , and , respectively, in the UD-COSMOS;
(ii) the central pixels of an object are not affected by nearby bright objects
(flags_pixel_bright_object_center=False; see Coupon et al. 2018 for details);
(iii) an object is not deblended further (deblend_nchild=0);
(iv) an object is a unique source (detect_is_primary=True);
(v) the central pixels of an object are not saturated
(flags_pixel_saturated_center = False)
and (vi) not affected by cosmic rays (flags_pixel_cr_center = False);
and (vii) an object is not at the edge of a CCD or a coadded patch
(flags_pixel_edge = False).
The following conditions were imposed only for the , , and bands:
(viii) there are no problems with measuring the cModel flux (cmodel_flux_flags = False)
and (ix) centroid positions (centroid_sdss_flags = False),
and (x) a signal-to-noise ratio (S/N) of an object is higher than 5 in all three bands.
As a result, 23,795,523 sources in a 154 deg2 area and
643,932 sources in a 1.78 deg2 area are selected as the clean HSC-SSP samples
of the Wide layer and the UD-COSMOS, respectively.
| Field | Coordinates††footnotemark: (deg) | |
|---|---|---|
| [(min), (max)] | [(min), (max)] | |
| GAMA15H | [210.80, 224.90] | [-1.40, 1.08] |
| VVDS | [331.20, 336.15] | [-0.45, 1.48] |
| GAMA09H | [129.05, 135.45] | [-0.20, 2.26] |
| [135.45, 139.15] | [-1.15, 2.89] | |
| [139.15, 140.40] | [-0.55, 2.89] | |
| [138.64, 140.40] | [ 2.89, 4.45] | |
| XMM | [29.80, 38.53] | [-6.05, -2.55] |
| HECTOMAP | [237.08, 247.64] | [42.40, 44.35] |
| WIDE12H | [176.53, 182.51] | [-1.40, 1.07] |
† The coordinates of each area are represented by and .
2.2 FIRST Radio Survey
The FIRST survey (the Faint Images of the Radio Sky at Twenty-cm; Becker et al. 1995) is a wide-field survey with the Very Large Array (VLA) at 1.4 GHz. The spatial resolution is 54, and the statistical astrometry error is 02 for bright and compact sources (White et al., 1997). The sky coverage is 10,575 deg2, which nearly covers the full SDSS sky area. The wide coverage and the high spatial resolution of FIRST are appropriate for finding a large number of optical counterparts of radio sources. The FIRST detection limit is 1 mJy in 5 sensitivity, although only in a region at the equatorial strip the limit is only 0.75 mJy. Radio sources detected with a radio flux of more than the FIRST detection limit at a redshift meet the definition of radio AGNs, where a radio AGN should have a 1.4 GHz luminosity of W Hz-1 (Tadhunter, 2016).
We use the final release catalog of FIRST (Helfand et al., 2015). To produce a uniform sample, we use only sources with a radio flux of more than 1 mJy. The FIRST catalog gives a probability that a source is a spurious detection near a bright source. We employed the probability and use only sources with . Consequently, the FIRST clean samples in the unmasked regions of the HSC-SSP Wide layer and UD-COSMOS layer have 7072 and 106 sources, respectively. See the Appendix for details about how to count FIRST sources in the unmasked HSC-SSP regions.
3 HSC-FIRST Radio Sources
3.1 Positional Matching
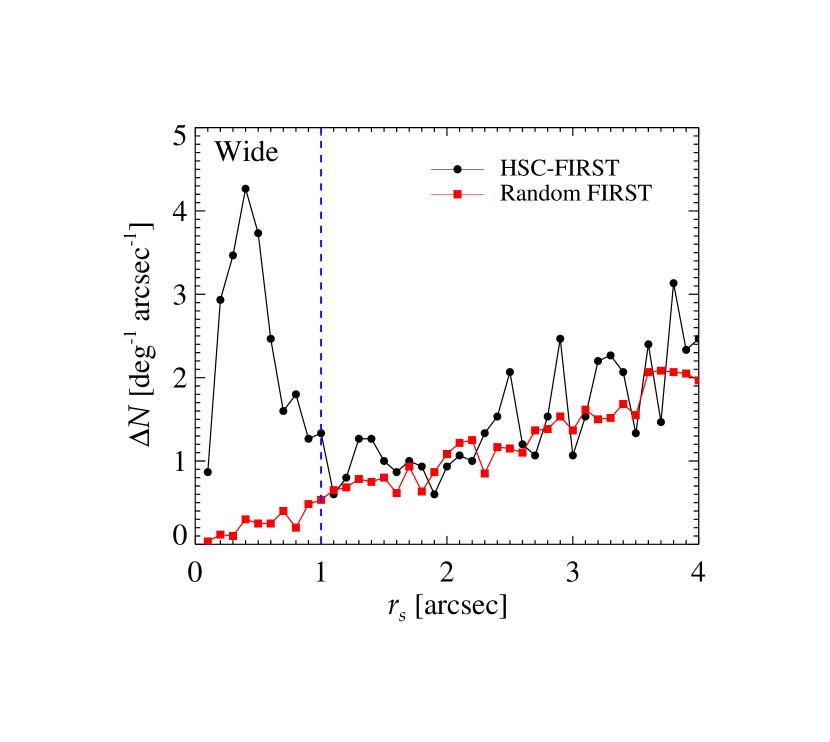
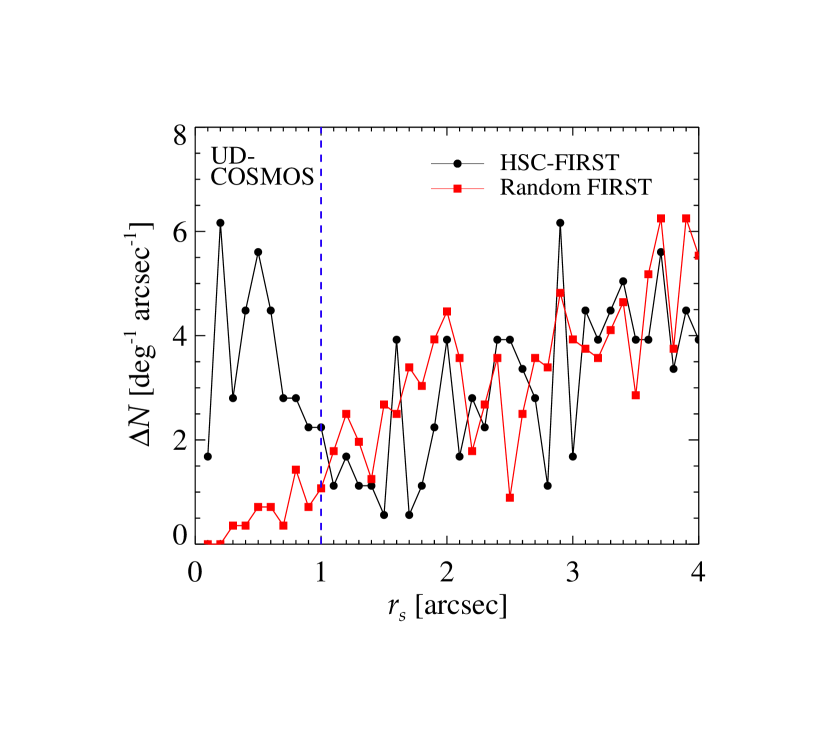
An HSC-SSP counterpart of a FIRST source is identified via nearest neighbor matching between the HSC-SSP -band and FIRST source positions. The search radius is set to be 10 for both cross-matching in the Wide and UD-COSMOS layers, because is an optimal condition according to an analysis of the completeness and contamination of the cross-match as discussed below. In Figure 1, the differential distributions of the separation between the HSC-SSP and FIRST sources are compared with those of chance coincidence matches. These examinations were performed in the central 15 deg2 region of the GAMA09H Wide layer and the central 0.7 deg2 region of the UD-COSMOS. The matches by chance coincidence are estimated from the average numbers of matches with the mock FIRST catalogs with random positions. Each of the mock catalogs was generated by shifting the FIRST source positions from the original positions to or along the R.A. direction for the Wide layer, to , , , or for the UD-COSMOS. The numbers of matches have peaks at in both of the Wide and the UD-COSMOS layers. Then, at , the matches gradually increase with increasing radius, approaching the number of random matches. Thus, the matched sources are dominated by chance coincidence at the radius of more than 10. It is worth mentioning that 31% of the FIRST sources with HSC counterparts within in the Wide layer have multiple HSC sources (one to five sources) within the FIRST beam (27 radius). Among these multiple HSC sources, except for those HSC sources closed to a FIRST position, 97% have separations larger than 10, and thus can be attributed to the chance coincidence.
We did not apply any particular algorithm intended for complex and extended radio sources to our cross-match. About only 10% of the FIRST sources have such complex and extended morphology (Ivezić et al., 2002; Ching et al., 2017). Therefore, our cross-matching method can miss radio AGNs without a radio core and can misidentify radio lobes whose position matches an HSC-SSP source by chance.
| HSC Layer | HSCaaThe number of sources within the same effective area specified in the last column. | FIRSTaaThe number of sources within the same effective area specified in the last column. | MatchaaThe number of sources within the same effective area specified in the last column. | Matching RatebbThe matching rate is defined by a ratio of the number of the matched sources to the number of the FIRST sources. | Area (deg2) |
|---|---|---|---|---|---|
| Wide | 23,795,523 | 7072 | 3579 | 0.506 | 154.09 |
| UD-COSMOS | 643,932 | 106 | 63 | 0.594 | 1.78 |
3.2 Contamination and Completeness
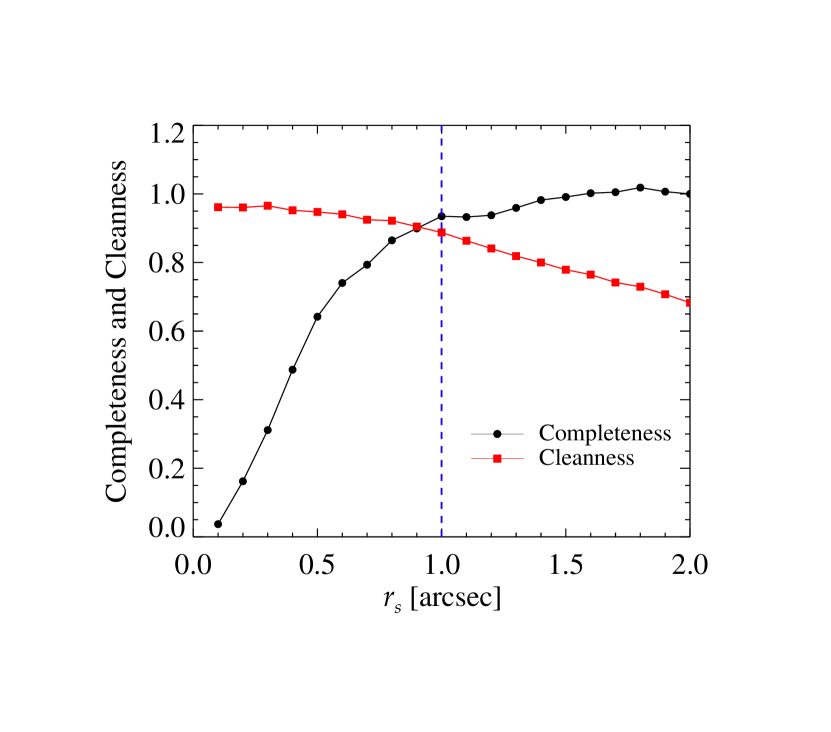
Adopting a single search radius in the positional cross-match allows us to estimate the contamination and completeness of the source identifications in the following way. A total number of matches at is represented by , where is an adopted search radius. The matches by chance coincidence at , , were estimated by the cross-match with the mock catalogs in the way mentioned in the previous section. The contamination is defined as the ratio of to . For convenience, we also defined a cleanness that is defined as ( contamination). A number obtained by subtracting from is represented by . We furthermore defined a number of matches, , which is a number obtained by subtracting matches by chance coincidence at from the total number of matches in this radius range. We set of 20, where the completeness is assumed to be 100%. Finally, the completeness is defined as a ratio of to a sum of and . In Figure 2, we show the cleanness and completeness as a function of for the Wide layer. The choice of the searching radius proved to be a reasonable trade-off between completeness and cleanness of the sample. Indeed, at the adopted searching radius of , the contamination by chance coincidence is estimated to be 14%, and the completeness is estimated to be 93% in the Wide layer. In the UD-COSMOS, while the completeness is not well determined due to the small number of matches, the contamination is 16%.
The results of the cross-matches are summarized in Table 2. The cross-matches produced 3579 and 63 matched sources in the Wide and the UD-COMOS layers, respectively. The matching rate, defined as the fraction of matched FIRST sources, is 51% in the Wide layer. The rate increases to 59% in the UD-COSMOS. Considering the above statistics, out of 3579 (63) matched HSC-FIRST sources in the Wide layer (UD-COSMOS), 3078 (53) are true optical counterparts of the FIRST sources, and 501 (10) FIRST sources are likely to be random matches. The estimated completeness implies that 3310 FIRST sources have HSC-SSP counterparts in the Wide layer, suggesting a completeness-corrected matching rate of 47%. These rates are higher than those of the previous studies using the SDSS (; Ivezić et al. 2002; Helfand et al. 2015). The high matching rates with the HSC-SSP data are further discussed and compared with other studies in Section 5.3.
The matched HSC-FIRST samples of both the Wide and UC-COSMOS layers include no known pulsars in the ATNF pulsar catalog compiling all of the published rotation-powered pulsars (Manchester et al., 2005).
3.3 Extended Radio Sources
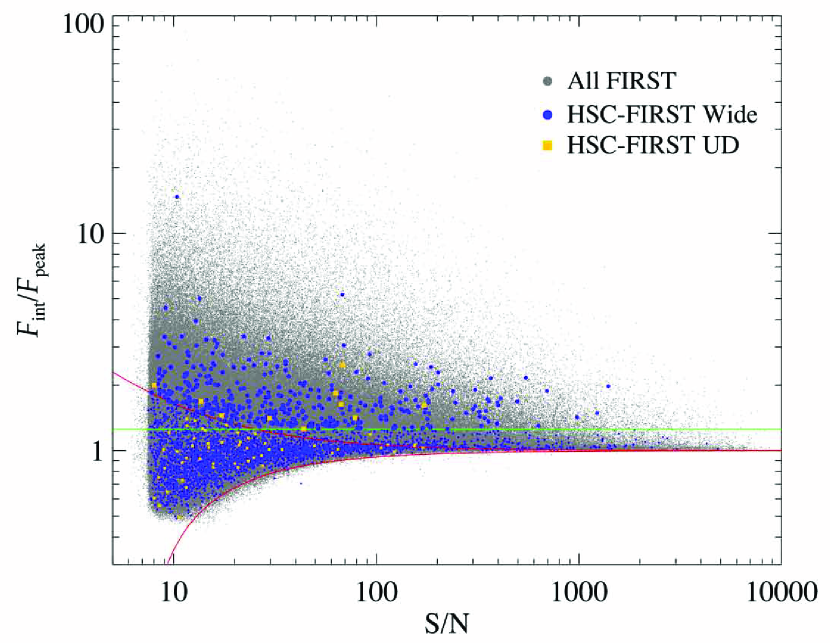
In order to evaluate a number of sources with extended radio morphology in the HSC-FIRST matched samples, we introduced a widely used size measure that is a ratio of the total integrated radio flux density to the peak radio flux density, or (e.g., Ivezić et al. 2002; Schinnerer et al. 2007; Bondi et al. 2008; Smolčić et al. 2017a). The ratio equals unity for a point source, while the ratio is larger than unity for an extended source or a resolved source. In Figure 3, we show the ratio as a function of the radio S/N. All the FIRST sources (gray dots), the HSC-FIRST sources in the Wide (blue dots), and the UD-COSMOS (yellow squares) are shown. The values of less than 1.0 are due to their low S/N.
We consider that sources simultaneously meeting the following two criteria should be extended radio sources. The first one is a threshold line described by
| (1) |
which was empirically determined for the FIRST-SDSS study by Ivezić et al. (2002), and sources above the line were classified as radio extended sources. This is, however, ineffective for the low-S/N sources. For a second criterion, we determined the lower envelope (the lower red curve) of the data points in Figure 3 following Schinnerer et al. (2007). The envelope contains 99% of all the FIRST sources below the line and was mirrored above . The mirrored upper curve (the upper red curve) is represented as
| (2) |
where is the S/N, and rms is a local rms noise in the FIRST catalog. Finally, we considered that the sources located above both the line of Equation 1 and the curve of Equation 2 should be radio extended sources in our samples.
Consequently, 10% (374 sources) of the HSC-FIRST Wide sample and 16% (10 sources) of the HSC-FIRST UD-COSMOS sample are selected to be the radio extended sources. These extended sources are likely radio lobes matched by chance, FR-I RGs (Fanaroff & Riley, 1974), RGs with core–jet/core–halo structures, or nearby star-forming galaxies. These fractions are thus upper limits of the numbers of chance coincidence of radio lobes, and the upper limits are compatible with the contaminations estimated in Section 3.1.
3.4 Optically Unresolved Sources
The optical morphologies on HSC images were examined to separate optically extended (resolved) sources and stellar-like unresolved objects using the procedure described in Akiyama et al. (2018) for distinguishing RGs and radio-loud quasars. We used a ratio of a second-order adaptive moment to that of a point spread function at a source position. Because -band images were taken under better conditions than the other bands, we use -band images in this examination. The criteria for selecting stellar objects are
| (3) | |||
| (4) |
The suffixes of 11 and 22 represent each perpendicular axis in an image.
We adopted the adaptive moments of the HsmMoments algorithm (Hirata & Seljak, 2003).
For 14 sources with failed HsmMoments measurements,
the alternative adaptive moments of the SdssShape algorithm (Lupton et al., 2001) were adopted.
According to Akiyama et al. (2018),
the completeness of classified stellar objects in this classification decreases
and the contamination from extended objects increases with increasing magnitude
due to the misclassifications.
At , the completeness is 80–90% and the contamination is less than 5%,
while at , the completeness decreases down to %
and the contamination is more than 40%.
Therefore, we consider that this classification of stellar objects
is reliable for sources brighter than mag.
According to the classification, we found 326 and 2 stellar objects from the HSC-FIRST Wide sample and the UD-COSMOS sample, respectively. These correspond to 9.1% and 3.2% of each sample, respectively. For brevity, we refer to such stellar objects as quasars and to optically resolved sources as RGs or galaxies, despite the recognition of exceptions to and uncertainties of the classification.
3.5 Astrometry
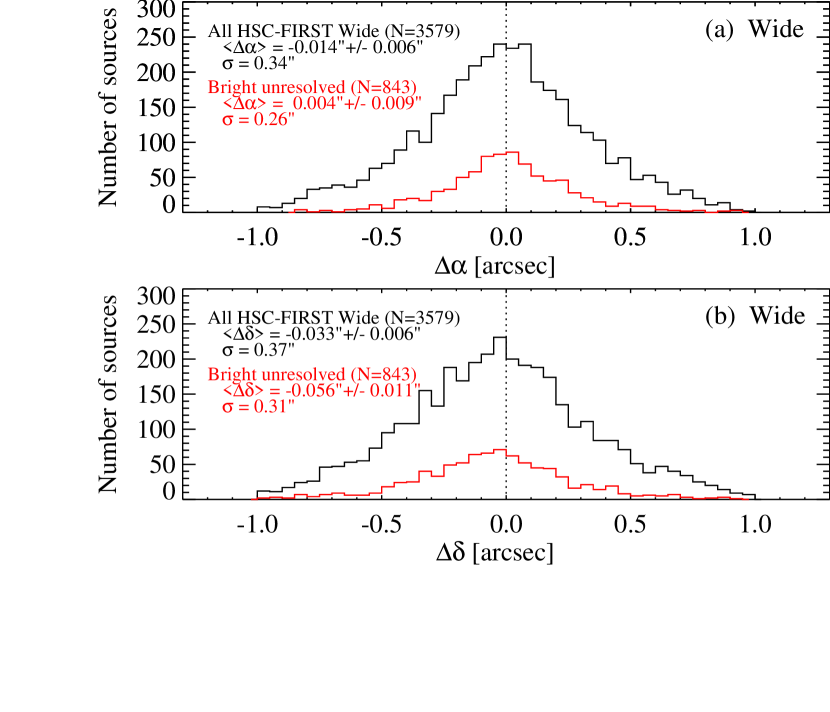

The large size of our sample provides us with an opportunity to inspect the astrometry between the HSC-SSP and FIRST sources. In Figure 4, we show the distributions of the residuals between the source positions of HSC-SSP and FIRST. The residuals along R.A. and decl. are a FIRST position minus an HSC-SSP position. We mention only results of the Wide layer because the UD-COSMOS sample is statistically too small to discuss the astrometry, but we just show the results of the UD-COSMOS sample.
The standard deviations of all the 3579 HSC-FIRST Wide sample are 034 in R.A. and 037 in decl. When we use only a bright and unresolved subsample whose sources are unresolved in radio morphology and have a radio peak flux of mJy and magnitude of , the standard deviations slightly moderate down to 026 in R.A. and 031 in decl. These uncertainties are still large compared with the positional uncertainty of the HSC-SSP catalog ( against Pan-STARRS1; Aihara et al. 2018b), and slightly larger than the uncertainty of the FIRST catalog ( for bright and compact sources; White et al. 1997). This is likely due to the galaxies composing almost the entire HSC-FIRST sample; we do not limit the sample for this inspection only to optically unresolved objects because of its quite small sample size.
We found a mean offset in R.A. of in all of the HSC-FIRST Wide sources. However, when we used only the the bright and unresolved subsample, this systematic offset becomes and statistically not significant. On the other hand, the mean offset in decl. is in the entire HSC-FIRST Wide sample. This offset is still significant and is , even if we use the bright and unresolved subsample. Therefore, there is a systematic offset in decl. of the HSC-SSP sources with respect to the FIRST position. Although this offset is significant, it is much smaller than the positional uncertainty of the FIRST catalog (), thus this offset has a negligible impact on the cross-match done in this work.
It may be valuable to compare the previous results of the FIRST sources with the SDSS counterparts studied by Helfand et al. (2015). They reported that there are systematic offsets of in R.A. and in decl. of the FIRST positions with respect to both the SDSS sources and the FIRST sources that have been taken with the Karl G. Jansky Very Large Array (JVLA), which is a major upgrade of VLA. Hence, taking this previous result into consideration, there might also be offsets between HSC-SSP and SDSS. From this simple comparison, we inferred systematic offsets of in R.A. and in decl. from SDSS to HSC-SSP.
4 Radio and Optical Properties of HSC RGs
In this section, radio and optical properties of the HSC-FIRST matched samples are described. In particular, we investigate differences between RGs and radio-loud quasars, which were classified in Section 3.4. Moreover, we focus on differences between two sub-samples: the optically-faint HSC-FIRST sources (HSC-level), for which an optical counterpart is detected with HSC-SSP but is not with SDSS, and the optically-bright HSC-FIRST sources (SDSS-level), for which an optical counterpart is detected both with HSC-SSP and SDSS.
4.1 Radio Source Counts
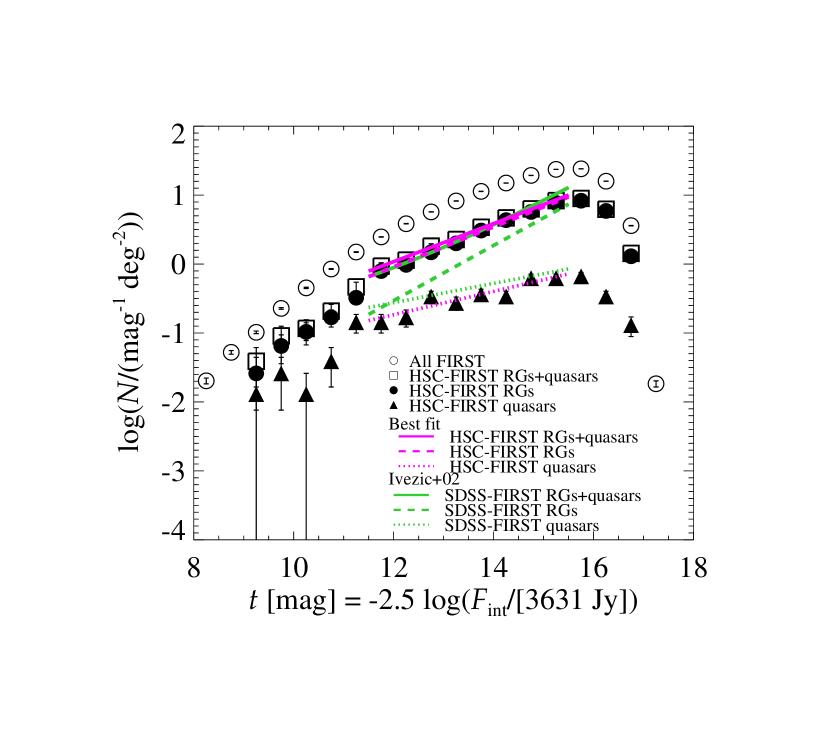
Radio properties of the Wide sample are investigated using 1.4 GHz radio source counts in Figure 5. Although radio source counts are often examined on a plane of radio flux and , we use another plane of radio AB magnitude and to directly compare with the results of Ivezić et al. (2002). Here, the radio AB magnitude is expressed as
| (5) |
A flux density of 1 mJy is equivalent to . In Figure 5, the source counts of the HSC-FIRST Wide sample, the Wide RG sample, and the Wide quasar sample are shown. Their distributions at a range of are fitted with a linear function by minimizing the chi-square statistic. The magnitude range for fitting is the same one as the analysis by Ivezić et al. (2002), whose results are also shown in Figure 5. The parameters of the best fits are summarized in Table 4.1.
The HSC-FIRST Wide sample (square) is roughly consistent with the FIRST sources whose SDSS counterparts are identified by Ivezić et al. (2002; the SDSS-FIRST sample, green solid line). This is trivial because the % improvement of the matching rate in this study corresponds to an increase of only dex in and a fact that FIRST sources without SDSS counterparts draw a similar slope to those with SDSS counterparts (Ivezić et al., 2002).
The HSC-FIRST quasars have a somewhat lower number than the SDSS-FIRST quasars, while the HSC-FIRST RGs increase in number, in particular, at the bright end. To investigate where this discrepancy stems from, we separate the HSC-FIRST Wide sample into an SDSS-level subsample with and an HSC-level subsample with . The magnitude threshold corresponds to the limiting magnitude of the SDSS survey, where the catalog is 95% complete for point sources (Stoughton et al., 2002). The 1.4 GHz radio source counts of the two subsamples and the fitting results are shown in Figure 6 and Table 4.1. The slope of the HSC-level RGs is flatter than that of the SDSS-level RGs, while the slope of the HSC-level quasars is steeper than that of the SDSS-level quasars. Therefore, the increased number of the HSC-FIRST RGs is likely due to the different dependences of the optically faint RGs and quasars from the optically bright sources on radio flux.
A fraction of quasars out of the SDSS-level subsample increases with increasing radio flux, from % at the faint end to % at the bright end. On the other hand, in the HSC-level subsample, the fraction does not strongly depend on radio flux. The fraction is approximately 5% over the radio flux range for fitting. The results in this subsection hold even if the HSC-level subsample is limited to sources with .
| All | RGs | (0.29) | 0.289 (0.020) |
|---|---|---|---|
| quasars | (0.78) | 0.169 (0.056) | |
| RGs+quasars | (0.27) | 0.276 (0.019) | |
| SDSS-level | RGs | (0.54) | 0.348 (0.038) |
| () | quasars | (0.94) | 0.102 (0.067) |
| RGs+quasars | (0.45) | 0.296 (0.032) | |
| HSC-level | RGs | (0.35) | 0.260 (0.024) |
| () | quasars | (1.79) | 0.305 (0.123) |
| RGs+quasars | (0.34) | 0.264 (0.024) | |
| Note— The best-fit parameters of the radio source counts in Figure 5 and 6. The fitting function is . The numbers in the parentheses represent uncertainties in the fitting results. | |||
4.2 Optical Number Counts
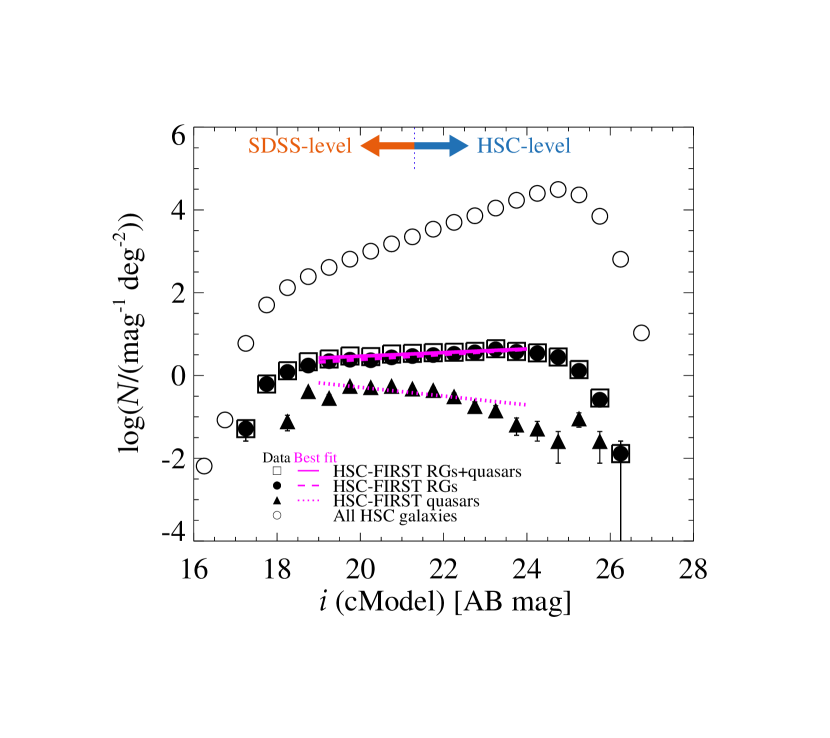
Thanks to the depth of the HSC-SSP data, this study enables us to investigate optical properties of radio AGNs down to more than 3 mag fainter in brightness than the previous SDSS studies. The -band number counts of the HSC-FIRST Wide sample are shown in Figure 7. A fall-off of the HSC-FIRST Wide sample at the bright end () is likely due to the saturation effect of the HSC-SSP data. A dearth of the HSC-FIRST Wide quasars at the bright end is likely due to not only the saturation but also the rareness of radio-loud quasars. The SDSS radio-loud quasars are actually identified even at (White et al., 2000; Ivezić et al., 2002). The -band number counts of the SDSS radio-loud quasars overlap with those of the HSC-FIRST quasars around 18 mag (see Figure 7 in Ivezić et al. 2002). On the other hand, at the faint end at , the number counts of the HSC-FIRST sources fall. The magnitude of this fall-off coincide with that of a fall-off for the HSC galaxy sample. Both fall-offs are considered to be due to the effect of the detection incompleteness of the HSC-SSP Wide data. It is presumed that the detection completeness is close to 100% down to brighter than mag because the -band sources were detected with an SN ratio of more than at mag. The number counts of the HSC-FIRST sources, which are not damped down to the detection completeness magnitude, implies a possibility that there are optically much fainter radio AGNs.
The number counts were fitted by a linear function within the range (magenta lines in Figure 7). The flat slope of the best fit for the HSC-FIRST RGs means that their number counts do not strongly depend on the apparent optical magnitude. The flat slope also indicates a decreasing fraction of the optically faint RGs relative to the HSC galaxies with increasing apparent magnitude: from 0.3% at to 0.01% at . The small fraction of the faint RGs might imply a small number of distant RGs and/or RGs with a less massive host galaxy. For the HSC-FIRST quasars, there is a turnover at mag. Thus, the linear function is not well fitted to the data. The fraction to the HSC-FIRST sources drops off from 11% to over the turnover magnitude. This turnover appears at mag, and therefore, the turnover is not due to the detection completeness of HSC-SSP. The FIRST detection limit, in part, may cause the turnover because the quasar sample misses optically faint radio-loud quasars with a lower radio flux than the FIRST detection limit. However, a similar turnover is not seen in the RG sample, although the effect of the FIRST detection limit should also impinge on the RG sample. This contrast means that the dependence of the number of quasars on optical magnitude is different from RGs in the optically faint regime. Jiang et al. (2007) found that the radio-loud fraction of quasars decreases with decreasing luminosity and increasing redshift although their quasar sample was basically brighter than . The turnover in our radio-loud quasar sample, therefore, may be partially attributed to a small number of low-luminosity radio-loud quasars and/or distant radio-loud quasars.
| RGs | (0.276) | 0.0617 (0.0127) |
|---|---|---|
| quasars | (0.99) | (0.047) |
| RGs+quasars | (0.261) | 0.0436 (0.0120) |
| Note— The best-fit parameters of the -band number counts in Figure 7. The fitting function is . The numbers in the parentheses represent uncertainties in the fitting results. a The statistical significance of the fitting result for the quasars is apparently low. | ||
4.3 Radio Loudness
Radio loudness at the observed frame, , is calculated to examine the radio activities of the HSC-FIRST RGs and quasars. According to Ivezić et al. (2002), is defined as a ratio of the 1.4 GHz flux and -band flux at the observed frames without -corrections. The -corrected radio loudness is discussed later (Section 5.1.3). The logarithmic is described as
| (6) |
As mentioned in the introduction, the radio loudness could be underestimated for RGs, because the stellar light of a host galaxy is assumed to be dominant in the -band flux.
The of the HSC-FIRST Wide and UD-COSMOS samples are shown in Figure 8. The HSC-FIRST samples obviously include higher sources than the SDSS-level ones owing to the deep optical observations of HSC-SSP as we have expected. In particular, radio AGNs with more than substantially increase in number. We note the could be actually higher due to the underestimate by the contamination from host galaxies. Moreover, the of the HSC-level sample is biased toward high values due to FIRST’s detection limit as illustrated by the green line in Figure 8. At the -band magnitude range of the SDSS level, the quasars abound in the high regime, whereas the RGs with high are at the HSC-level range. The UD-COSMOS sample, as expected, includes optically fainter radio AGNs () than the Wide sample. However, despite the deeper depth of UD-COSMOS, the highest radio AGNs are identified in the Wide layer. This means that wide optical surveys have an advantage over deeper but narrower surveys in finding rare AGNs such as the radio-loudest AGNs.
5 Discussion
5.1 Properties of HSC RGs as a Function of Photometric Redshift
We have successfully identified a large number of the optically faint optical counterparts of FIRST radio sources thanks to the wide and deep HSC-SSP survey. We reported in the previous section that these optically faint FIRST sources show apparently high radio loudness. In this section, we further investigate the optical and radio properties of the optically faint FIRST sources in order to understand their nature. We use the photometric redshift (photo- or ) of the sample but quasars have large uncertainties in photo-; therefore we address only RGs other than quasars.
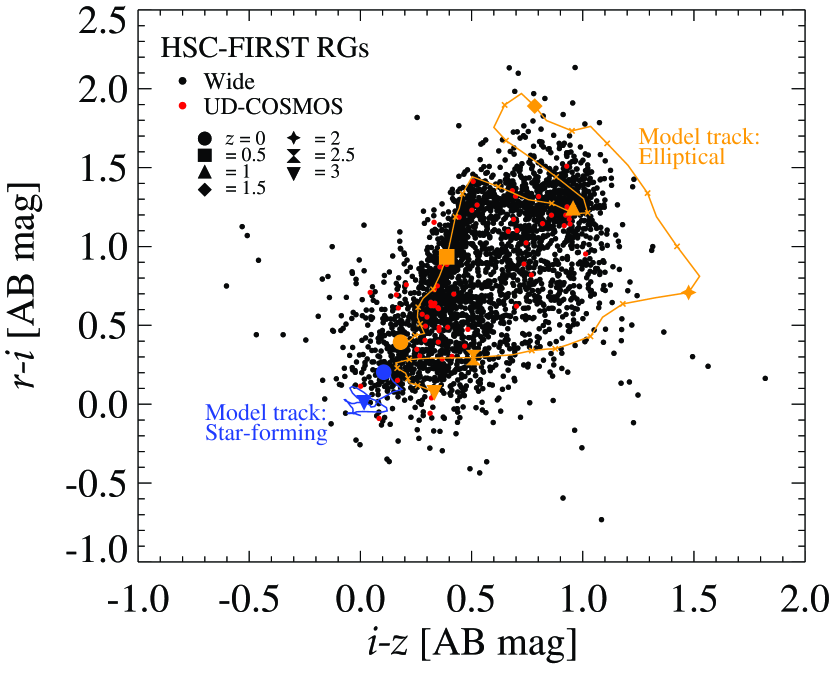
5.1.1 Color–Color
The redshifts of the HSC-FIRST RG samples in both the Wide and UD-COSMOS layers are examined in a color-color plane as the first step. Our RG samples are shown in the and color-color diagram of Figure 9. As the selection criteria have been imposed on the HSC-FIRST sample to detect in these three bands of , , and , the three bands’ photometries are available for all of the HSC-FIRST sources. The colors were compared with two color tracks of two model galaxies (Bruzual & Charlot, 2003) in order to estimate their redshifts. One is a passive elliptical galaxy that has star formation history with an exponential decay time of 1 Gyr, a galaxy age of 8 Gyr, and the solar metallicity. The other is a star-forming galaxy that has an instantaneous burst, a galaxy age of 0.025 Gyr, and the solar metallicity. From Figure 9, we found that most of the sources are located along the track of the model elliptical galaxy from to .
5.1.2 Photometric Redshifts
Photo- which were estimated
using the Mizuki SED-fitting code and
the photometries of the five HSC-SSP bands (see Tanaka 2015; Tanaka et al. 2018 for details)
are available for our HSC-FIRST RG sample.
A total of 2714 RGs in the Wide layer and 49 RGs in the UD-COSMOS layer have
reliable photo-, where ,
error in () is less than 1,
and a reduced is less than 5.
The photo- sample does not have a systematic bias against the optical magnitudes of sources at .
On the other hand,
of the faint HSC-FIRST RGs with are not included in the photo- sample
due to the low reliability of their photo-.
This bias results in a lack of 36% among RGs with .
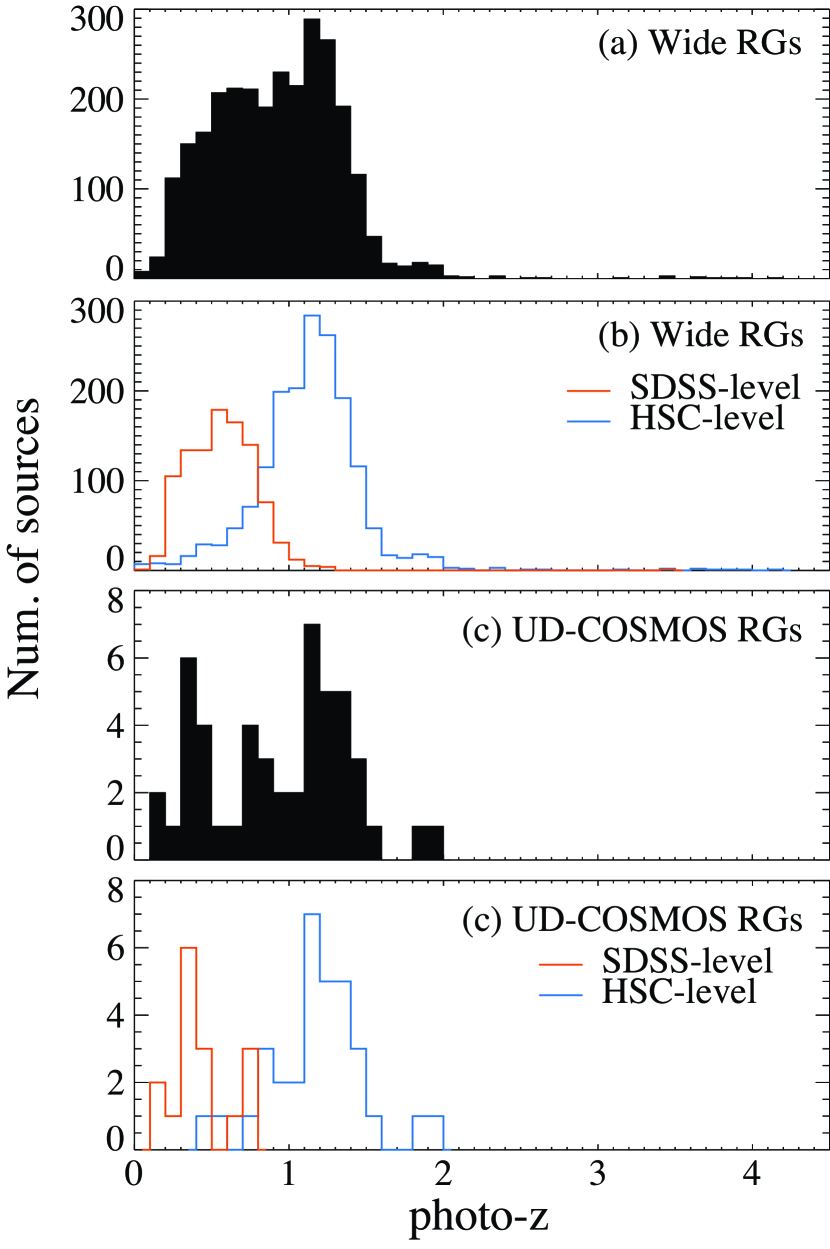
The redshifts of the photo- sample are shown in Figure 10
and range from to in both the Wide and UD-COSMOS layers.
The apparent bimodal distribution with two peaks at and 1.2 could be
attributed to both a spiky photo- distribution of the parent HSC sample (see Figure 11 in Tanaka et al. 2018)
and a rapid decrease of the photo- objects toward
where the five HSC bands can no longer straddle a redshifted 4000 Å break.
The interval of the spiky photo- distribution is roughly 0.1 and is smaller than
the average uncertainties (0.2) in the photo- of the photo- sample.
The photo- distributions of the SDSS-level and HSC-level RGs are clearly divided into
low and high redshifts, respectively.
This result means that the optically faint RGs or the HSC-level RGs ( sources)
exist at high redshifts ()
rather than at the local universe as intrinsically optically faint objects.
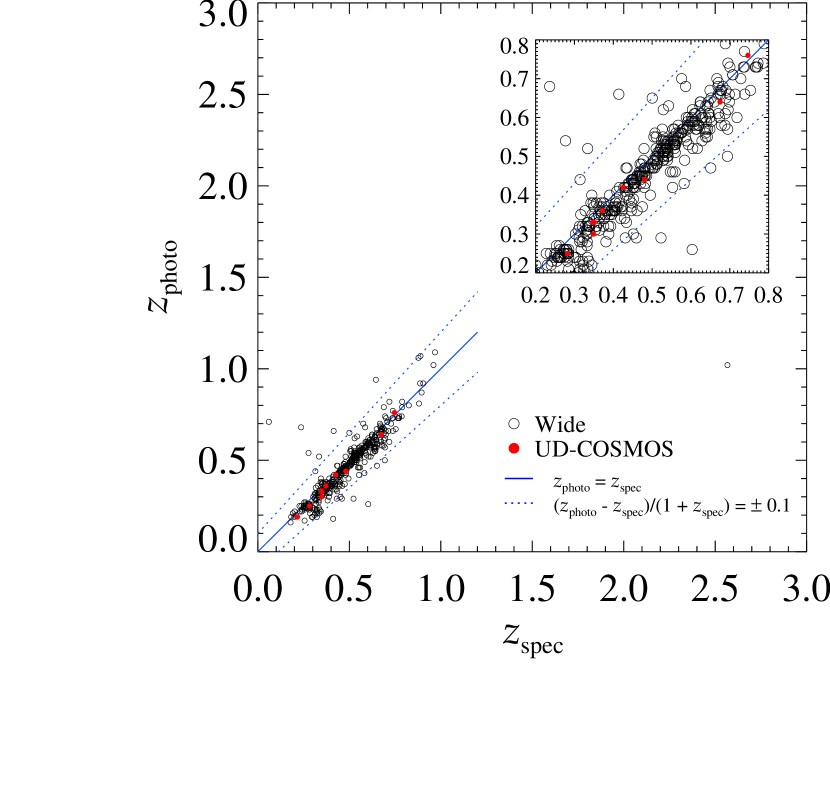
In order to inspect the photo- for the validity, the photo- were compared with spectroscopically measured redshifts (spec- or ) when available. We used public spec- catalogs from SDSS DR12 (Alam et al., 2015), GAMA DR2 (Liske et al., 2015), VIPERS PDR1 (Garilli et al., 2014), VVDS (Le Fèvre et al., 2013), WiggleZ DR1 (Drinkwater et al., 2010), PRIMUS DR1 (Coil et al., 2011; Cool et al., 2013), and zCOSMOS DR3 (Lilly et al., 2009). We cross-matched the public spec- sources to the HSC-FIRST photo- sources in positions by a search radius. Of the HSC-FIRST photo- sample, 404 RGs in the Wide layer and 11 RGs in the UD-COSMOS have secure spec- where , an error in is greater than 0, and a secure homogenized quality flag of determinations (see Tanaka et al. 2018 for details). The optical magnitudes of the spec- sample are limited to be due to the magnitude limit of the spectroscopic observations. In Figure 11, the photo- and the spec- are compared each other. The means and standard deviations of the relative differences between both are for the Wide sources and for the UD-COSMOS sources. In the overall trend, the photo- is in good agreement with spec- for the sources.
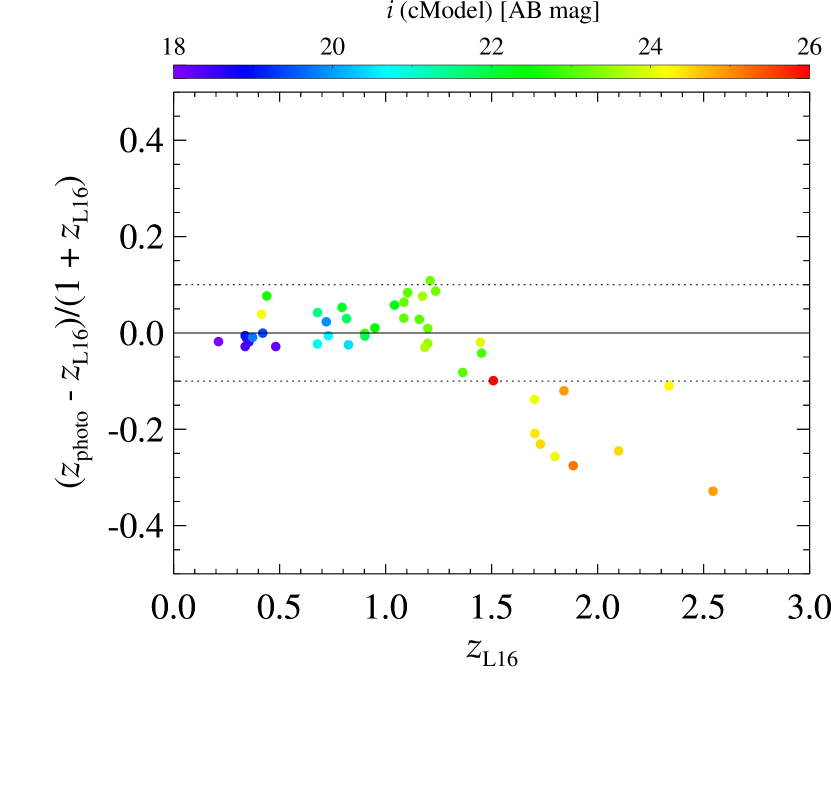
In order to examine the photo- of the faint sources with , we utilized the photo- () of the COSMOS2015 catalog in the COSMOS field, which were estimated using thirty multiband photometric data from the ultraviolet to mid-infrared (Laigle et al., 2016). The UD-COSMOS photo- RG subsample includes 44 counterparts of the COSMOS2015 sources with the minimum reduced of the SED fitting being less than 5. In Figure 12, the relative differences between and for 44 matched RGs are shown as a function of . Both the photo- are consistent with each other within 10% up to . The standard deviation of the relative difference is 0.047 in . At , where the sources are fainter than , the relative difference is systematically negative and is at the most. This deviation at is attributed to a redshifted 4000 Å break beyond the -band, and therefore, the photo- of these sources cannot be accurately constrained only from the photometries of the five HSC-SSP bands. These examinations show that the HSC-SSP photo- could be secure, at least, at , although the photometric sensitivities of the UD-COSMOS layer are deeper than those the Wide layer.
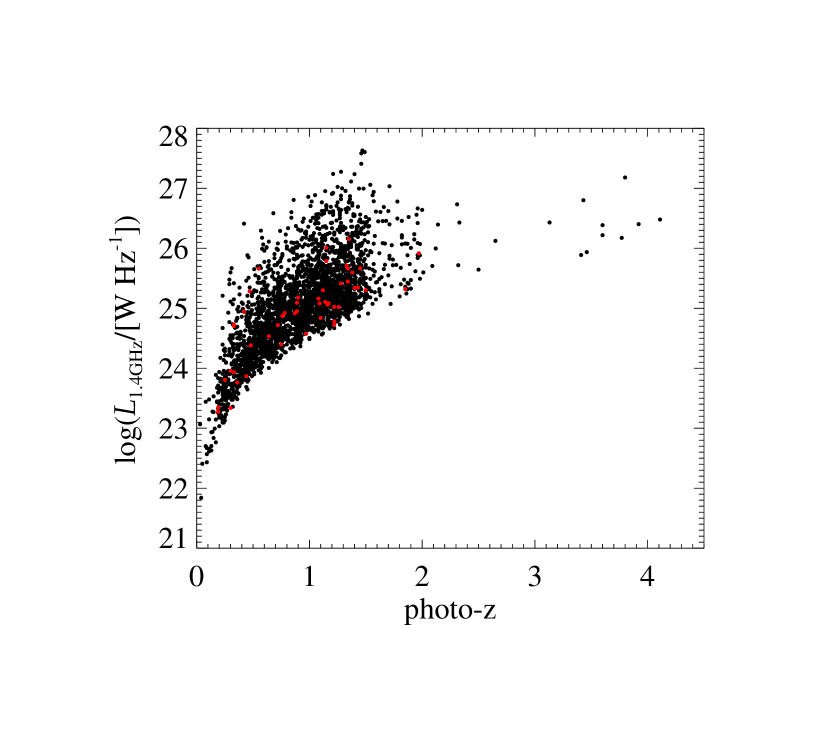
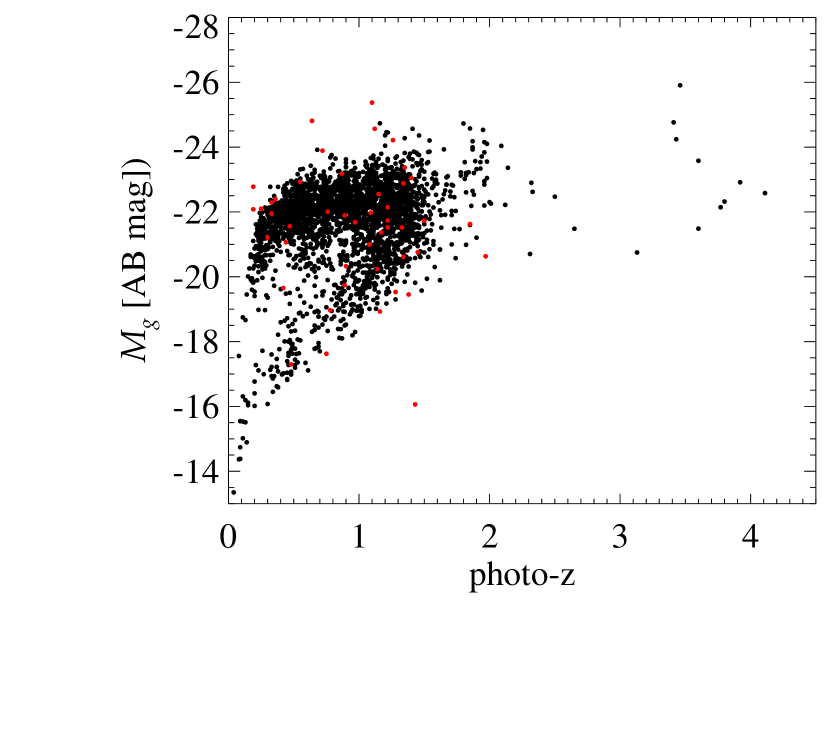
5.1.3 Optical and Radio Properties
The optical luminosity and radio luminosity at the rest frame
were calculated using the photo- for the photo- subsample.
In Figure 13, the calculated luminosities are shown as a function of photo-.
The 1.4 GHz radio luminosity was
-corrected by assuming a power-law radio spectrum of the form with
index (e.g., Condon 1992).
The sources at have high 1.4 GHz luminosities compared with lower redshift sources
due to a bias from the FIRST sensitivity.
The rest-frame -band absolute magnitude was estimated by the SED template fitting Mizuki
(Tanaka, 2015; Tanaka et al., 2018).
There may be two sequences of the magnitude along the redshifts.
The bright sequence with does not strongly depend on the redshift.
On the other hand, the number of sources belonging in the faint sequence seems to dramatically increase with increasing redshifts.
The sources with faint absolute magnitudes are also faint in apparent magnitudes (),
and the optical SEDs of the HSC-SSP bands show that some sources on the faint sequence have
a flat SED without distinct features.
Thus, the redshifts of these sources are probably estimated incorrectly.
In fact, the comparison of and redshifts with the COSMOS2015 catalog (Laigle et al., 2016)
in UD-COSMOS shows the underestimated redshifts of the faint sequence sources,
and the redshifts of the COSMOS2015 indicate that most sources in the faint sequence
should be at .
In this comparison, a source at on the faint sequence was found
to have redshift and consistent with the COSMOS2015 catalog.
This source is really a local source with a faint optical luminosity.
The faint sequence could be an apparent one due to
both the effects of the underestimated redshifts and
the Malmquist bias of the HSC-SSP sensitivity limits.
Some sources at may be local galaxies with strong radio radiation
from active star formation.
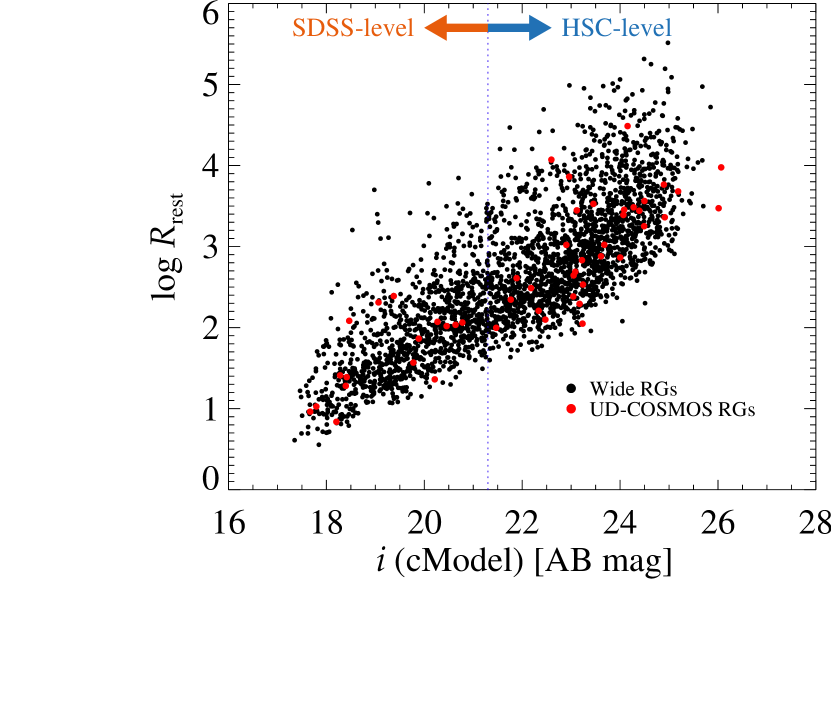
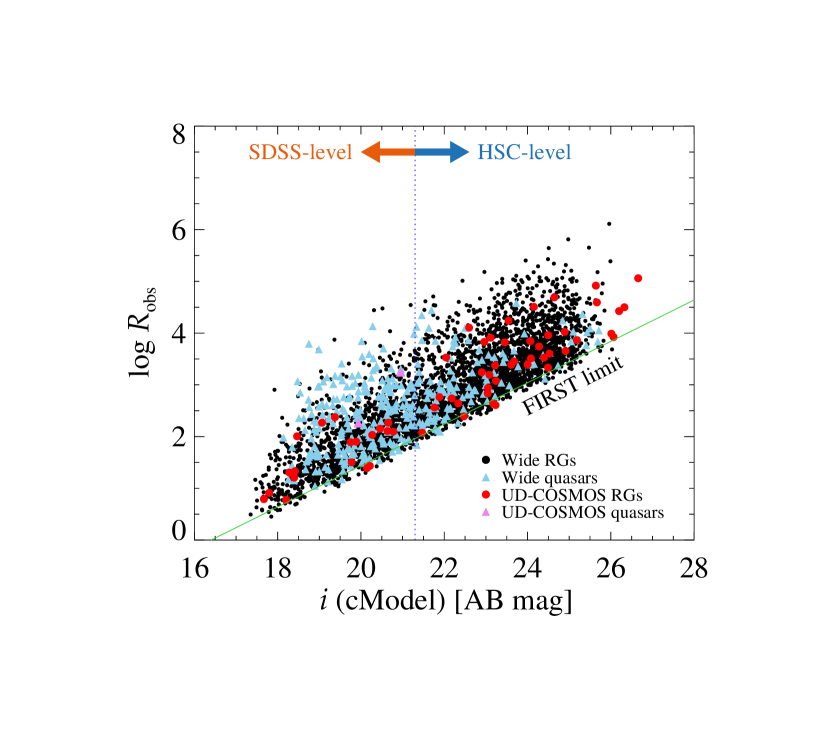
Radio loudness at the rest frame was estimated and is defined here as a ratio of the rest-frame 1.4 GHz flux to the rest-frame -band flux. The wavelength of the rest-frame -band flux is close to the rest-frame -band, which is typically used for calculating the radio loudness. The rest-frame radio loudnesses of the SDSS- and HSC-level sources as a function of the apparent -band magnitude are shown in Figure 14. We found that the RGs with high radio loudness () are found in the HSC-level subsample. Certainly, there are likely also low radio-loudness RGs in the HSC-level regime, but such sources are not included due to the sensitivity limit of the FIRST survey. Note that the radio loudness we use here is underestimated, because HSC band flux could be dominated by stellar light from host galaxies of RGs, and the rest-frame -band flux is derived from the SED templates of galaxies.
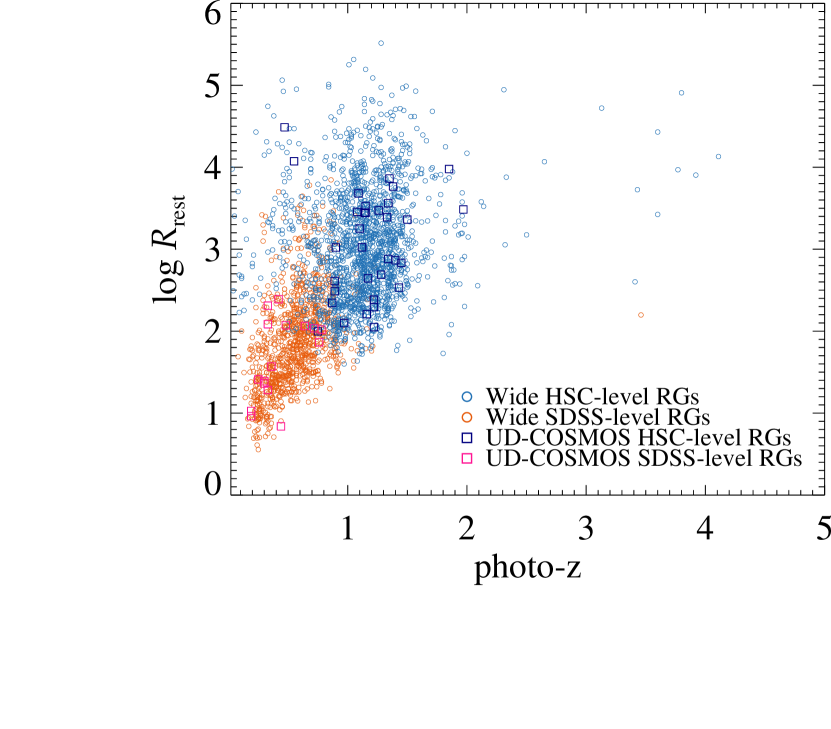
We show each distribution of the SDSS- and HSC-level RG samples in an plane in Figure 15. We distinctly found that the optically faint RGs (the HSC level) have higher radio loudnesses and photo- than the optically bright RGs (the SDSS level). Again, we note that optically faint RGs with a low radio loudness are not detected due to the FIRST sensitivity. However, we claim that our HSC-FIRST RG sample includes a large number () of the optically faint RGs that have high radio loudness () and redshifts of more than 1. These RGs have not been probed by SDSS.
5.2 Optical Spectra and Quasar/Galaxy Classification
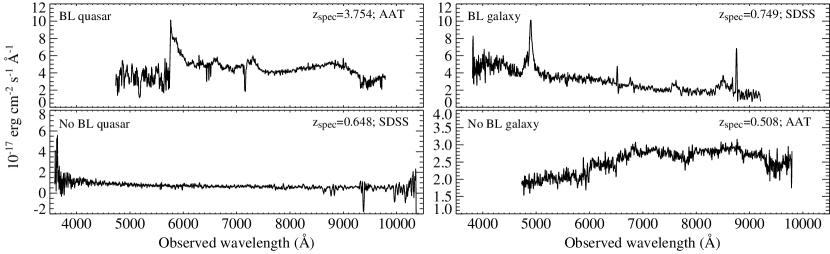
We performed a quasar/galaxy classification using optical spectra in order to inspect the morphological classification based on the HSC-SSP images in Section 3.4. This inspection is based on whether or not a spectrum of a source that was morphologically classified as a quasar (or a galaxy) shows broad emission lines. We used archival spectra available from SDSS DR12 (Alam et al., 2015), GAMA PDR2 (Liske et al., 2015), and zCOSMOS (Lilly et al., 2009). In addition to the archival spectra, we also examined 18 spectra that have been recently obtained with 2dF-AAOmega installed on 3.9 m Anglo-Australian Telescope (AAT) in 2017 July. See He et al. (2018, in preparation) for the details about the observation and data reduction. Finally, we inspected 622 sources in the Wide layer and 21 in the UD-COSMOS layer. These subsamples include sources without a secure spec-. Although this spectral inspection allows us to confirm the morphological classification using the HSC-SSP images, we should take into account the following two points. One is that the -band magnitudes of these subsamples are biased toward a bright side and are distributed from 17.4 to 22.8 in the Wide layer and from 17.7 to 21.9 in UD-COSMOS. The other is that this spectral inspection does not distinguish between quasars and broad-line RGs.
Of the 622 Wide sources with available spectral classification, we have 152 morphologically classified quasars and 470 galaxies. The inspection results show that 130 (86%) morphologically classified quasars and 26 (5.5%) morphologically classified galaxies show broad emission lines. In UD-COSMOS, 2/2 (100%) morphologically classified quasars and 1/19 (5.3%) morphologically classified galaxies show broad emission lines. Therefore, at , there could be 5% contaminations of quasars in both the morphologically classified RG samples of the Wide layer and UD-COSMOS. Examples of four types of spectra, a quasar with/without broad emission lines and a galaxy with/without broad emission lines, are shown in Figure 16.
Additionally, we inspected a redshift dependence of the success rate of the morphological classification with the HSC images. In the classification, an RG could be misclassified as a radio-loud quasar when a source is at a high redshift. We used the morphological information measured with the Advanced Camera for Surveys (ACS) on the Hubble Space Telescope (HST) in the COSMOS region (Leauthaud et al., 2007) and our morphological classification with simulated HSC images at the Wide layer depth in UD-COSMOS. This inspection employed HST ACS morphology data and HSC UD-COSMOS at an imaging depth equivalent to the Wide-layer depth. The ACS images have a higher spatial resolution () than the HSC Wide layer and thus provide a robust classification. The HSC UD-COSMOS images at the Wide layer depth provide three types of seeing: best, median, and worst seeing images with FWHMs of , , and , respectively (Aihara et al., 2018b). The success rate of the HSC morphological classification is defined as a fraction of a number of sources classified as a galaxy by both ACS and HSC to a number of sources classified as a galaxy by ACS. The success rate was examined up to as presented in Figure 17. We confirmed the redshift dependence of the success rate, which moderately decreases with redshifts. The success rate is 95–97% at in the median seeing. Therefore, we found that 3–5% of RGs at could be radio-loud quasars.

5.3 Improved matching rate
Our study using the Subaru HSC-SSP catalog has successfully identified the optical counterparts of 51% and 59% of the FIRST sources in the HSC-SSP Wide layer and UD-COSMOS, respectively. These matching rates are significantly higher than the matching rates of the SDSS-based studies by Ivezić et al. (2002), Helfand et al. (2015), and Ching et al. (2017). Although the adopted search radii are different between the studies, even if we use the completeness-corrected matching rate, our result (47% in the Wide layer) is still higher than the corrected rate of 31% in Ivezić et al. (2002). It is clear that the improved matching rate is due to the utilization of the deep optical catalog, compared with the previous studies, from Figure 7, 8, and 14. This interpretation is supported by the higher matching rate of 59% in UD-COSMOS, which has fainter HSC-SSP sources than the Wide layer.
However, approximately 40% of FIRST sources in the HSC-SSP unmasked region still have no optical counterparts within 1″ of their positions. Our sample criterion of in , , and likely misses a certain fraction of HSC-SSP sources with an extremely red color at the faint end, such as high- red galaxies. Other unmatched FIRST sources are roughly grouped into two types from the inspections of their HSC-SSP images. The first consists of radio sources with bright radio companion(s) close to it. These sources are likely radio lobes associated with low- RGs. The second consists of single radio components. These optical counterparts may be extremely faint in the optical (), such as radio AGNs with a quite low accretion rate, obscured AGNs, radio AGNs in less massive host galaxies, or high-redshifted objects.
6 Summary
We presented the results of the exploration of radio AGNs using the Subaru HSC-SSP catalog and the FIRST VLA catalog. This is the initial result of an ongoing project, WERGS. The positional cross-match between HSC-SSP and FIRST produced 3579 and 63 optical counterparts of the FIRST radio sources in the Wide layer and UD-COSMOS, respectively. These numbers of the matched counterparts correspond to more than 50% of the FIRST radio sources in the search fields, showing a much higher matching rate than the previous studies of optically bright SDSS-FIRST sources ().
We reported the properties in the optical and radio wavelengths of the matched HSC-FIRST sources. Among the HSC-FIRST sources, 9% in the Wide and 3% in the UD-COSMOS layers are optically unresolved sources, that is, likely radio-loud quasars. The -band number counts show a flat slope down to 24 mag, implying a constant number of either less massive or distant radio AGNs. The optically faint sources show the different slopes of the 1.4 GHz source counts from the bright sources with . Almost all of the photometric redshifts of the subsample with available redshift data range up to 1.5. In particular, the optically faint sources are distributed around the redshift of 1. The comparison of the color-color diagram with the galaxy model also shows a similar redshift distribution to the photometric one, and most of the sources are consistent with redshifted early-type galaxies although there is a large dispersion. Thanks to the deep and wide HSC-SSP survey, we found a large number () of sources with high radio loudness () in the optically faint regime. Such sources are distributed at .
We also showed that the rare objects such as sources with the highest radio loudness were found in the wide and shallow field (the Wide layer) rather than in the small and deep field (UD-COSMOS). Together with the improved matching rates, these results demonstrated the advantages of our project over the previous radio AGN searches in terms of both optical depth () and the wide search field (more than 150 deg2).
Counting FIRST Sources on the Unmasked HSC-SSP Regions
In order to count the number of FIRST sources on the unmasked HSC-SSP regions,
we have to consider to the FIRST sources lying within the masked HSC-SSP regions
that result from the selection of the clean HSC-SSP sample.
The flags in the masked regions are described in mask images through an integer bitmask value
(see Bosch et al. 2018 for details).
Regions with the following bitmasks are considered as masked regions
corresponding to the sample selection criteria described in Section 2.1:
BAD (a sensor defect),
BRIGHT_OBJECT (a region near a very bright object),
CR (a cosmic ray),
EDGE (the edge of a CCD or coadded patch),
INTRP (an interpolated pixel),
SAT (a saturated pixel),
and SUSPECT (a pixel value above the level where the linearity correction is reliable).
There were originally 8282 (118) FIRST sources in the HSC-SSP Wide layer (UD-COSMOS) defined in Table 2.1 before any masks were performed. These numbers were FIRST sources which have the nearest HSC-SSP sources within 20″for the purpose of excluding FIRST sources on the patches with poor photometries (see Section 2.1) and counting FIRST sources in UD-COSMOS. After masking, we obtained 7072 and 106 FIRST sources in the unmasked regions of the Wide layer and UD-COSMOS, respectively.
References
- Aihara et al. (2018a) Aihara, H., Arimoto, N., Armstrong, R., et al. 2018a, PASJ, 70, S4
- Aihara et al. (2018b) Aihara, H., Armstrong, R., Bickerton, S., et al. 2018b, PASJ, 70, S8
- Akiyama et al. (2018) Akiyama, M., He, W., Ikeda, H., et al. 2018, PASJ, 70, S34
- Alam et al. (2015) Alam, S., Albareti, F. D., Allende Prieto, C., et al. 2015, ApJS, 219, 12
- Becker et al. (1995) Becker, R. H., White, R. L., & Helfand, D. J. 1995, ApJ, 450, 559
- Bock et al. (1999) Bock, D. C.-J., Large, M. I., & Sadler, E. M. 1999, AJ, 117, 1578
- Bondi et al. (2008) Bondi, M., Ciliegi, P., Schinnerer, E., et al. 2008, ApJ, 681, 1129-1135
- Bosch et al. (2018) Bosch, J., Armstrong, R., Bickerton, S., et al. 2018, PASJ, 70, S5
- Bruzual & Charlot (2003) Bruzual, G., & Charlot, S. 2003, MNRAS, 344, 1000
- Ching et al. (2017) Ching, J. H. Y., Sadler, E. M., Croom, S. M., et al. 2017, MNRAS, 464, 1306
- Ciliegi et al. (2005) Ciliegi, P., Zamorani, G., Bondi, M., et al. 2005, A&A, 441, 879
- Coil et al. (2011) Coil, A. L., Blanton, M. R., Burles, S. M., et al. 2011, ApJ, 741, 8
- Condon (1992) Condon, J. J. 1992, ARA&A, 30, 575
- Condon et al. (1998) Condon, J. J., Cotton, W. D., Greisen, E. W., et al. 1998, AJ, 115, 1693
- Cool et al. (2013) Cool, R. J., Moustakas, J., Blanton, M. R., et al. 2013, ApJ, 767, 118
- Coupon et al. (2018) Coupon, J., Czakon, N., Bosch, J., et al. 2018, PASJ, 70, S7
- Drinkwater et al. (2010) Drinkwater, M. J., Jurek, R. J., Blake, C., et al. 2010, MNRAS, 401, 1429
- Garilli et al. (2014) Garilli, B., Guzzo, L., Scodeggio, M., et al. 2014, A&A, 562, A23
- Edge et al. (1959) Edge, D. O., Shakeshaft, J. R., McAdam, W. B., Baldwin, J. E., & Archer, S. 1959, MmRAS, 68, 37
- Fabian (2012) Fabian, A. C. 2012, ARA&A, 50, 455
- Fanaroff & Riley (1974) Fanaroff, B. L., & Riley, J. M. 1974, MNRAS, 167, 31P
- Furusawa et al. (2018) Furusawa, H., Koike, M., Takata, T., et al. 2018, PASJ, 70, S3
- He et al. (2018) He, W., Akiyama, M., Bosch, J., et al. 2018, PASJ, 70, S33
- Helfand et al. (2015) Helfand, D. J., White, R. L., & Becker, R. H. 2015, ApJ, 801, 26
- Hirata & Seljak (2003) Hirata, C., & Seljak, U. 2003, MNRAS, 343, 459
- Intema et al. (2017) Intema, H. T., Jagannathan, P., Mooley, K. P., & Frail, D. A. 2017, A&A, 598, A78
- Ivezić et al. (2002) Ivezić, Ž., Menou, K., Knapp, G. R., et al. 2002, AJ, 124, 2364
- Jiang et al. (2007) Jiang, L., Fan, X., Ivezić, Ž., et al. 2007, ApJ, 656, 680
- Kellermann et al. (1989) Kellermann, K. I., Sramek, R., Schmidt, M., Shaffer, D. B., & Green, R. 1989, AJ, 98, 1195
- Komiyama et al. (2018) Komiyama, Y., Obuchi, Y., Nakaya, H., et al. 2018, PASJ, 70, S2
- Laigle et al. (2016) Laigle, C., McCracken, H. J., Ilbert, O., et al. 2016, ApJS, 224, 24
- Landsman (1993) Landsman, W. B. 1993, Astronomical Data Analysis Software and Systems II, 52, 246
- Leauthaud et al. (2007) Leauthaud, A., Massey, R., Kneib, J.-P., et al. 2007, ApJS, 172, 219
- Le Fèvre et al. (2013) Le Fèvre, O., Cassata, P., Cucciati, O., et al. 2013, A&A, 559, A14
- Lilly et al. (2009) Lilly, S. J., Le Brun, V., Maier, C., et al. 2009, ApJS, 184, 218
- Liske et al. (2015) Liske, J., Baldry, I. K., Driver, S. P., et al. 2015, MNRAS, 452, 2087
- Lupton et al. (2001) Lupton, R., Gunn, J. E., Ivezić, Z., Knapp, G. R., & Kent, S. 2001, Astronomical Data Analysis Software and Systems X, 238, 269
- Manchester et al. (2005) Manchester, R. N., Hobbs, G. B., Teoh, A., & Hobbs, M. 2005, AJ, 129, 1993
- McCarthy (1993) McCarthy, P. J. 1993, ARA&A, 31, 639
- McNamara et al. (2005) McNamara, B. R., Nulsen, P. E. J., Wise, M. W., et al. 2005, Nature, 433, 45
- Miley & De Breuck (2008) Miley, G., & De Breuck, C. 2008, A&A Rev., 15, 67
- Miyazaki et al. (2018) Miyazaki, S., Komiyama, Y., Kawanomoto, S., et al. 2018, PASJ, 70, S1
- Morganti et al. (2013) Morganti, R., Fogasy, J., Paragi, Z., Oosterloo, T., & Orienti, M. 2013, Science, 341, 1082
- Schinnerer et al. (2007) Schinnerer, E., Smolčić, V., Carilli, C. L., et al. 2007, ApJS, 172, 46
- Schlegel et al. (1998) Schlegel, D. J., Finkbeiner, D. P., & Davis, M. 1998, ApJ, 500, 525
- Seymour et al. (2007) Seymour, N., Stern, D., De Breuck, C., et al. 2007, ApJS, 171, 353
- Simpson et al. (2006) Simpson, C., Martínez-Sansigre, A., Rawlings, S., et al. 2006, MNRAS, 372, 741
- Simpson et al. (2012) Simpson, C., Rawlings, S., Ivison, R., et al. 2012, MNRAS, 421, 3060
- Smolčić et al. (2017b) Smolčić, V., Delvecchio, I., Zamorani, G., et al. 2017, A&A, 602, A2
- Smolčić et al. (2017a) Smolčić, V., Novak, M., Bondi, M., et al. 2017, A&A, 602, A1
- Stoughton et al. (2002) Stoughton, C., Lupton, R. H., Bernardi, M., et al. 2002, AJ, 123, 485
- Tadhunter (2016) Tadhunter, C. 2016, A&A Rev., 24, 10
- Tanaka (2015) Tanaka, M. 2015, ApJ, 801, 20
- Tanaka et al. (2018) Tanaka, M., Coupon, J., Hsieh, B.-C., et al. 2018, PASJ, 70, S9
- Taylor (2005) Taylor, M. B. 2005, Astronomical Data Analysis Software and Systems XIV, 347, 29
- Taylor (2006) Taylor, M. B. 2006, Astronomical Data Analysis Software and Systems XV, 351, 666
- White et al. (2000) White, R. L., Becker, R. H., Gregg, M. D., et al. 2000, ApJS, 126, 133
- White et al. (1997) White, R. L., Becker, R. H., Helfand, D. J., & Gregg, M. D. 1997, ApJ, 475, 479
- Williams et al. (2018) Williams, W. L., Calistro Rivera, G., Best, P. N., et al. 2018, MNRAS, 475, 3429
- York et al. (2000) York, D. G., Adelman, J., Anderson, J. E., Jr., et al. 2000, AJ, 120, 1579