Unconventional field induced phases in a quantum magnet formed by free radical tetramers
Abstract
We report experimental and theoretical studies on the magnetic and thermodynamic properties of NIT-2Py, a free radical-based organic magnet. From magnetization and specific heat measurements we establish the temperature versus magnetic field phase diagram which includes two Bose-Einstein condensates (BEC) and an infrequent half magnetization plateau. Calculations based on density functional theory demonstrates that magnetically this system can be mapped to a quasi-two-dimensional structure of weakly coupled tetramers. Density matrix renormalization group calculations show the unusual characteristics of the BECs where the spins forming the low-field condensate are different than those participating in the high-field one.
I Introduction
The exact mapping between spin systems and hard bosons proposed by Matsubara and Matsuda in 1956 Matsubara1956 has opened the possibility of observing Bose-Einstein condensates (BEC) in quantum magnets. Several experimental realizations can be found in the literature, very often formed by interacting transition metal dimers zapf_bose-einstein_2014 ; giamarchi_boseeinstein_2008 . A typical scenario invokes a ground state described by pairs of localized spins forming singlets. An external magnetic field acts as an effective chemical potential for triplet excitations that can subsequently form the BEC, characterized by the presence of (XY) long range magnetic order in the direction perpendicular to the field. Since a finite magnetic field is necessary to break the dimerized singlets, the temperature versus magnetic field phase diagrams typically display a “dome” structure bounded by two critical fields, , and a field-dependent critical temperature . While most cases of magnetic BECs formed by 1/2 dimers follow this picture (see Ref. [zapf_bose-einstein_2014, ] for a review) there are magnets such as Cs2CuCl4 Coldea2002 ; Radu2005 ; Sebastian2006 , where the system is already ordered at zero field.
BECs have also been observed in systems formed by 1 dimers such as Ba3Mn2O8 Samulon2008 ; samulon_asymmetric_2009 or the organic biradical F2PNNNO Tsujii2005 ; Hosokoshi1999 ; Bostrem2010 where the total spin can take the values 0, 1, and 2. These systems present an energy gap above the singlet ground state and a half magnetization plateau corresponding to the triplet state of the dimers. In Ba3MnO8 Samulon2008 ; samulon_asymmetric_2009 two field-induced domes have been observed, the first one corresponding to the condensation of triplets and the second one to the condensation of quintuplets.
A similar behavior with two field-induced domes can be expected in a system of weakly interacting 1/2 tetramers, where it is possible to realize non-trivial intra-tetramer quantum order determined by the relative strength of the exchange interactions. Unfortunately, contrary to the large amount of low dimensional systems where the magnetic centers form dimers, there are very few low dimensional systems formed by interacting tetramers: Cu2CdB2O6 Hase2005 ; Hase2009 ; Hase2015 ; Janson2012 , CuInVO5 Hase2016 , and SeCuO3 Zivkovic2012 . In these systems, where the magnetic centers are electrons carried by the Cu atoms, the large values of the magnetic interactions prevents the experimental exploration of the full phase diagram. For these reasons, to the best of our knowledge, no observation of Bose-Einstein condensation has been reported so far in 1/2 tetramers.
In this work, we present experimental and theoretical evidence for Bose-Einstein condensation in a crystal of NIT-2Py, a free radical-based organic magnet barone_ab_1993 which behaves as weakly interacting 1/2 tetramers. We show that the physics can be described in terms of a fully rotational invariant system of quantum spins without frustration. When increasing the magnetic field, at low temperature, we find the existence of three quantum phases. We interpret two of them as having the physics of BECs. In the low-field phase only the edge spins of each tetramer contribute to the condensate, while in the high-fields phase, the order is determined by the two central spins. These unusual BECs are separated by an incompressible state at half-magnetization that is a genuine quantum phase, with half of the spins forming dimerized pairs, and the other half aligned in the direction of the field.
The paper is organized as follows. The experimental details are given in Section II and the experimental results are presented in Section III. The latter includes, the determination of the crystallographic structure (III.1), the characterization of the magnetic properties from susceptibility and magnetization measurements (III.2), the evaluation of the magnetic contribution to the specific heat (III.3), and the determination of the temperature versus magnetic field phase diagram (III.4). The theoretical evaluation of the effective exchange interactions of the Heisenberg Hamiltonian is presented in Section IV and the determination of the ground state of the system versus the applied magnetic field is given in Section V. Section VI concludes the paper with a short summary.
II Experimental details
The organic insulator 2-(2-Pyridyl)-4,4,5,5-tetramethyl-4,5-dihydro-1,H-imidazole-3-oxide-1-oxyl, shortly called NIT-2Py, is part of the nitronyl nitroxide family. Crystals of NIT-2Py were grown according to the method published in References osiecki_studies_1968, ; ullman_stable_1970, and single crystals up to mm have been obtained. The crystal structure was confirmed in a single-crystal X-ray diffraction experiment performed on a Bruker Microstar X8/Proteum diffractometer equipped with a Copper rotating anode delivering Cu K-alpha radiation through multilayer Helios mirror optics. These data can be obtained free of charge from the Cambridge Crystallographic Data Centre (CCDC-1531994).
The magnetic susceptibility and magnetization were measured in a commercial Quantum Design VSM SQUID magnetometer in the temperature range from 1.8 to 300 K and magnetic fields up to 7 T, where the sample was mounted with Apiezon N grease. For temperatures from 0.5 to 2 K, and magnetic fields up to 7 T we used a Quantum Design SQUID magnetometer equipped with an iHelium3 option from IQUANTUM. Here the sample was positioned in a Kapton tube and fixed with Teflon tape. We also carried out measurements in pulsed magnetic fields up to 20 T in a pumped 4He cryostat. Here, the sample was fixed inside a compensated pick-up coil with Apiezon N grease.
The specific heat at ambient and under pressure was measured between 0.35 and 35 K in Quantum Design Physical Properties Measurement System (PPMS) equipped with a 3He option and in magnetic fields up to 9 T. The specific heat under pressure was measured using a homemade miniature CuBe pressure clamp miclea_investigation_2005 with a small piece of lead as the pressure indicator. This pressure cell is small enough to fit into the 3He insert of a PPMS. The magnetocaloric measurements were carried out in a dilution refrigerator equipped with a 20 T magnet. The sample was attached to a sapphire chip with Apiezon N. This platform has a thermometer, and is weakly coupled to a temperature regulated bath. The measurements were then carried out by placing the sample at a specific point in the H-T phase diagram and then a field ramp was started. During the ramp, the temperature of the bath was set to the sample temperature in a closed loop, while temperature and field were recorded continuously.
III Experimental results
III.1 Crystallographic structure
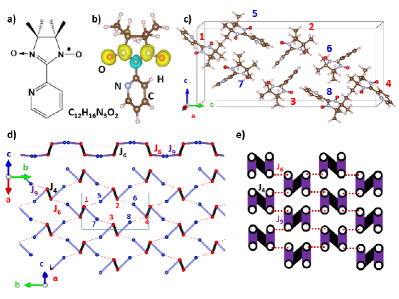
NIT-2Py crystallizes in the P21/c space group No. 14. The chemical and atomic structure of the isolated molecule is shown in Figures 1(a) and (b) and the monoclinic unit cell in Fig. 1(c). It contains 264 atoms. The lattice parameters are a = 6.1471 Å, b = 30.0605 Å, c = 12.9583 Å, and . There are 8 molecules per unit cell barone_ab_1993 belonging to two inequivalent groups of four molecules each (molecules numbered in red 1 to 4 and numbered in blue 5 to 8).
III.2 Susceptibility and magnetization
While the magnetism of metallic ions arises from unfilled atomic or orbitals, the magnetic moment in free radicals stems from unfilled molecular orbitals. For each NIT-2Py molecule, there is one unpaired electron that leads to a spin per molecule. The inverse of the magnetic susceptibility measured on polycrystalline NIT-2Py is shown in Fig. 2(a). A deviation from the expected Curie-Weiss law is observed due to significant diamagnetic contributions (see Fig. 2(a)). As NIT-2Py carries only one spin per molecule, which contains a total of 33 atoms, the diamagnetic contribution to the magnetic susceptibility from molecular bonds is significant. It has been subtracted requiring that the remaining (paramagnetic) part would follow a perfect Curie-Weiss law resulting in a of emu/mol. A value which is of the same order of magnitude as the one that can be calculated from tabulated values of Pascal’s contributions from closed molecular orbitals bain_diamagnetic_2008 .
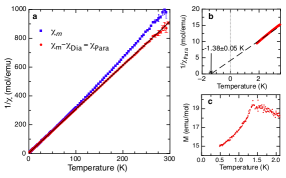
Fitting a Curie-Weiss law to results in an effective moment of per molecule, which is in agreement with the expected value of for a spin from the unpaired electron of each NIT-2Py molecule. The Curie-Weiss temperature of of K (see Fig. 2(b)) points to antiferromagnetic interactions between the NIT-2Py molecules.
Measurements on a single crystal of NIT-2Py along different crystallographic directions showed no significant evidence for an angular dependence of the magnetic susceptibility after we corrected for sample geometry chen_demagnetizing_1991 . This is expected for an organic compound such as NIT-2Py with small spin-orbit coupling.
Temperature dependent magnetization measurements at 50 Oe and below 2 K on a single crystal show a maximum around 1.4 K and a point of inflection at 1.3 K (see Fig. 2(c)) indicating a possible antiferromagnetic transition at a characteristic temperature similar to the Curie-Weiss temperature.
Magnetization isotherms of NIT-2Py at different temperatures are shown in Fig. 3(a), where it can be seen that a plateau at half of the saturation value begins to develop for temperatures below 1.45 K and which is fully developed at 0.5 K. The observed saturation value corresponds to 1 per molecule, as expected for one free spin per NIT-2Py molecule. The dependence of the magnetization versus temperature at different magnetic fields is shown in Fig. 3(b). The convergence of the magnetization curves to 0.5 at low temperature for magnetic fields between 2 to 5 T corresponds to the plateau at half the full magnetization.
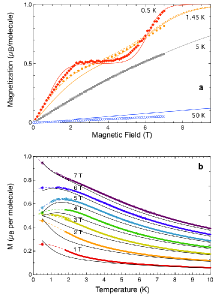
While fractional plateaus are usually associated with quantum effects, a simple possible explanation for the existence of this plateau could be that one of the two crystallographically inequivalent groups of molecules (see Fig. 1(c)) form antiferromagnetic dimers and the other ones behave as paramagnets Rule2008 ; Aimo2009 . This picture fails to be conclusive because the magnetization increase between 0 and 2 T is slower than the paramagnetic contribution 0.672 indicating that other antiferromagnetic interactions are also playing a significant role.
III.3 Specific heat
The specific heat of NIT-2Py is shown in Fig. 4(a) for temperatures up to 35 K. The magnetic contribution to the specific heat is given by , where is the phonon contribution. This contribution was estimated by fitting the specific heat above 12 K to a Debye model:
| (1) |
Here, is the temperature, is the Debye temperature, and the number of molecules. The fit resulted in a of 122 K. Such a low value of is expected in a system with weak bonds between the molecules such as in a molecular crystal like NIT-2Py. The fit also resulted in a of 2.1, which indicates that the two rings of the molecule act as independent vibrational units. In zero applied fields, features a sharp peak at K superimposed over a large Schottky-like anomaly towards higher temperatures. This value of is the same temperature, at which we observe a point of inflection in the magnetization, suggesting the presence of an antiferromagnetic phase transition.
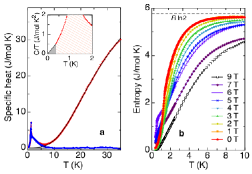
We calculated the magnetic entropy associated with the phase transition by numerically integrating our specific heat data . The result of this integration is shown in Fig. 4(b). In order to be able to carry out this integration, we extrapolated linearly to zero Kelvin, as shown in the inset of Fig. 4(b). The zero field entropy shows that only a small fraction of the value of expected for the magnetic entropy of a spin is recovered just above the transition at 1.32 K. In order to fully recover , we have to integrate up to 8 K, which indicates that only a fraction of a spin is ordering in the transition.
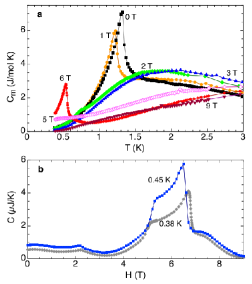
We have also carried out specific heat measurements in a number of magnetic fields. The corresponding magnetic contributions are shown in Fig. 5(a). The phase transition seen in zero field is rapidly suppressed in a magnetic field. At a field of 2 T, only a small peak is visible, whereas most of the weight of the transition has merged with the Schottky-like anomaly centered at 2 K, until the transition is completely suppressed at T. Increasing the field further pushes the broad anomaly to higher temperatures. At 6 T, a very sharp peak is observed, indicating the presence of a second phase transition. This transition occurs only for a limited field range, being absent at 5 and 7 T. To map out this second phase transition, we additionally carried out specific heat measurements at fixed temperatures as a function of magnetic field. Specific heat measurements versus magnetic field at 0.38 K present anomalies at 2.2, 5.1 and 6.7 T confirming the existence of the three phase transitions (Fig 5(b)). When increasing the temperature the first anomaly shifts to lower magnetic fields and the other two approach each other and finally disappear for temperatures above the maximum critical temperature T) of 0.53 K.
III.4 Phase diagram
The second anomaly seen in the specific heat forms a dome in the -phase diagram (see Fig. 6), which is reminiscent of the Bose-Einstein condensation of magnons seen in quantum paramagnets zapf_bose-einstein_2014 , and easy-plane antiferromagnets with -rotational invariance around a crystallographic axis Radu2005 .

In order to further explore the phase boundary of this field induced dome, we carried out magnetocaloric measurements, which are shown in Fig. 7(a). Characteristic traces for fields being swept up or down both show heating when the phase boundary is crossed. This suggests that our sample and the thermal bath are in equilibrium according to the discussion of magnetocaloric experiments in Ref. zapf_bose-einstein_2014, . We determined the phase boundary as the midpoint between the two extrema of the -trace. The phase boundary determined from magnetocaloric measurements is in fair agreement with the one determined from specific heat measurements. The critical exponent of the upper critical field extracted from the results of the magnetocaloric measurements suggests that the field-induced order is a Bose-Einstein condensation of magnons. The critical exponent is related to the power law dependence of . Since the value of depends sensitively on , we followed the procedure laid out in Ref. Sebastian2005, to obtain an accurate value for the critical exponent.
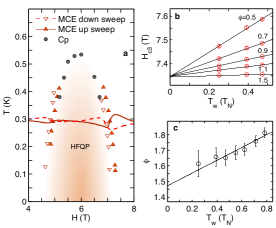
First, the critical field is determined by a fit to the data for different temperature windows for various trial values of . The values of resulting from these fits are shown in Fig. 7(b). An accurate value of the physical critical field is obtained by the extrapolation to an infinitesimally small temperature window for each trial value of . Here, all the different extrapolations for different converge to T. Using this value, the critical exponent was obtained through a similar extrapolation to infinitesimally small temperature window, as shown in Fig. 7(c). The resulting value corresponds well to expected for a 3D Bose-Einstein condensate of magnons Affleck1991 ; Giammarchi_Tsvelik_2000 ; Nikuni2000a .
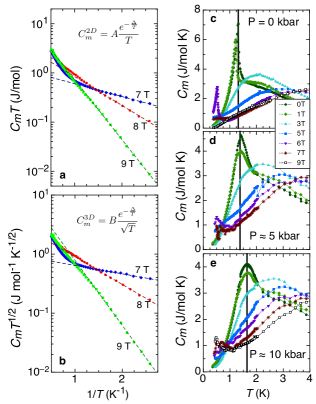
The field dependence of at fixed temperatures (see Fig. 5(b)) shows a Schottky-like anomaly for fields above the upper critical field , indicating the presence of a gap in the magnon spectrum of the field polarized ferromagnetic phase. For the transition at to be a Bose-Einstein condensation this magnon gap needs to close at Radu2005 . To search for a magnon gap in NIT-2Py, we analyzed the magnetic specific heat data for fields above . To extract the size of the magnon gap we tested contributions from a 2D, as well as from a 3D magnon fluctuation spectrum. This analysis is shown in Figs. 8(a) and (b), respectively. Here, we are following the example laid out for Cs2CuCl4, which in zero field displays -antiferromagnetic order which is invariant around the -axis Radu2005 . Applying a magnetic field along the -axis then breaks this symmetry, as the transverse spin component orders at Radu2005 . This leads to the appearance of a Goldstone mode with a linear dispersion, which in the case of Cs2CuCl4 in Ref. Radu2005, was interpreted as the signature of a magnon Bose-Einstein condensation. We fitted our 7, 8 and 9 T data with , which is characteristic for a 2D magnon spectra, as well as , which is characteristic for a 3D spectrum. Both curves fit our data equally well in the available temperature and magnetic field range, and we are unable to determine the dimensionality of the magnons in the field induced ferromagnetic phase. The values of the gaps obtained from our fits, which are very similar in size for both models, are shown in the -phase diagram shown in Fig. 6. For both spectra, the resulting magnon gap disappears at at zero temperature, as required for case of Bose-Einstein condensation.
The interactions in NIT-2Py are due to the overlap of the atomic orbitals of the different molecules. As organic materials often show a drastic change of their physical properties, see for example Ref. Toyota2007, , such a the appearance of superconductivity and charge- or spin-density wave transitions. We measured specific heat of NIT-2Py with applied pressures of 0, 5 and 10 kbar in a number of applied fields. The results are shown in Figs 8(c), (d), and (e). While pressure somewhat broadens the anomalies in the specific heat, the anomalies are still visible. Pressure increase the temperature of the first dome, as well as the second dome, but also pushes the maximum of the domes and the upper critical field of the anomalies to higher fields, as shown in Fig. 6.
The -phase diagram of Fig. 6 combines specific heat and magnetocaloric data. For fields below of T, we find a low field quantum phase from specific heat measurements. For this range of magnetic fields, the magnetization increases approximately linearly with applied field at 0.5 K. For fields between , and , the magnetization shows a plateau at half the saturation value at 0.5 K The occurrence of half magnetization plateaus is rare, and we are only aware of two examples: the spin 1 dimers Ba3Mn2O8 Samulon2008 ; samulon_asymmetric_2009 , and the organic biradical F2PNNNO Tsujii2005 ; Hosokoshi1999 ; Bostrem2010 . For fields above the magnetization increases again and saturates at , where the specific heat and magnetocaloric results indicate a phase boundary. This suggests, that NIT-2Py displays two field induced Bose-Einstein condensations. This is also borne out by the vanishing magnon gap at , which was extracted from specific heat data in magnetic fields larger than .
IV Calculation of the effective exchange interactions
To understand the magnetic order at the origin of the phase transitions one needs to determine the leading magnetic interactions between the NIT-2Py molecules. Due to the negligible anisotropy we have assumed that the magnetic properties can be described by a rotational invariant Heisenberg Hamiltonian:
| (2) |
where is the spin-independent part of the Hamiltonian, are the magnetic couplings, and and are the spin operators localized on the NIT-2Py molecules at site and , respectively. Unfortunately, it is difficult to see an obvious arrangement of the molecules which can be used to predict the relative strength of the exchange interactions by inspection of the crystal structure.
Moreover, compared to transition metals oxide based quantum magnets saul_magnetic_2011 ; radtke_interplay_2010 ; saul_density_2014 , the spin polarization in NIT-2Py is highly delocalized on the O-N-C-N-O branch in the center of the molecule (see Fig. 1(b)) like in other members of the family zheludev_neutron_1995 ; hirel_cyano_2002 . Hence, the interactions are expected to have a rather extended range. For this reason, we have calculated 13 different interactions up to intermolecular distances of 9.404 Å (see Table 1). To classify the exchange interactions we used the distance between the central C atoms in the O-N-C-N-O branch of each molecule.
The calculations were performed using a broken-symmetry formalism, i.e., by mapping total energies corresponding to various collinear spin arrangements within a supercell onto the Heisenberg Hamiltonian of Eq. 2. For the calculations we have used the Quantum Espresso Giannozzi2009 code based on density functional theory, ultrasoft pseudopotentials and the PBE functional perdew_generalized_1996 with a plane-wave and charge-density cutoff of 80 Ry and 320 Ry, respectively. We have used a 4x1x2 Monkhorst-Pack Monkhorst1976 grid for the first Brillouin zone sampling of the 264 atoms monoclinic 111 unit cell and adapted equivalent samplings for the double 211 and 112 or the quadruple 212 super-cell calculations. A full relaxation of the internal coordinates of the 264 atoms has been performed in the 111 cell. The same relaxed coordinates have been consistently used to construct the supercells. The different supercells were needed to distinguish the exchange interactions between a molecule and two different molecules which are connected by the translation symmetry if the 111 unit cell is used. Only the 1056 atoms 212 unit cell allows to calculate separately the 13 interactions. The 264 atoms 111 unit cell, whose total energy can be written as :
| (3) | |||||
neither allow to calculate and nor to separate , , , and ; and ; and ; and and . Similar limitations arise with the 528 atoms 112 and 211 unit cells, whose total energies are :
| (4) | |||||
and
| (5) | |||||
The coefficients , , and depend on the spin arrangements of the molecules.
Two different calculation procedures have been used to calculate the effective exchange interactions. The first procedure uses a least-squares minimization of the difference between the DFT and Ising relative energies to obtain a numerical evaluation of the couplings. The second procedure allows to calculate separately the effective exchange interaction. For example, the interaction between spin and can be evaluated from:
| (6) |
where are the four spin configurations where the spins and take the values up or down while all the other spins are kept upXiang2013 . could be a single or a sum of exchange interactions depending on the size of the unit cell used to calculate the total energies.
As the 111 unit cell contains 8 molecules there is a total of 256 distinct spin configurations. However, taking crystal and spin reversal symmetries into account this number can be reduced to 39. The application of the least-squares minimization procedure to this unit cell gives a first estimation of the exchange interactions (in units of K):
| = | ||
| = | ||
| = | ||
| = | ||
| = |
The second procedureXiang2013 was used with the larger unit cells to evaluate and and separate the exchange interactions. All the calculations gave consistent values of the exchange interactions with an overall error of K. For example, with the 211 unit cell we obtain :
| = | ||
| = | ||
| = | ||
| = | ||
| = | ||
| = |
whose corresponding sums are in good agreement with the values obtained from the single unit cell. Similarly, with the 112 unit cell we get :
| = | ||
| = |
in agreement with the above estimations. A summary of the calculated exchange interactions is shown in Table 1.
| d [Å] | Equivalent group | [K] | |
|---|---|---|---|
| 6.15 | 1-1 | 0.9 | |
| 6.15 | 2-2 | 2.9 | |
| 6.43 | 1-1 | 0.6 | |
| 6.68 | 2-2 | 0.5 | |
| 7.00 | 1-1 | 11.9 | |
| 7.40 | 1-2 | 0.6 | |
| 7.86 | 1-2 | 6.2 | |
| 7.94 | 1-1 | 1.1 | |
| 8.08 | 1-2 | 0.2 | |
| 8.20 | 1-2 | 8.1 | |
| 8.26 | 2-2 | 0.0 | |
| 8.63 | 1-1 | 0.1 | |
| 9.40 | 1-2 | 2.4 |
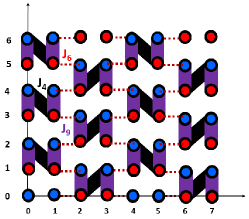
It is interesting to note that in spite of the fact that most of the interactions have non-zero values, the three leading couplings are all antiferromagnetic with positive values, namely, , , and K. The strongest interaction is represented by the thick black lines in Fig. 1(d) and connects molecules, which are related by symmetry (1 and 4 or 2 and 3 as labeled in Fig. 1(c)). If one sets and to zero the equivalent magnetic lattice would correspond to dimers on one of the two sublattices formed by one of the groups of four crystallographically equivalent molecules and isolated paramagnets on the other. If one keeps the second-largest interaction, , represented by violet lines in Fig. 1(d), the system becomes an ensemble of independent tetramers consisting of four moments. When the third-strongest term is added, the magnetic structure forms a corrugated 2D lattice of interacting tetramers, as shown in Fig. 1(d). This family of planes is indexed by {-1,0,2}. Despite the complexity of the structure and the large number of couplings the system is not frustrated, and it is possible to satisfy the conditions for an antiferromagnetic Néel order (see Fig. 11), in agreement with experiments.
Magnetization isotherms calculated by exact diagonalization for a system of four coupled tetramers show a good qualitative agreement with the experimental data in spite of a systematic shift of the critical fields and temperatures to larger values. The reason for this difference lies in the known overestimation of the exchange interactions when a semilocal functional is used Mazurenko2014 ; saul_density_2014 . A quantitative match with the experiments requires smaller values of the exchange interactions.
The order of magnitude of the intra-tetramer exchange interactions ( and ) can be obtained by comparing the two critical fields and (equations (19) and (20)), corresponding to the stabilization of the triplet and quintuplet ground states of the isolated tetramer, to the values of the magnetic field at the center of the domes in the vs phase diagram shown in Fig. 6. The intensity of the inter-tetramer interaction () can be estimated from the width of the domes at zero temperature. The critical fields of about 1.1 T and 5.8 T and a half width 1.25 T (see Fig. 6) give a rough estimate of , , and K. A more precise estimation can be obtained by a least-squares minimization of the differences between the experimental and theoretical magnetization obtained by exact diagonalization of the Heisenberg Hamiltonian given in Eq. 2. With this procedure we obtained , , and K. These values has been used in the rest of the work and for the solid lines in Fig. 3.
V Calculation of the ground state versus magnetic field
In order to determine the ground-state of this system in an applied magnetic field we performed density matrix renormalization group calculations (DMRG) White1992 ; White1993 . For clarity and convenience, we have placed the tetramers on the vertices of a square lattice, as shown in Fig. 1(e). The calculations were performed on cylinders of different aspect ratios. The antiferromagnetic exchange between tetramers is smaller by at least a factor of three compared to the ones within tetramers, and J9. In zeroth-order approximation we can consider the ground-state to be a crystal of singlets. Nevertheless, these interactions are very important, since they are responsible for establishing long-range magnetic order. The weakly entangled nature of our model makes it amenable to DMRG calculations, which have already proven very successful in unveiling the magnetic phases of the Shastry-Sutherland compound SrCu2(BO3)2 Jaime2012 ; Haravifard2016 ; Matsuda2013 . Simulations at zero field yield a small but finite singlet-triplet gap of K. Moreover, the ground-state energy per tetramer is very close to the value for an isolated tetramer , indicating that the ground-state is a crystal of tetramers without long-range antiferromagnetism (the dependence of the ground state energy is shown in Fig. 12). However, it is possible that inter-layer or additional interactions could close the gap and establish true long-range order. We notice that the zero field critical temperature is K, so it is possible that the material is very close to a quantum critical regime separating a magnetically ordered state from a crystal of tetramers. At the magnetization plateau at the Heisenberg contribution to the ground-state energy is , whereas the one of islated tetramers is . Therefore, the plateau can also be described as an incompressible crystal of tetramers, in which the spins sitting at the edges on the weak bonds are fully polarized in the direction of the field, and the two central spins form a tightly bound dimer. Explicitly, the wave function of a single tetramer at half magnetization can be written as:
| (7) |
with
| (8) |
and
| (9) |
describing a singlet between the two edge spins and between the central spins, respectively. In our case we find , meaning that the latter carries almost all the weight. Although we assume this picture of decoupled tetramers to simplify the description of the problem, in reality the DMRG simulations indicate that the moment of the edge spins is and finite but very small correlations connect nearby tetramers.
The BEC regime is realized both between zero and the lower critical field and between the end of the plateau at and full polarization at , corresponding to the grey LFQP and red HFQP regions in Fig. 6, respectively. As the magnetic field increases, the edge spins start canting in the direction of the field, simultaneously establishing a correlated state with long-range order in the transverse plane. In bosonic language, the edge spins form a superfluid with off-diagonal long-range order, while the central spins remain dimerized. A similar behavior is found above the plateau, with the central spins canting in the direction of the field, while the edge spins remain fully polarized.
In order to characterize the different field-induced phases we calculated the longitudinal and transverse spin-structure factors, defined as:
| (10) | |||||
| (11) |
where the direction is chosen along the applied magnetic field and the spin coordinates and momenta are the ones of the topologically equivalent square lattice mentioned above. In the basis, these quantities measure diagonal and off-diagonal long-range order, respectively.

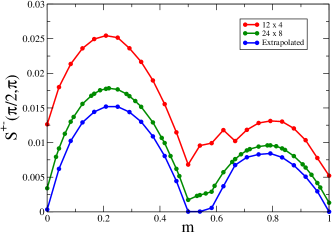
Results for different magnetization values are shown in Fig. 9. Panels (a)-(d) display the longitudinal component , while panels (e)-(h) show the transverse component. Note that the unit cell used for these calculations is a single spin on a square lattice (Fig. 1(e)). The corresponding order is sketched below. At the correlations do not display a sharp peak, and they are almost evenly distributed along the axes. This result can be easily recovered by considering a crystal of tetramers in their singlet ground state. At we similarly can reproduce the measured quantities by assuming a crystal of triplets. The edge spins are fully polarized, as reflected in the peaks of the longitudinal structure factor at (see Fig. 9). The peak at is proportional to the total magnetization squared. In the transverse direction, we do not observe a sharp peak, and our results describe a valence-bond solid, or crystal of dimers. At and the off-diagonal correlations show sharp additional peaks at , indicating the onset of long-range order (see Fig. 9). It is important to highlight that this regime cannot be explained in terms of isolated tetramers, and emerges as an effect of correlations and due to the inter-molecule interactions. In this sense, neither dimers nor edge spins are fully disentangled. In order to determine the existence of off-diagonal order in the thermodynamic limit we perform a finite size scaling of the structure factor, shown in Fig. 10, We carried out a linear extrapolation in using cylinders with the same aspect ratio. Results indicate a finite window around where the off-diagonal correlations vanish, suggesting the existence of a new phase with a coexistence of fully polarized spins and a disordered state resulting from the “melting” of the valence bond solid.
VI Summary
Our experimental data backed by comprehensive theoretical and numerical analysis demonstrate a rich and unconventional magnetic behavior in the organic molecular crystal NIT-2Py with field-induced phases that can only be interpreted in term of a quantum-mechanical description. Specific heat and magnetocaloric measurements indicated the presence of two domes in -phase diagram: At zero field NIT-2Py shows an antiferromagnetic phase transition. However, the entropy associated with this phase transition is only a fraction of , indicating, that the ground state of this crystal of spin 1/2 carrying molecules is quantum mechanical in nature. An applied field suppresses this phase transition at a critical field of 2.2 T. This is the same field at which the magnetization measured at 0.5 K becomes field independent and shows a plateau at half the saturation value up to a of 4.5 T, where a second anomaly appears in the specific heat. Here the magnetization starts to increase again linearly up to saturation value of 1 to saturate at a field of of 7.3 T, where the second anomaly in specific heat disappears. The exponent of the power-law behavior at of this second dome in the -phase diagram corresponds to the value expected for a Bose-Einstein condensation of magnons. This is supported by the magnon gap we see in the specific heat for magnetic fields above , which closes at .
In order to be able to propose an effective model of the interactions in NIT-2Py, we carried out a series of total energy calculations in the so-called broken symmetry formalism, where the spins on the molecules are polarized by hand. Due to lack of spin-orbit interaction in NIT-2Py, the total energies can be mapped directly to the rotational invariant Heisenberg Hamiltonian of Eq. 2. By using super cells of up to we were able to identify the different exchange interactions between neighboring molecules. As listed in Table 1 we found that the leading interactions are all antiferromagnetic. The minimal magnetic model obtained by mapping the coordination and strength of the interactions back to the structure consists in spin 1/2 tetramers, which form a corrugated 2D lattice parallel to the {-1,0,2} set of crystallographic planes, as shown in Fig. 1(d). The strength of the interactions obtained from the broken symmetry formalism are comparable to the values which result from fitting the exchange constants to the magnetization data of NIT-2Py, as shown Fig. 3(a).
Having established the minimal magnetic model, we carried out DMRG calculations on finite but large systems and determined the magnetic phase diagram To summarize the qualitative picture that emerges from our results and analysis, we find a low field BEC formed by the spins at the ends of the tetramers, with the two spins in the middle strongly entangled into dimers. The high field BEC is formed by the central spins, with the ones at the edges practically fully polarized. The high field BEC is qualitatively similar to TlCuCl3 Tanaka2001 ; Ruegg2003 , since right above the plateau the system basically consists of a crystal of dimers, and can be described in the same language with the (practically polarized) edge spins mediating the interactions between the singlets. Unlike most quantum magnets that realize a classical “up-up-up-down” order in the half-magnetization plateau, NIT-2Py exhibits a true quantum state, similar to the one reported in CdCu2(BO3)2 Hase2009 ; Janson2012 , formed by a valence-bond solid coexisting with fully polarized spins. We hope that NIT-2Py can become a new exciting playground to realize novel states and study quantum phase transitions, for instance under chemical doping or hydrostatic pressure.
Acknowledgements.
The research at UdeM received support from the Natural Sciences and Engineering Research Council of Canada (Canada), Fonds Québécois de la Recherche sur la Nature et les Technologies (Québec), and the Canada Research Chair Foundation. Part of this work was supported by HLD at HZDR, a member of the European Magnetic Field Laboratory (EMFL). N.G. thanks for the hospitality of the Max Planck Institute for Chemical Physics of Solids. A.F. acknowledges the U.S. Department of Energy, Office of Basic Energy Sciences, for support under grant DE-SC0014407. A. S. and A.F. thank M. Jaime, C. Batista and G. Radtke for fruitful discussions. D.L. and C.R. are grateful for funding by the Centre National de la Recherche Scientifique (CNRS) for collaborative research (PICS 2015-2017)Appendix A Isolated tetramer
The Hamiltonian of an isolated tetramer with interactions and is
| (12) |
The system has two singlets ( 0), three triplets ( 1) and one quintuplet ( 2) eigenstates whose energies are Hase1997 :
| (13) |
| (14) |
| (15) |
| (16) |
| (17) |
| (18) |
With antiferromagnetic (positive) interactions, at zero magnetic field, the ground state is the singlet. With and applied magnetic field at zero temperature a first jump in the magnetization arises when the component of the lowest energy triplet becomes the ground state at :
| (19) |
and a second jump when the component of the quintuplet crosses the energy of the triplet :
| (20) |
Appendix B Density matrix renormalization group calculations
As described in the text, the geometry of the problem was mapped onto a system of spins at the vertices of a square lattice. Antiferromagnetic Néel order is compatible with the calculated exchange interactions as can be seen in Fig. 11 where the magnetic order is represented in the topologically equivalent lattice and magnetic unit cell used for DMRG calculations. The blue and red circles represent opposite projections of the magnetic moment along . There is no frustration when the three leading magnetic interactions between the NIT-2Py molecules (black), (red), and (magenta) are all antiferromagnetic. This magnetic order corresponds to a 4 2 superstructure with respect to the underlying square lattice. It would appear as peak at in the spin structure factor.
DMRG simulations were performed on cylinders of different aspect ratios. We found very small entanglement and finite-size effects due to the weak coupling between the tetramers. Figures 12(a) and (b) shows the convergence of the ground state energy with the number of states for a system of size .
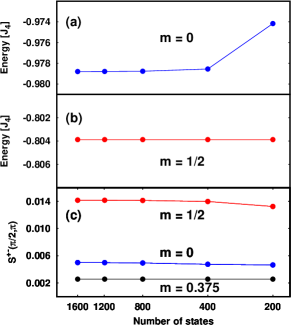
For four significant figures in the ground-state energy are achieved with moderate effort while for seven significant digits can be obtained with just states. This can be attributed to the weak entanglement in these gaped phases. Results in the manuscript where obtained with six to seven significant figures for a lattice size of containing 256 spins. Typical runs involved 1000 states for the phase and up to 2400 states in the other cases.
The dependence of the off-diagonal structure factor on the number of DMRG states is shown in Figure 12(c). The estimated error with is in the third significant digit, while for magnetization the results are fully converged.
References
- (1) T. Matsubara and H. Matsuda, Prog. Theor. Phys. 16, 569 (1956).
- (2) V. Zapf, M. Jaime, and C. D. Batista, Rev. Mod. Phys. 86, 563 (2014).
- (3) T. Giamarchi, C. Rüegg, and O. Tchernyshyov, Nature Physics 4, 198 (2008).
- (4) R. Coldea, D. A. Tennant, K. Habicht, P. Smeibidl, C. Wolters, and Z. Tylczynski, Phys. Rev. Lett. 88, 137203 (2002).
- (5) T. Radu, H. Wilhelm, V. Yushankhai, D. Kovrizhin, R. Coldea, Z. Tylczynski, T. Lühmann, and F. Steglich, Phys. Rev. Lett. 95, 127202 (2005).
- (6) S. E. Sebastian, V. S. Zapf, N. Harrison, C. D. Batista, P. A. Sharma, M. Jaime, I. R. Fisher, and A. Lacerda, Phys. Rev. Lett. 96, 189703 (2006).
- (7) E. C. Samulon, Y. J. Jo, P. Sengupta, C. D. Batista, M. Jaime, L. Balicas, and I. R. Fisher, Phys. Rev. B 77, 214441 (2008).
- (8) E. C. Samulon, Y. Kohama, R. D. McDonald, M. C. Shapiro, K. A. Al-Hassanieh, C. D. Batista, M. Jaime, and I. R. Fisher, Phys. Rev. Lett. 103, 047202 (2009).
- (9) H. Tsujii, B. Andraka, M. Uchida, H. Tanaka, and Y. Takano, Phys. Rev. B 72, 214434 (2005).
- (10) Y. Hosokoshi, Y. Nakazawa, K. Inoue, K. Takizawa, H. Nakano, M. Takahashi, and T. Goto, Phys. Rev. B 60, 12924 (1999).
- (11) I. G. Bostrem, V. E. Sinitsyn, A. S. Ovchinnikov, Y. Hosokoshi, and K. Inoue, J. Phys. Cond. Matt. 22, 036001 (2010).
- (12) M. Hase, M. Kohno, H. Kitazawa, O. Suzuki, K. Ozawa, G. Kido, M. Imai, and X. Hu, Phys. Rev. B 72, 172412 (2005).
- (13) M. Hase, A. Dönni, V. Y. Pomjakushin, L. Keller, F. Gozzo, A. Cervellino, and M. Kohno, Phys. Rev. B 80, 104405 (2009).
- (14) M. Hase, K. Nakajima, S. Ohira-Kawamura, Y. Kawakita, T. Kikuchi, and M. Matsumoto, Phys. Rev. B 92, 184412 (2015).
- (15) O. Janson, I. Rousochatzakis, A. A. Tsirlin, J. Richter, Yu. Skourski, and H. Rosner, Phys. Rev. B 85, 064404 (2012).
- (16) M. Hase, M. Matsumoto, A. Matsuo, and K. Kindo, Phys. Rev. B 94, 174421 (2016).
- (17) I. Zivkovic, D. M. Djokic, M. Herak, D. Pajic, K. Prsa, P. Pattison, D. Dominko, Z. Mickovic, D. Cincic, L. Forro, H. Berger, and H. M. Ronnow, Phys. Rev. B 86, 054405 (2012).
- (18) V. Barone, A. Grand, D. Luneau, P. Rey, C. Minichino, and R. Subra, New Journal of Chemistry 17, 545 (1993).
- (19) J. H. Osiecki and E. F. Ullman, J. Am. Chem. Soc. 90, 1078 (1968).
- (20) E. F. Ullman, L. Call, and J. H. Osiecki, J. Org. Chem. 35, 3623 (1970).
- (21) C. F. Miclea, “Investigation of superconducting order parameters in heavy-fermion and low-dimensional metallic systems under pressure”, PhD, School Technische Universität Dresden, (2005).
- (22) G. A. Bain and J. F. Berry, J. Chem. Educ. 85, 532 (2008).
- (23) D.-X. Chen, J. A. Brug, and R. B. Goldfarb, IEEE Transactions on Magnetics 27, 3601 (1991).
- (24) K. C. Rule, A. U. B. Wolter, S. Süllow, D. A. Tennant, A. Brühl, S. Köhler, B. Wolf, M. Lang, and J. Schreuer, Phys. Rev. Lett. 100, 117202 (2008).
- (25) F. Aimo, S. Krämer, M. Klanjšek, M. Horvatić, C. Berthier, and H. Kikuchi, Phys. Rev. Lett. 102, 127205 (2009).
- (26) S. E. Sebastian, P. A. Sharma, M. Jaime, N. Harrison, V. Correa, L. Balicas, N. Kawashima, C. D. Batista, and I. R. Fisher, Phys. Rev. B 72, 100404(R) (2005).
- (27) I. Affleck, Physical Review B 43, 3215 (1991).
- (28) T. Giamarchi, and A. M. Tsvelik, Physical Review B 59, 11398 (1999).
- (29) T. Nikuni, M. Oshikawa, A. Oosawa, and H. Tanaka, Phys. Rev. Lett. 84, 5868 (2000).
- (30) N. Toyota, M. Lang, J. Müller, Low-Dimensional Molecular Metals, (Springer, Berlin 2007).
- (31) A. Saúl and G. Radtke, Phys. Rev. Lett. 106, 177203 (2011).
- (32) G. Radtke, A. Saúl, H. A. Dabkowska, G. M. Luke, and G. A. Botton, Phys. Rev. Lett. 105, 036401 (2010).
- (33) A. Saúl and G. Radtke, Phys. Rev. B 89, 104414 (2014).
- (34) A. Zheludev, E. Ressouche, J. Schweizer, P. Turek, M. Wan, and H. Wang, J. Magn. Magn. Mater. 140-144, 1441 (1995).
- (35) C. Hirel, D. Luneau, J. Pécaut, L. Ohrström, G. Bussière, and C. Reber, Chemistry (Weinheim an der Bergstrasse, Germany) 8, 3157 (2002).
- (36) P. Giannozzi, S. Baroni, N. Bonini, M. Calandra, R. Car, C. Cavazzoni, D. Ceresoli, G. L. Chiarotti, M. Cococcioni, I. Dabo, A. Dal Corso, S. de Gironcoli, S. Fabris, G. Fratesi, R. Gebauer, U. Gerstmann, C. Gougoussis, A. Kokalj, M. Lazzeri, L. Martin-Samos, N. Marzari, F. Mauri, R. Mazzarello, S. Paolini, A. Pasquarello, L. Paulatto, C. Sbraccia, S. Scandolo, G. Sclauzero, A. P. Seitsonen, A. Smogunov, P. Umari, and R. M. Wentzcovitch, J. Phys. Cond. Matt. 21, 395502 (2009).
- (37) J. P. Perdew, K. Burke, and M. Ernzerhof, Phys. Rev. Lett. 77, 3865 (1996).
- (38) H. J. Monkhorst and J. D. Pack, Phys. Rev. B 13, 5188 (1976).
- (39) H. Xiang, C. Lee, H.-J. Koo, X. Gong, and M.-H. Whangbo, J. Chem. Soc. Dalton Trans. 42, 823 (2013).
- (40) V. V. Mazurenko, M. V. Valentyuk, R. Stern, and A. A. Tsirlin, Phys. Rev. Lett. 112, 107202 (2014).
- (41) S. R. White, Phys. Rev. Lett. 69, 2863 (1992).
- (42) S. R. White, Phys. Rev. B 48, 10345 (1993).
- (43) M. Jaime, R. Daou, S. A. Crooker, F. Weickert, A. Uchida, A. E. Feiguin, C. D. Batista, H. A. Dabkowska, and B. D. Gaulin, Proc. Natl. Acad. Sci. U. S. A. 109, 12404 (2012).
- (44) S. Haravifard, D. Graf, A. E. Feiguin, C. D. Batista, J. C. Lang, D. M. Silevitch, G. Srajer, B. D. Gaulin, H. A. Dabkowska, and T. F. Rosenbaum, Nat. Commun. 7, 11956 (2016).
- (45) Y. H. Matsuda, N. Abe, S. Takeyama, H. Kageyama, P. Corboz, A. Honecker, S. R. Manmana, G. R. Foltin, K. P. Schmidt, and F. Mila, Phys. Rev. Lett. 111, 137204 (2013).
- (46) H. Tanaka, A. Oosawa, T. Kato, H. Uekusa, Y. Ohashi, K. Kakurai, and A. Hoser, J. Phys. Soc. Jpn 70, 939 (2001).
- (47) C. Rüegg, N. Cavadini, M. Petrology, a. Furrer, Y. Ablation, H.-U. Güdel, K. J. Mineralogy, K. Krämer, H. Mutka, a. Wildes, K. Habicht, and P. Vorderwisch, Nature 423, 62 (2003).
- (48) M. Hase, K. M. S. Etheredge, S.-J.Hwu, K. Hirota, and G. Shirane, Phys. Rev. B 56, 3231 (1997).