Seeing Red in NGC 1978, NGC 55, and NGC 3109 11affiliation: Based on observations obtained at the Gemini Observatory, which is operated by the Association of Universities for Research in Astronomy, Inc., under a cooperative agreement with the NSF on behalf of the Gemini partnership: the National Science Foundation (United States), the National Research Council (Canada), CONICYT (Chile), Ministério da Ciência, Tecnologia e Inovação (Brazil) and Ministerio de Ciencia, Tecnología e Innovación Productiva (Argentina). 22affiliation: This research has made use of the NASA/IPAC Infrared Science Archive, which is operated by the Jet Propulsion Laboratory, California Institute of Technology, under contract with the National Aeronautics and Space Administration.
Abstract
Spectra of the intermediate age star cluster NGC 1978 and the dwarf irregular galaxies NGC 55 and NGC 3109 are discussed. The spectra were recorded with the Gemini Multi-Object Spectrograph on Gemini South and span the 0.7 to m wavelength interval. Five slit pointings were observed in NGC 1978, and these are used to examine stochastic effects on the integrated red light from an intermediate age cluster. The removal of either the brightest M giant or the brightest C star from the co-added spectrum has minor affects on the equivalent withs of the Ca triplet. The most robust signature of C stars in the integrated cluster spectrum at these wavelengths is the CN band head near 7900Å. The equivalent widths of Ca triplet lines in the NGC 1978 spectrum and in the spectra of individual cluster stars are larger than expected for a scaled-solar abundance system. It is suggested that these stars have a lower than expected surface gravity, which might occur if the stars in NGC 1978 have been subject to extra mixing processes, as suggested by Lederer et al. (2009, A&A, 502, 93). The near-infrared color profile of NGC 1978 is shown to contain a prominent red cusp in the central 10 arcsec, and the suppression of light from this cusp does not affect the depth of the Ca lines in the integrated spectrum. The NGC 55 spectra run parallel to the major axis, and a gradient is found in the strength of the Ca lines, in the sense that the Ca lines weaken with increasing distance from the disk plane. Comparisons with models suggest that the disk light is dominated by stars with ages Gyr, in agreement with star-forming histories (SFHs) obtained from the analysis of CMDs. The NGC 55 spectra also sample a large star-forming complex. The age of this complex inferred from comparisons with models is broadly consistent with that estimated from a near-infrared CMD of the same region. The CN band head at 7900Å in this part of NGC 55 is detected, but this a signature of red supergiants (RSGs) rather than C stars. The NGC 3109 observations sample three different parts of that galaxy but have a low signal-to-noise ratio. Comparisons with models suggest that the light from the NGC 3109 disk at red wavelengths is dominated by RSGs with ages of at most a few tens of Myr, in qualitative agreement with SFHs that are based on photometric measurements.
Subject headings:
galaxies: individual (NGC 55 and NGC 3109) – globular clusters: individual (NGC 1978) – galaxies: stellar content1. INTRODUCTION
The stellar contents of distant galaxies and the crowded central regions of the nearest galaxies can only be investigated through studies of their integrated light. Spectroscopic studies of integrated light at rest frame blue and visible wavelengths are of prime importance for such efforts, as there are well-calibrated features at these wavelengths that probe chemical content and age (e.g. Worthey 1994). However, information that is important for understanding stellar content is also present at other wavelengths.
Highly evolved stars in intermediate age and old systems emit much of their light at red/near-infrared (NIR) wavelengths, allowing these objects to be observed efficiently at wavelengths (1) that are less prone to extinction than objects where the light output peaks at shorter wavelengths, and (2) where corrections for distortions to the incident wavefronts can produce a significant improvement in image quality. Studies of integrated light at red/NIR wavelengths also facilitates searches for spectroscopic signatures of C stars. The detection of C stars in integrated light is of interest as these objects probe epochs that bridge the most recent and earliest episodes of star formation. Model spectra generated by Maraston (1998; 2005) and for the Bag of Stellar Tricks and Isochrones (Cordier et al. 2007) show that prominent spectroscopic signatures of C stars might be expected in the spectra of stellar systems that span a range of ages and metallicities. CN bands from C stars have been detected in the NIR spectrum of the star cluster W3 in NGC 7252 (Mouhcine et al. 2002). The Ballick-Ramsey C2 band head near m has been detected in the NIR spectrum of the dwarf lenticular galaxy NGC 5102 (Miner et al. 2011) and the nearby elliptical galaxy Maffei 1 (Davidge et al. 2015). A tentative detection of the C2 band head near 1.76m has also been made in the central regions of the starburst galaxy NGC 253 by Davidge (2016), hinting at elevated levels of star-forming activity near the center of that galaxy for at least a few hundred Myr.
Are the stellar contents inferred from the analysis of integrated light consistent with those found from the analysis of CMDs? By necessity, answering this question involves studies that are restricted to nearby star clusters and galaxies, typically focusing on systems with moderately high surface brightnesses (e.g. Davidge & Jensen 2007). In the present study, long slit spectra recorded with the Gemini Multi-Object Spectrograph (GMOS) on Gemini South are used to investigate the red spectroscopic characteristics of the intermediate age star cluster NGC 1978 in the LMC and the dwarf irregular galaxies NGC 55 and NGC 3109. While the comparatively low surface brightnesses of NGC 55 and NGC 3109 present observational challenges for studying their integrated light, the surface brightnesses are such that stars with a range of intrinsic brightnesses can be resolved to construct CMDs.
The GMOS spectra cover the wavelength interval m. The spectra thus sample wavelengths where the molecular bands that are spectroscopic signatures of cool, highly evolved stars are evident. The lines of the NIR Ca triplet, which are prominent features in the spectra of late-type stars and are sensitive to surface gravity and metallicity (e.g. Jones et al. 1984; Armandroff & Zinn 1988, and numerous subsequent studies) also fall in this wavelength range, as do numerous transitions of the Paschen series of Hydrogen.
NGC 1978 is an intermediate age cluster in the LMC that was selected for study because of its metallicity and age. With [Fe/H] (Ferraro et al. 2006) NGC 1978 has a metallicity that is comparable to that found in young stars in NGC 55 (see below). Mucciarelli et al. (2007) determine an age of Gyr from a deep CMD, making NGC 1978 one of the oldest of the compact intermediate age clusters in the LMC. The CMD of NGC 1978 does not show the extended MSTO that is seen in the CMDs of many other intermediate age LMC clusters (Milone et al. 2009). That NGC 1978 has a clearly defined MSTO – coupled with a tiny upper limit to any star-to-star dispersion in metallicity (Ferraro et al. 2006) – suggests that it is an unambiguous example of an intermediate age simple stellar population (SSP).
Stellar systems with the same age and metallicity as NGC 1978 are expected to produce C stars (e.g. Marston 2005), although the number that might be present at any one time is subject to stochastic effects given the rapid pace of C star evolution. NGC 1978 is sufficiently massive to contain a rich population of bright red giants, some of which are C stars (e.g. Lloyd Evans 1980a). Frogel et al. (1990) discuss NIR photometry of the brightest stars in and around the cluster, including 9 confirmed or suspected C stars. Lederer et al. (2009) find that the abundance patterns in six of the C stars are not consistent with stellar evolution models.
NGC 55 is morphologically similar to the LMC and – with NGC 300 - belongs to one of the nearest ensembles of galaxies outside of the Local Group (Karachentsev et al. 2003). Castro et al. (2012), Kudritzki et al. (2016), and Patrick et al. (2017) examine the metallicity of the brightest blue and red supergiants (RSGs) in NGC 55 and find a mean metallicity that is comparable to that of the LMC. The SFH of NGC 55 has not yet been charted in detail, although broad conclusions can be drawn from extant data. The deep CMDs of multiple fields in NGC 55 presented by Dalcanton et al. (2009) reveal a bright main sequence, red and blue core helium-burning sequences and red giant branches. Together, these indicate that star formation has occured over a broad range of epochs. Davidge (1998; 2005) and Seth et al. (2005a) conclude that there has been significant star formation in NGC 55 during the past 0.1 – 0.2 Gyr. Narrow-band images examined by Graham & Lawrie (1982) and Ferguson et al. (1996) show a complex ISM that contains numerous bubbles and structures that are indicative of vigorous recent star-forming activity, much of which at present is concentrated in two large star-forming complexes. The structural complexities of the NGC 55 ISM are consistent with the large rates of mass accretion and outflow deduced for the galaxy by Kudritzki et al. (2016) from chemical evolution models.
While there is evidence of recent star formation, Davidge (2005) discusses evidence that the present-day SFR of NGC 55 is lower than that at earlier epochs. Of particular note is the large population of luminous AGB stars. NGC 55 was one of the first galaxies outside of the Local Group to be surveyed for C stars (Pritchet et al. 1987). The C star frequency is roughly an order of magnitude higher than in the LMC or SMC (e.g. Figure 4 of Battinelli & Demers 2005). Given that NGC 55 and the LMC have similar metallicities, then – if it assumed that there was continuous star-forming activity during intermediate epochs – this argues that NGC 55 had a much higher SFR during intermediate epochs than the LMC.
NGC 3109 is a Magellanic irregular galaxy that is the dominant member of a structurally ordered (Bellazzini et al. 2013) mini-group that may or may not belong to the Local Group. Other candidate members of this group are the dwarf galaxies Antlia A, Sextans A, Sextans B, and Leo P. A recent addition to the group is the dwarf galaxy Antlia B (Sand et al. 2015).
Hosek et al. (2014) discuss spectra of some of the brightest stars in NGC 3109, and find [Fe/H] dex; NGC 3109 is thus dex more metal-poor than either NGC 55 or NGC 1978. Mateo (1998) presents a schematic SFH based on early photometric studies that suggests a high SFR at early epochs, with reduced – but non-negligible – star-forming activity during subsequent epochs. A rich population of C stars is present (Demers et al. 2003), indicating that there was significant star-forming activity during intermediate epochs. The C star frequency in NGC 3109 is similar to that in NGC 55 (Battinelli & Demers 2005). As NGC 55 has a higher metallicity than NGC 3109 then NGC 55 would be expected to have a lower C star frequency if the two galaxies had identical SFHs during intermediate epochs. The similarity in C star frequencies thus suggests that (1) the SFHs of these galaxies during intermediate epochs were different, and (2) the time-averaged SFR during epochs when C stars are produced was lower in NGC 3109 than in NGC 55.
The goal of the present study is to examine the spectroscopic properties of the integrated light from all three systems. The spectra are compared with models from the EMILES compilation described by Rock et al. (2016), with the goal of finding luminosity-weighted ages, which in turn are compared with expectations from CMDs. The properties of individual stars and star clusters that are sampled with these data are also investigated.
The paper is structured as follows. A description of the observations and the procedures used to reduce the data are presented in Section 2. Stochastic variations in stellar content at red wavelengths and the influence of C stars on integrated spectra are examined with the NGC 1978 data in Section 3. The spectra of NGC 55 and NGC 3109 are the subjects of Sections 4 and 5. The SFHs of NGC 55 and NGC 3109 suggest that the integrated spectra of these galaxies should show marked differences, and these are seen. A discussion and summary of the results follows in Sections 6 and 7.
2. OBSERVATIONS & REDUCTIONS
2.1. Description of Observations: NGC 1978 and NGC 3109
Spectra of NGC 1978 and NGC 3109 were recorded with GMOS (Hook et al. 2004) on Gemini South on four nights in 2013 and 2014 as part of program GS-2012B-Q-93 (PI: Davidge). The detector in GMOS at that time was a mosaic of three EEV CCDs, each of which had a pixel format, with m square pixels. Each pixel subtended 0.073 arcsec on a side.
Light was dispersed with the R400 (m, 400 lines/mm) grating, with an RG610 filter deployed to suppress light from higher orders. The grating was rotated so that the wavelength at the center of the detector array was m. The slit width was set at 2 arcsec, and the spectral resolution of sources that uniformly fill the slit is then at the blaze wavelength.
The spectra were recorded with pixel binning during read-out. As the program was intended for poor ( arcsec) seeing conditions then a factor of four binning in the spatial direction provides reasonable sampling of point sources. This binning also does not degrade the spectral resolution.
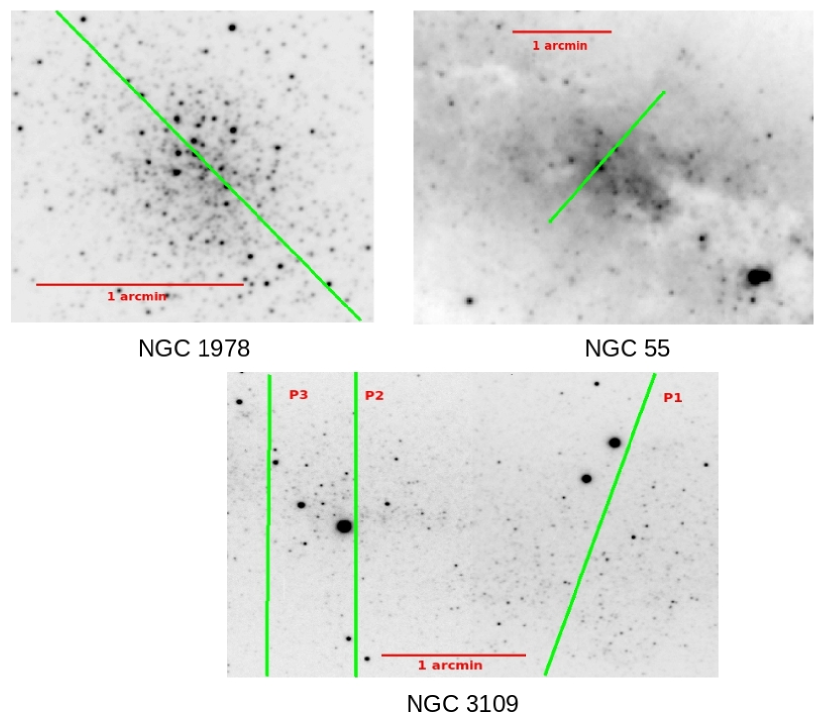
A rectangular-shaped region that runs through the center of NGC 1978 was mapped with five overlapping slit placements. The GMOS slit runs parallel to the major axis of this highly flattened (eccentricity = 0.3; Fischer et al. 1992, Mucciarelli et al. 2007) cluster. The offset between each slit position is 1.5 arcsec along the minor axis, and so an 8 arcsec wide region that parallels the major axis is mapped.
Spectra that sample three different locations were recorded of NGC 3109, with the slit more-or-less parallel to the minor axis. The slit was stepped in 1 arcsec increments between exposures. A 4 arcsec wide band is covered for two of the pointings (P1 and P2), while time limitations meant that only a 3 arcsec wide region was mapped for the third pointing (P3).
The slit placements for NGC 3019 were selected to sample structures near the major axis of the galaxy that were flagged as candidate compact intermediate age clusters based on their appearance in images at ultraviolet and mid-infrared wavelengths. Efforts to detect these objects in the current program had poor success. Therefore, the discussion of NGC 3109 is limited to the integrated spectrum and resolved stars.
The approximate mid-points of the slit placements for NGC 1978 and NGC 3109 are indicated in Figure 1. The images in Figure 1 are in the filter and were taken with GMOS for target acquisition. Additional details of the observations, including the co-ordinates of the field centers, are listed in Table 1.
| Target | RAaaSlit center. | DecaaSlit center. | Date | Exposure |
|---|---|---|---|---|
| (2000) | (2000) | (UT) | (sec) | |
| NGC 1978 | 05:28:45.2 | –66:14:11.9 | 2013–01–25 | |
| NGC 3109 (P1) | 10:03:10.9 | –26:09:42.3 | 2014–01–28 | |
| NGC 3109 (P2) | 10:03:04.4 | –26:09:42.3 | 2013–03–11 | |
| 2014–04–20 | ||||
| NGC 3109 (P3) | 10:03:02.1 | –26:09:39.7 | 2014–01–28 | |
| NGC 55 | 00:14:53.6 | –39:11:47.9 | 2017–07-03 |
Calibration frames were recorded with the same instrumental configuration as the science observations. Off-sky calibrations consisted of bias frames, CuAr arcs, and images of dispersed light from a flat-field light source. The arc and flat-field light sources are located in the Gemini Facility Calibration Unit (‘GCAL’). Following standard Gemini observing protocol, the first two were recorded during daylight hours immediately after the nights when science data were recorded. The flat field frames were interlaced with the on-sky observations. On-sky calibrations consisted of spectra of early-type stars that were observed to monitor telluric absorption features and system throughput.
2.2. Description of Observations: NGC 55
Spectra of NGC 55 were recorded with GMOS on Gemini South during the night of July 4, 2017 as part of program GS-2017A-Q-98 (PI: Davidge). The detector was a mosaic of three Hamamatsu CCDs, which replaced the EEV CCDs that were used for the NGC 1978 and NGC 3109 observations. Each Hamamatsu CCD has a pixel format, with m square pixels.
Hardy et al. (2012) describe the characteristics of the Hamamatsu CCDs. These devices have high quantum efficiencies over a broad wavelength range, with quantum efficiencies exceeding 80% between 0.55 and m. The Hamamatsu CCDs deliver almost an order of magnitude gain in quantum efficiency at m when compared with their EEV predecessors ( for the Hamamatsu CCDs versus for the EEVs) 111http://www.gemini.edu/sciops/instruments/gmos/imaging/detector-array/gmosn-array-hamamatsu.
The slit was oriented to parallel the minor axis of NGC 55 and pass through the area observed by Davidge (2005) in and . The location of the slit is shown in Figure 1. Details of the NGC 55 observations are summarized in Table 1.
The use of a different detector aside, the configuration of GMOS for the NGC 55 observations followed that described in Section 2.1. The spectra were recorded with pixel binning during read-out, with the light dispersed by the R400 grating. A 2 arcsec wide slit was used, with an OG515 filter deployed to suppress signal from higher orders. A series of calibration exposures that parallel those obtained for NGC 1978 and NGC 3109 were also recorded.
There are three departures from the observing procedures described in Section 2.1. First, the NGC 55 spectra were recorded in pairs having central wavelengths of 0.82 and m. Spectra recorded with two central wavelengths make it possible to fill the gaps between the detector arrays during processing. Second, the telescope pointing was not offset perpendicular to the slit between exposures, and so only a 2 arcsec wide band through NGC 55 is sampled. Finally, the NGC 55 spectra were recorded with the major axis of the galaxy offset between two locations along the slit to facilitate the suppression of sky lines. While this has proven to be an effective means of suppressing strong telluric emission lines in the NIR, the final spectra do not sample the entire 5.5 arcmin length of the GMOS slit, but instead are restricted to arcsec.
2.3. Reduction of Observations and Extraction of Spectra
The data were processed using standard reduction procedures for long-slit spectra. To begin, the output from all CCDs was multiplied by their gain values. A master bias frame for each day was constructed by median-combining individual bias frames. These were subtracted from the science exposures, after which overscan regions were trimmed from all frames. Cosmetic defects were suppressed by interpolating between pixels. Cosmic rays were identified using an edge detection algorithm, with interpolation used to fill affected areas.
The next step was to remove pixel-to-pixel differences in sensitivity and correct for non-uniform throughput along the slit (‘flat-fielding’). The flat-field frames recorded for each set of observations were processed using the steps described in the preceeding paragraph and the results were scaled to produce a mean signal of unity. The flat-field correction was applied by dividing the bias-subtracted and cosmetically-cleaned science data by the processed flats.
Geometric distortions were removed from the flat-fielded data using a reference grid that was defined by tracking emission lines in the CuAr spectra. The sky was then removed from the distortion-corrected images. For NGC 1978 and NGC 3109 the mean background level was measured near the ends of the slit, and this was subtracted from the two-dimensional spectra on a row-by-row basis. As NGC 55 was observed with the galaxy positioned at two different locations on the slit, background subtraction was achieved simply by subtracting successive observations in which the galaxy was offset along the slit. These difference frames contain positive and negative background-subtracted versions of the NGC 55 spectrum. The spatial intervals along the slit where the two spectra did not overlap were extracted. The negative spectrum was aligned with the positive version, and subtracted from the positive spectrum to produce a summed spectrum. There are two such summed pairs for NGC 55, and these were averaged together.
Spectra of the main bodies of NGC 1978 and NGC 3109 were obtained by combining the signal within the FWHM of light profiles that were constructed by collapsing the signal along the dispersion axis between 0.7 and 0.9m. While the S/N ratio of the NGC 3109 spectra are too low to allow spectra that sample different spatial intervals from the major axis to be extracted, this was not the case for NGC 55. Spectra of NGC 55 were extracted by combining signal within three angular intervals from the major axis, using the light profile obtained by co-adding signal between 0.7 and m as a guide.
Spectra of individual stars were extracted from the NGC 1978 and NGC 3109 observations – this was not possible for NGC 55 given the distance to this galaxy, which complicates efforts to detect individual stars. Some stars in the NGC 1978 and NGC 3109 spectra are obvious blends, and spectra were only extracted when contaminating objects were at least a factor of two fainter than the dominant star. The extracted spectra contain contributions from both the star and unresolved light from the main body of the host. The latter was removed by averaging signal on either side of each target to construct a local sky spectrum and then subtracting the result from the stellar spectrum.
Extracted spectra were wavelength calibrated using a dispersion solution obtained from the CuAr arcs. The wavelength response of the spectra at this stage of the processing contains contributions from the flat-field lamp, the instrument and telescope optics, the atmosphere, and the source itself. The first three were removed by dividing the extracted spectra by spectra of the telluric standard stars. The telluric star spectra used in this step had been processed using the sequence described above, and then scaled to a mean flux of unity. The telluric star observed for the NGC 1978 and NGC 3109 observations – LTT 3864 – has an F spectral-type. Weak absorption lines from the Ca triplet are present in its spectrum and these were removed by fitting Vogt functions to the appropriate wavelength intervals and subtracting the fitted profiles from the original spectrum. The O subdwarf Fiege 110 served as the telluric reference star for NGC 55, and absorption features are negigible in the spectrum of that star.
Division by the spectrum of a telluric standard simplifies the wavelength response, leaving a response that is normalized to the spectral-energy distribution (SED) of the telluric star. Given that the telluric standards have a spectrum that is free of strong absorption features then this means that only smooth, gradual changes in response with wavelength are present. To remove this residual response, each spectrum was divided by a low-order continuum function that was fit to that spectrum. Restricting the fitting function to a low order reduces the possibility that molecular absorption bands and deep atomic features will skew the continuum location. The final step was to shift the continuum-corrected spectra into the rest frame. It is these continuum and Doppler-corrected spectra that are discussed in this paper.
3. RESULTS: NGC 1978
3.1. Stellar Spectra
A large fraction of the red and NIR light from intermediate age star clusters originates from highly evolved stars, and so the properties of these objects play a significant role in defining the SEDs of their host systems. Therefore, the spectra of stars that were extracted from the NGC 1978 observations are examined before considering the integrated spectrum of NGC 1978. While the stellar spectra have a low wavelength resolution and only limited information can be gleaned from them individually, when considered in concert they are valueable aids for interpreting the light from NGC 1978. Emphasis is placed on two aspects of these stars: (1) preliminary spectral-types, based largely on the depths of molecular features and NIR colors, and (2) the depths of the Ca triplet absorption lines.
3.1.1 Spectral Types
The high stellar density in NGC 1978 limits the sample of objects for which spectra can be extracted to the brightest cluster members and bright field stars (i.e. members of the LMC that do not belong to NGC 1978, as well as foreground Galactic stars). The spectra of the brightest stars in the area sampled by GMOS are shown in Figure 2, where the stars are ordered according to the depth of TiO and CN absorption near m. With one exception – the most luminous star in the cluster (bottom spectrum in Figure 2) – the stars in Figure 2 have brightnesses that are within a factor of 2 of each other near m, as gauged from the signal in the spectra near this wavelength.
All of these stars are in the 2MASS Point Source Catalog (Skrutskie et al. 2006), and the 2MASS identifications and NIR brightnesses and colors are listed in the top part of Table 2. As in Figure 2, these stars are ordered according to the depth of TiO/CN absorption near m. Highly evolved stars can be photometric variables, and the photometry in Table 2 is based on only a single epoch. Still, it is apparent that the ordering based on depth of the TiO and CN absorption near m correlates roughly with brightness, in the sense that the faintest stars have the weakest band heads.
Radial velocities are listed in the last column of Table 2. These were measured by cross-correlating with stars from the Cenarro et al. (2001) database. These velocities should be considered as preliminary only, due to the relatively low spectral resolution of the GMOS data and the potential for errors arising from non-uniform illumination of the slit (‘guiding errors’). In addition, radial velocity standards were not observed as part of this program. The estimated uncertainties in the velocities are km sec-1. A radial velocity was not measured for 2MASS05284449–6614039 as there was not a suitable template for cross correlation. Excluding 2MASS05283756–6613040, the mean of the radial velocities in Table 2 is km sec-1, where the uncertainty is the standard error of the mean. The mean velocity agrees with other measurements of the LMC velocity (e.g Richter et al. 1987) and the NGC 1978 velocity found by Fischer et al. (1992).

| 2MASS # aaThe stars in the upper part of the table belong to the bright sample, and are ordered according to the depth of the TiO/CN band head near m, from weakest to strongest. The stars in the lower part belong to the faint sample, and are ordered according to magnitude, from faintest to brightest. | CaT | Spectral | Radial Velocity bbEstimated uncertainties are km sec-1. | |||
|---|---|---|---|---|---|---|
| (Å) | Type | (km sec-1 | ||||
| 05284594–6614138 | 12.523 | 0.888 | 0.218 | 10.37 | KIII | 340 |
| 05284595–6614194 | 12.479 | 1.071 | 0.228 | 10.82 | KIII | 250 |
| 05284199–6613457 | 12.498 | 1.034 | 0.159 | 10.08 | KIII | 360 |
| 05283756–6613040 | 13.324 | 0.776 | 0.154 | 5.83 | K/M V | 20 |
| 05284444–6613599 | 11.802 | 1.115 | 0.278 | 9.91 | MIII | 230 |
| 05284847–6614387 | 11.916 | 1.102 | 0.246 | 9.99 | MIII | 240 |
| 05284364–6613530 | 11.387 | 1.140 | 0.255 | 11.71 | MIII | 220 |
| 05284372–6614037 | 11.199 | 1.148 | 0.290 | 11.00 | MIII | 290 |
| 05284449–6614039 | 9.676 | 1.814 | 0.667 | 6.33 | C | – |
| 05284934–6614486 | 14.981 | 0.862 | 0.168 | 10.14 | KIII | 240 |
| 05284668–6614262 | 14.877 | 0.571 | 0.024 | 7.54 | GIII? | 260 |
| 05283704–6612590 | 14.368 | 1.056 | 0.265 | 10.29 | KIII | 320 |
| 05285300–6615148 | 13.632 | 0.865 | 0.073 | 10.05 | KIII | 270 |
| 05284317–6613564 | 13.452 | 1.001 | 0.314 | 11.08 | KIII | 280 |
| 05284570–6614084 | 13.030 | 0.759 | 0.175 | 12.02 | KIII | 290 |
Six of the spectra in Figure 2 have prominent TiO band heads at 7100Å and deep Ca triplet lines. Stars with spectral-type M0III have (Bessell & Brett 1988), which corresponds to in the 2MASS photometric system (Carpenter 2001). Based on the depths of the TiO band heads, coupled with the colors in Table 2, and assuming that for the LMC, then many of the stars in Figure 2 are probably early M giants. Based on the depth of the TiO bands and color, 2MASS05284372–6614037 has the latest spectral-type of the M giants.
Not all of the stars in Figure 2 are M giants and – based on the depth of the TiO bands and colors – three are likely K giants. It is also evident that the TiO m band heads in the spectra of 2MASS05284199–6613457 and 2MASS05283756–6613040 have similar depths, but that the Ca triplet lines in the spectrum of the latter are noticeably weaker than in the former. 2MASS05283756–6613040 also has a bluer J–K color than 2MASS05284199–6613457, and is arcsec from the cluster center, placing it well outside the main body of the cluster. Perhaps most significantly, it has a radial velocity that is not consistent with membership in the LMC. 2MASS05283756–6613040 is thus a Galactic field star.
2MASS05284449–6614039 is star # 3 in the numbering scheme of Lloyd Evans (1980b) and star 7 in the Frogel et al. (1990) compilation of NIR photometry of bright stars in NGC 1978. In contrast to all of the other bright stars, the spectrum of this star is dominated by the CN bands that are prominent signatures of a C star. The CN band head near 7900Å , which is clearly seen in the 2MASS05284449-6614039 spectrum, is the feature that serves as the identifier for C stars in the narrow-band photometric systems described by Richer et al. (1984) and Cook et al. (1986). In Section 3.2 it is shown that this band head also serves as a marker for C stars in integrated light.
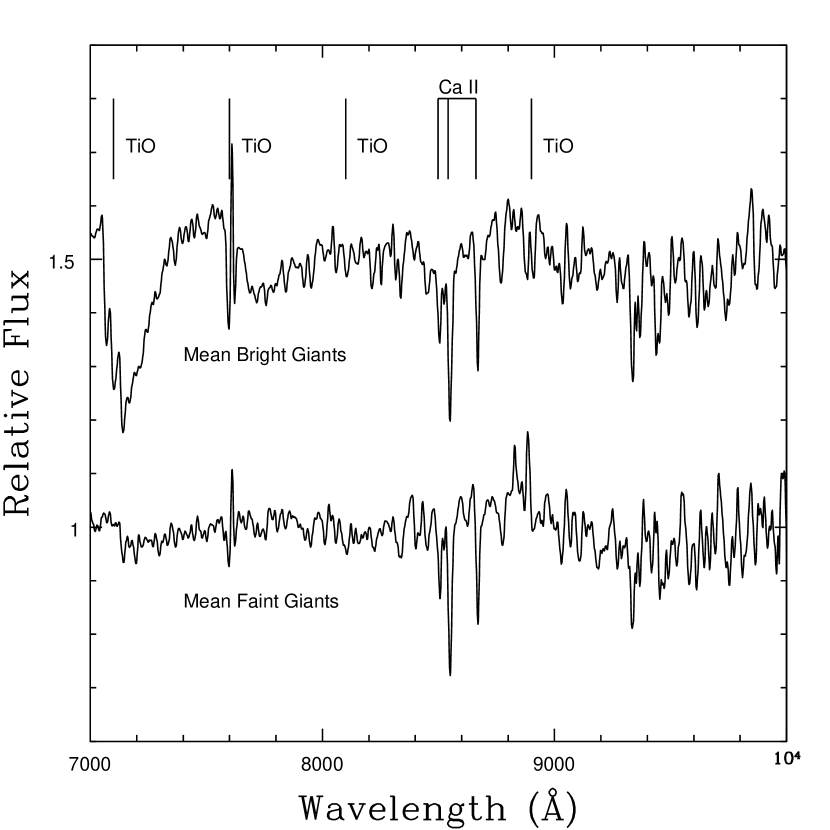
Spectra were also extracted for a modest sample of stars that were selected to be up to magnitudes fainter than the brightest stars. Magnitudes were determined from the mean signal near 8000Å, which serves as an approximate proxy for band magnitudes, in which stars near the RGB-tip show little sensitivity to metallicity. Stars in this second sample were restricted to those that have their peak signal in one of the three central slit positions so that all of their light is captured – light from stars with peak signal in the two outermost pointings may fall outside of the area observed with GMOS depending on the placement of the star in the slit. All of the stars in this second sample are in the 2MASS PSC, and the 2MASS names and NIR photometry for these sources are listed in the bottom part of Table 2. The spectra of stars in this sample have a lower S/N ratio than those shown in Figure 3, complicating efforts to measure the depths of the TiO and CN features near m in individual spectra. However, there is a rough correlation between magnitude and the depth of the m TiO band head amongst the brightest stars listed in the top part of Table 2, and so the fainter stars listed in the lower part of Table 2 are ordered from faintest to brightest magnitude.
Based on the colors in Table 2, most of the stars in the fainter sample are expected to be K giants, and this is borne out by the mean spectrum of these objects, which is shown in Figure 3. The mean spectrum of the four giants in Figure 2 that have between 11 and 12, and so are the most evolved oxygen-rich objects observed here, is also shown. There is a weak discontinuity near the m TiO band head in the mean spectrum of fainter objects in Figure 3, and no other TiO band heads are visible. The Ca triplet lines in the mean spectrum are also slightly weaker than in the mean bright giant spectrum. The mean spectrum of faint objects is thus consistent with a spectral-type earlier than that of the M giants in Figure 2.
3.1.2 CaT Indices
The lines of the Ca triplet are among the most prominent atomic features in the NIR, and are probes of stellar content in integrated light. It is thus of interest to examine if the depths of the Ca triplet lines in the NGC 1978 stellar spectra are consistent with what is expected for their spectral type and metallicity. Cenarro and collaborators have compiled an extensive library of Ca triplet measurements, and the CaT indices of stars in NGC 1978 were measured using the pass bands defined by Cenarro et al. (2001a).
The absolute calibration of line indices depends on factors such as spectral resolution, wavelength sampling, and the method used to identify the continuum. Cenarro et al. (2001a) discuss CaT indices measured from a large stellar library, and the spectra from which those indices were measured can be used to examine the effect of spectral resolution, wavelength sampling, and continuum removal on the CaT index. For the present study, two sets of stars in the Cenarro et al. (2001a) stellar library are considered: (1) K giants with [Fe/H] between –0.2 and –0.4, and (2) M giants with solar metallicity. The stars in the first group have spectral-types and metallicities that roughly match those expected for the fainter sample of giants in NGC 1978, as well as the stars in Figure 2 that have weaker TiO features. There are 6 stars in the Cenarro et al. library that match the criteria for the first set, and these have effective temperatures (Teff) between 4000 and 4400 K, and log(g) between 1.0 and 2.3. The stars in the second set have spectral-types that match the stars in Figure 2 that have deep TiO features, although it was necessary to consider objects with solar metallicity as the Cenarro et al. (2001a) library does not contain metal-poor M giants. There are four stars in the Cenarro et al. library that match the criteria of the second set, and these have Teff between 3200 and 3800 K, and log(g) between 0.2 and 1.1.
Spectra were downloaded from the Cenarro et al. (2001a) library 222http://www.iac.es/proyecto/miles/pages/stellar-libraries/cat-library.php and these were smoothed and re-sampled to match the spectral resolution and wavelength sampling of the GMOS spectra. As with the GMOS spectra, the continuum was removed by applying a low order fit. CaT indices were then measured from the smoothed/re-sampled spectra, and compared with the fiducial values. For K giants the CaT indices measured from spectra with the same resolution and sampling as the GMOS observations differ from the published values by Å, in the sense that the indices obtained from the GMOS spectra are smaller. The difference between the two sets of measurements becomes smaller yet when M giants are considered, amounting to Å. These comparisons suggest that the GMOS instrumental CaT indices are more-or-less in the standard system to within a few tenths of an Å, at least when considering K giants or early M giants. The modest sensitivity of the CaT index to spectral resolution found here is consistent with the velocity broadening experiments that are discussed in Section 4.4.2 of Cenarro et al. (2001a).
Instrumental CaT indices for all extracted stars are listed in Table 2. CaT indices in the system described by Cenarro et al. (2001a) can be found by adding 0.1Å to the instrumental indices of 2MASS05284372–6614037, 2MASS05284444–6613599, 2MASS05284364–6613530, and 2MASS05284847–6614387, as these are likely early M giants. Similarly, 0.3Å should be added to the indices of the probable mid-K giants 2MASS05284595–6614194, 2MASS05284199–6613457, and 2MASS05284594–6614138, as well as to the stars in the fainter group.
The CaT indices of bright giants in NGC 1978 appear to more appropriate for solar metallicities, even though NGC 1978 has a sub-solar metallicity. Evidence of this comes from the metallicity dependance of K4 and K5 III stars with log(g) between 1.0 and 2.0 and [Fe/H] between –0.3 and 0.3 in the Cenarro et al. (2001a) database. While there are stars with a later spectral-type in NGC 1978, the Cenarro et al. (2001a) database does not contain a large number of early M giants that span a range of metallicities – K4 to K5III are the latest spectral-types for which a moderately large number of objects (21) is available. Applying a least squares fit to the CaT and [Fe/H] values for these stars yields CaT = () Fe/H . CaT Å would then be expected for K giants with log(g) in NGC 1978, whereas for solar metallicities CaT Å. The mean CaT found here for stars in NGC 1978 is .
Random uncertainties in the CaT indices among stars in the bright sample were estimated by measuring the pointing-to-pointing scatter in the indices of stars that were observed in more than one slit position. The random uncertainty in the CaT indices of stars in the bright sample found in this manner is . For comparison, the dispersion in CaT among the four M giants is Å, with a mean instrumental CaT of 10.65Å. The dispersion in the CaT indices among the K giants in the bright group and all of the stars in the faint sample is Å, with a mean of 10.26Å. However, the CaT index for 2MASS05284668–6614262 is markedly lower than those of the other stars, and this star also has a smaller color than the others. If this star is not considered then the dispersion among suspected K giants drops to Å, with a mean instrumental CaT of 10.61Å.
Ferraro et al. (2006) measure [Fe/H] for individual stars in NGC 1978, and find values between –0.25 and –0.44, with uncertainties in individual measurements typically between dex. The dispersion in the [Fe/H] measurements is dex, and this sets an upper limit to the metallicity dispersion in the cluster. This dispersion in [Fe/H] translates to a dispersion in the CaT values of using the relation between CaT and [Fe/H] discussed in the previous paragraph. Star-to-star metallicity differences thus do not contribute significantly to the dispersion in the CaT indices. These results suggest that random uncertainties in the measurements (1) dominate the dispersions in CaT, and (2) can not explain the difference between the expected and measured mean CaT indices.
The mean CaT for the M giants is the same within the errors with the mean CaT among the suspected K giants, and this is not unexpected. The Teff values compiled in Table 5 of Cenarro et al. (2001b) indicate that the difference in Teff between mid-K giants and early M dwarfs is only a few hundred K. The relation between CaT and Teff is examined in the top panel of Figure 3 of Cenarro et al. (2002), and it is evident that CaT does not vary greatly with Teff near T (i.e. the approximate Teff of mid-K giants and M giants).
There are strong telluric emission features in the wavelength region near the Ca triplet, and uncertainties when subtracting these will leave residuals in the spectra. If sky emission lines are systematically over-subtracted then the CaT indices will be skewed to higher values. However, there is evidence that this is not happening here. If sky subtraction errors biased the CaT indices in Table 2 then there should be a trend between CaT and magnitude, in the sense of deeper CaT absorption towards fainter magnitudes if sky emission features have been over-subtracted. However, the CaT indices in Table 2 do not show such a trend. The mean CaT of suspected K giants in the bright sample () is the same as the mean CaT among the faint sample (), if the star 2MASS 05284668–6614262 – which has a low color and small CaT compared with other stars in the sample – is not included. Therefore, the larger than expected CaT indices are likely not the consequence of a systematic offset introduced by uncertainties in sky subtraction.
The larger-than-expected CaT indices in NGC 1978 are almost certainly due in part to surface gravity, as the brightest giants in NGC 1978 studied by Ferraro et al. (2006) have log(g) , and so have lower surface gravities than the giants that were used to find the relation between CaT and [Fe/H] derived earlier in this section. However, the relation between log(g) and the depth of the Ca triplet in Figure 4 of Cenarro et al. (2002) indicates that a change in log(g) of 0.5 dex changes CaT by an Å in the low surface gravity regime, and so could explain only part of the difference between the observed and expected CaT indices. We note that applying a log(g) correction of this size to the expected CaT computed using the relation found above yields a CaT index for solar metallicity stars that agrees with that measured among giants in NGC 1978. Still, the CaT index from the integrated spectrum of NGC 1978 – discussed in Section 3.2 – is also stronger (1) than predicted by models, and (2) than in the integrated spectrum of NGC 55 (Section 4.1), which has a similar metallicity and luminosity-weighted age as NGC 1978. This suggests that the high CaT indices are an intrinsic property of the cluster members. Possible causes of the strong Ca lines are discussed in Section 6.
3.2. Integrated Spectra
3.2.1 The influence of bright stars
Spectra of NGC 1978 were extracted from each slit pointing by summing light over a 40 arcsec wide interval centered on the peak of the cluster light profile. The spectrum at each pointing and the mean of these are shown in Figure 4. Pointing-to-pointing differences are evident. Large differences are associated with the CN band heads, reflecting the contribution that 2MASS05284449–6614039 makes to the light from P3 and P4, and its negigible contribution to the light from the other pointings. 2MASS05284449–6614039 accounts for almost half of the light from P3 between 0.7 and m. The comparisons in Figure 4 clearly indicate the potential that CN band heads near 7900Å and 9100Å have for identifying C stars in integrated light. There are also differences between the spectra of P1, P2, and P5. P1 and P5 each contain at least one of the bright M giants listed in Table 2, and the TiO band head at 7100Å in the integrated spectra of P1 and P5 is deeper than in the spectrum of P2.
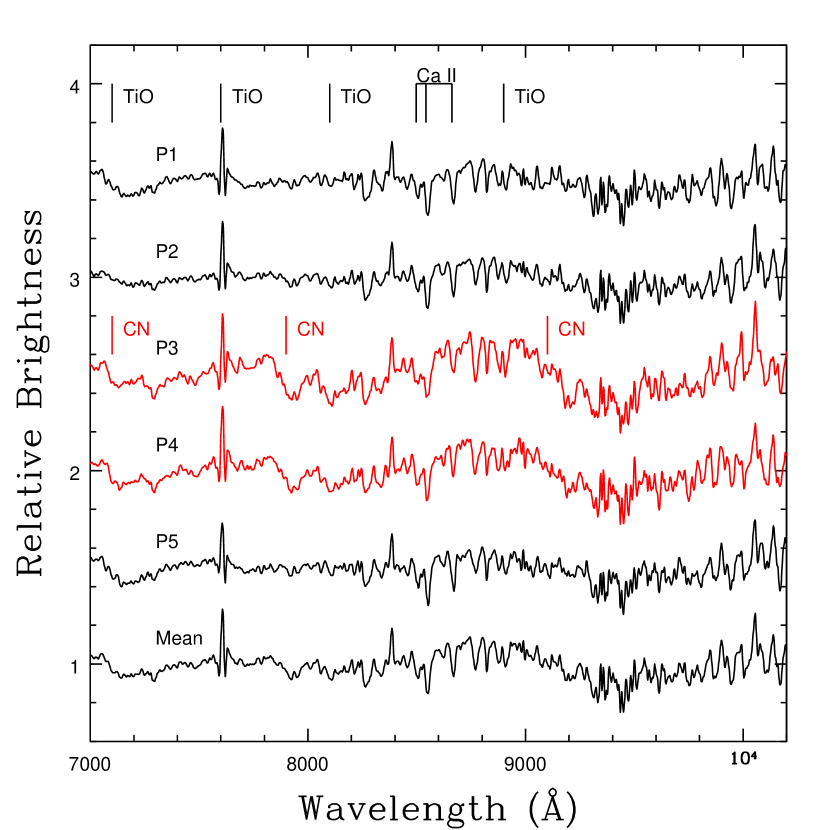
Spectra of the five pointings in a 300Å wide interval centered on the Ca triplet are compared in the left hand panel of Figure 5. The differences between the average spectrum and the individual spectra are shown in the right hand panel. Pointing-to-pointing differences on the order of a few percent are seen at wavelengths near the Ca triplet. Not surprisingly, the largest residuals occur for P3, where the C star makes the largest fractional contribution to the total light, and the residuals for this pointing between 8500 and 8600Å track CN absorption features. The comparisons in Figures 4 and 5 demonstrate that a hypothetical spectrum of NGC 1978 obtained from a single slit observation would have difficulty capturing a respresentative SED of the cluster, even if the dense central regions of the cluster are sampled.
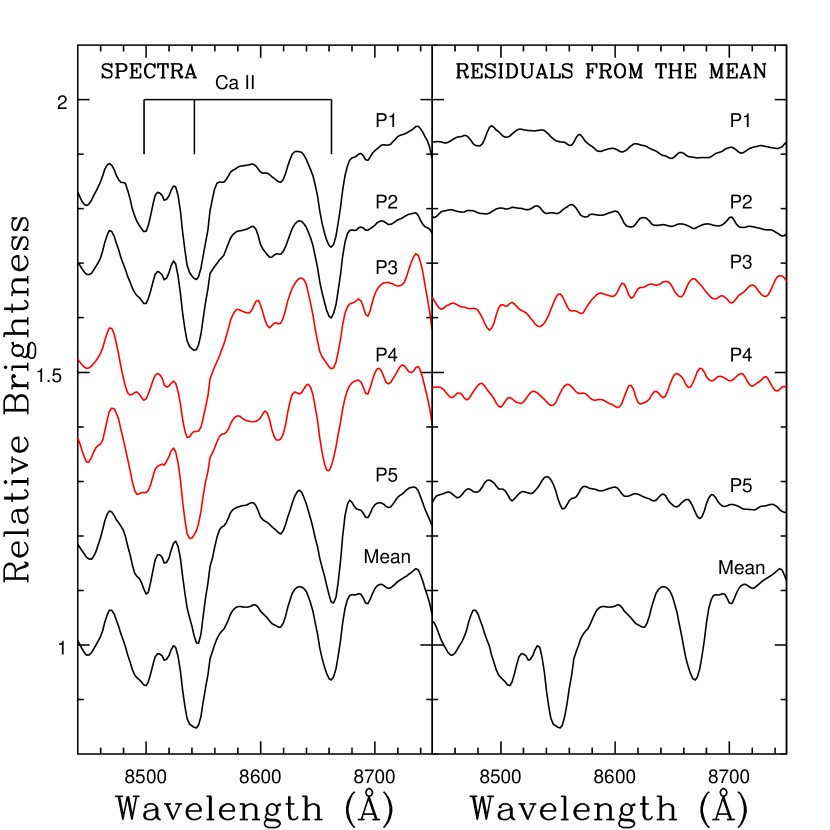
The instrumental CaT index of each pointing is listed in Table 3. Given the bright nature of NGC 1978, the uncertainties in the CaT indices in Table 3 are expected to be smaller than those estimated for individual stars in Section 3.1. A surprising result is that – despite the distinct spectroscopic characteristics of C star spectra – the sizeable contribution made by 2MASS05284449–6614039 to the integrated light does not skew the CaT indices of P3 and P4 to values that differ from those in the other pointings. Indeed, the CaT indices of P3 and P4 fall in the middle of the range listed in Table 3. The CaT index for P5, which contains the brightest M giant, is larger than that of the other four pointings, and in Figure 5 it can be seen that the Ca lines in the P5 spectrum are visually deeper than in the other pointings.
| Pointing | CaT |
|---|---|
| (Å) | |
| P1 | 8.74 |
| P2 | 8.23 |
| P3 | 8.31 |
| P4 | 8.32 |
| P5 | 9.78 |
| All P | 8.65 |
| P5 (No M star) | 9.16 |
| All P (No M star) | 8.55 |
| P3 (No C Star) | 7.96 |
| All P (No C Star) | 8.79 |
Many highly evolved intermediate age stars are long period variables, with light curve amplitudes of a magnitude or more. The integrated spectrum of a cluster might then change subtley as the light output from its brightest members varies with time, and the GMOS spectra can be used to explore this matter. The affect that variability has on the spectrum of single slit pointings was examined by removing the signal of the brightest M giant 2MASS05284364–6613530 333This star has the brightest magnitude between 0.7 and 0.9m as judged from the GMOS spectra, but does not have the brightest magnitude in Table 2. Highly evolved stars of this nature may be photometric variables, and there may also be star-to-star differences in –K color. from P5, and the signal of the C star 2MASS05284449–6614039 from P3. The CaT index was measured in the subtracted spectra, and the results are listed in Table 3. Removing 2MASS05284364–6613530 reduces the CaT index of P5 by 0.6Å, bringing it into better agreement with the CaT values measured in the other pointings. Removing 2MASS05284449–6614039 from P3 lowers the CaT index by 0.3Å.
The removal of light from individual stars will of course have a smaller impact on a composite spectrum constructed from many slit pointings, as the contribution from individual stars to the total light is diminsihed. The C star 2MASS05284449–6614039 accounts for of the total light near 8500Å from all five NGC 1978 pointings, while the M giant 2MASS05284364–6613530 accounts for of the total light. The results of subtracting 2MASS05284449–6614039 and 2MASS05284364–6613530 from the summed spectrum of all five pointings are examined in Figures 6 and 7.


Given the large fractional contribution that it makes to the NIR light – coupled with the distinct spectroscopic characteristics of C star spectra – it is not surprising that the subtraction of light from 2MASS05284449–6614039 still has a noticeable impact on the visual appearance of the mean spectrum in Figure 6, due largely to the changes wrought on the CN bands. These comparisons highlight the potential of using the 7900 and 9100Å CN band heads to probe C star content in integrated light. While there is water absorption bands between 0.9 and m that could complicate CN measurements at these wavelengths, the 7900Å band head produces a distinct Å wide feature in the spectrum.
In contrast to the CN bands, the depths of the Ca triplet, as gauged by the CaT index, does not change by a large amount. CaT indices were measured from the mean spectrum with 2MASS05284449–661403 and 2MASS05284364–6613530 removed, and the results are listed in Table 3. Removing light from 2MASS05284449–661403 changes the CaT index of the summed spectrum by , and a similar difference occurs when 2MASS05284364–6613530 is removed. These modest changes suggest that – when a large fraction of the light from a cluster is considered – the CaT index is a robust probe of the stellar content of intermediate age clusters like NGC 1978, even if C stars contribute a large fraction of the light.
3.2.2 Comparisons with models
The summed NGC 1978 spectrum is compared with model spectra of simple stellar populations (SSPs) in Figures 8 and 9. The models are from the EMILES (Rock et al. 2016) compilation, and use the evolutionary tracks of Pietrinferni et al. (2004). The models assume [M/H] with a scaled-solar chemical mix and a Chabrier (2003) mass function (MF). The model spectra were re-sampled and smoothed to match the pixel sampling and wavelength resolution of the GMOS spectra, and have had the continuum removed.


The overall appearance of the NGC 1978 spectrum is matched best by the 2 and 3 Gyr models, in agreement with the age estimated by Mucciarelli et al. (2007) from the CMD. Still, there is mixed agreement matching the depths of individual features. Absorption lines from the Paschen series of hydrogen are prominent in the 1 Gyr model, and are much weaker in the 2 and 3 Gyr models. There is no evidence of Pa absorption in the NGC 1978 spectrum, although the S/N ratio of the NGC 1978 spectrum is poor at wavelengths where the strongest Pa lines are expected. The models in Figure 8 have CN absorption at 7900Å , and the depth of this feature is weaker than observed in NGC 1978. However, the significance of this difference is low, given that only one C star is sampled in the NGC 1978 spectrum.
As for the Ca triplet lines, the agreement between the models and the NGC 1978 spectrum in Figure 9 is far from perfect, as the Ca lines in the models are shallower than in the cluster spectra. The CaT indices measured from the models are 6.4 (1 Gyr), 6.8 (2 Gyr), and 6.7Å (3 Gyr), whereas the CaT index for the composite NGC 1978 spectrum is 8.65Å. The experiments discussed in the previous section – in which the brightest M giant or C star are subtracted from the spectrum – indicate that the larger than expected CaT index in NGC 1978 is not a stochastic effect due to a single luminous star, as the removal of the brightest stars changes CaT by only 0.1Å.
One possible explanation for the difference in Ca line strengths is that the models might not reproduce the number and/or types of bright giants in NGC 1978. However, we are loath to attribute the failure to match the Ca II lines to deficiencies in the model physics. EMILES model spectra are available for the Padova00 isochrones (Girardi et al. 2000), and these differ from those constructed from the Pietrinferni et al. (2004) isochrones by only a few percent near the Ca triplet. Perhaps more importantly, in Section 4 it is shown that the model spectra reproduce the Ca lines in the spectrum of the dwarf irregular galaxy NGC 55 which – while a composite stellar system – has a characteristic age and metallicity that is similar to that of NGC 1978. This agreement also rules out deficiencies in the stellar library used to generate the model spectra. Finally, in the previous section it was shown that the Ca indices in individual NGC 1978 giants appear to be larger than expected.
An interesting test would be to compare the luminosity function of NGC 1978 with that predicted by the models. Unfortunately, we are not aware of a published catalogue of complete photometric measurements in NGC 1978 that would allow such a comparison to be made. Still, there are mechanisms that might produce an excess fraction of low surface gravity stars in the region sampled by GMOS. One such mechanism is mass segregation, in the sense that the most massive stars occur preferentially near the cluster center, which contributes much of the light to the GMOS spectrum. Mass segregation of this nature can set in naturally during the early dynamical evolution of star clusters (e.g. Spera et al. 2016).
As it turns out, the stellar content of NGC 1978 is not uniformly mixed. Evidence for this comes from and surface brightness measurements obtained from 2MASS All Sky Survey images, which were downloaded from the Interactive 2MASS Image Service 444http://irsa.ipac.caltech.edu/applications/2MASS/IM/interactive.html. Isophotal photometry was performed with the STSDAS routine , which uses the procedures described by Jedrzejewski (1987). Background sky levels were measured at large offsets from the cluster. Bright resolved stars were suppressed by smoothing the images with an arcsec median filter, although residual light from the brightest stars persists at a low level.
The and surface brightness profiles of NGC 1978 are shown in the top panel of Figure 10, while the color profile is shown in the lower panel. The radial measurements are along the major axis. A red cusp dominates the color profile within arcsec of the cluster center. The flat appearance of the cusp at small radii is an artifact of the median filter that was applied to the images. At larger radii – and ignoring the two points between 50 and 60 arcsec – there is a tendency for to drop gradually with increasing radius.
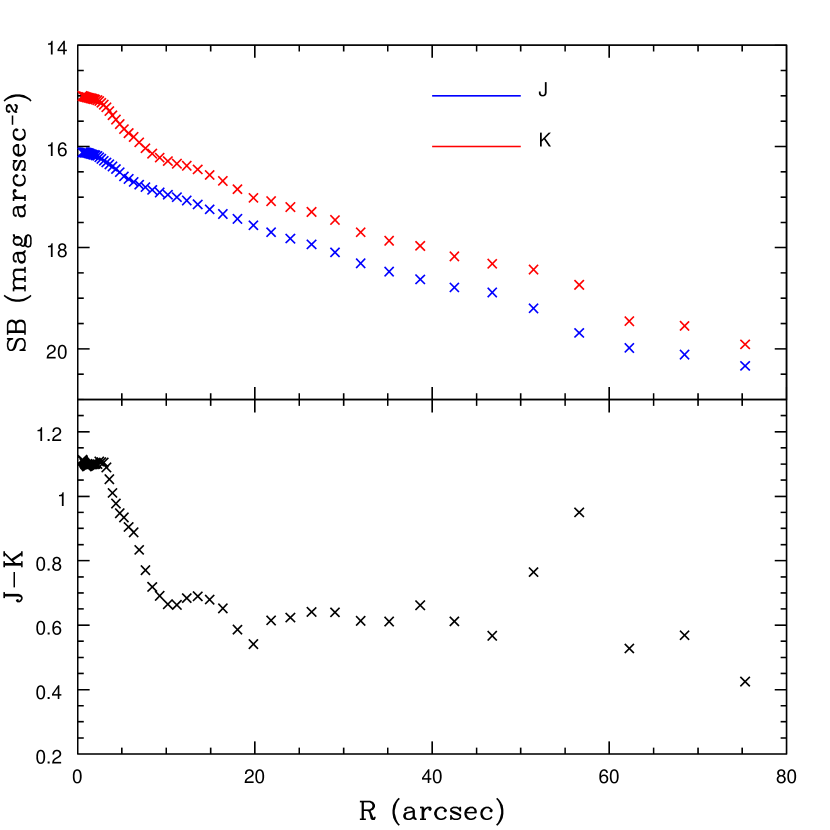
The red cusp is not due to the C star 2MASS05284449–661403, which is the dominant cluster member in the NIR. To demonstrate this, light from that star was subtracted from the 2MASS images, and was run again. The cusp remains after the C star is removed, although the central color is lowered by magnitudes.
The spectrum of NGC 1978 does not change significantly if light from the red cusp is omitted. To demonstrate this, a spectrum of NGC 1978 was constructed by excluding light within arcsec of the cluster center, and the result is shown at the bottom of Figure 9. The Ca lines in the resulting spectrum have depths that are similar to those in the spectrum based on the entire area sampled with GMOS. These results suggest that the deeper than expected Ca triplet lines in the integrated NGC 1978 spectrum are intrinsic to the cluster members, and are not due to the concentration of the brightest cluster members near the cluster center.
4. RESULTS: NGC 55
4.1. NGC 55: Integrated Spectra
4.1.1 Properties of the NGC 55 spectrum
Davidge (2005) found that the peak brightnesses of the most luminous AGB stars in NGC 55 changes with distance from the disk plane, in the sense that the peak brightness decreases with increasing extraplanar distance. The GMOS slit was oriented to be perpendicular to the major axis of NGC 55 for these observations, and so gradients in the strengths of spectral features might be expected in the GMOS spectra. Spectra that sample three angular intervals were thus extracted. One interval samples the light within arcsec of the disk plane, where the disk plane is defined as the midpoint of the light profile through the disk after collapsing the GMOS spectra along the dispersion direction between m and m. The other two intervals cover angular offsets 14–28 arcsec and 28–44 arcsec from the disk plane. Spectra extracted on each side of the major axis were averaged together. The three angular intervals sample comparable integrated magnitudes, and so the extracted spectra have similar S/N ratios. Each angular interval samples a region with M, which is comparable to the light from an intermediate age LMC cluster.
The extracted spectra are compared in Figures 11 and 12. Subtle changes with distance from the disk plane are seen in the strengths of many absorption and emission features. The Ca triplet and the TiO band head near m tend to weaken with distance from the disk plane. The CN band head at 7900Å, which is not strong but is still present in the NGC 55 spectra, may weaken with distance from the disk plane. The Paschen discontinuity near m is evident in all three spectra.


Prominent emission lines are seen in all three spectra. Large spectrum-to-spectrum variations in H and [SIII] are evident, as well as in the strengths of lower order Pa lines. The variations in emission line strengths indicate that the hot stars that are the likely source of ionizating radiation are not uniformly mixed throughout the area sampled by GMOS. This is not unexpected, as line emission in NGC 55 has a complex morphology (Ferguson et al. 1996), with bubbles and jets protruding from the disk plane. Ferguson et al. (1996) conclude that much of the H emission is associated with two kpc-scale star-forming complexes located near the center of the galaxy.
Veiling of absorption lines by continuum emission is not expected to be significant in these data. Reines et al. (2010) use Starburst99 (Leitherer et al. 1999) models to examine the contribution made by continuum emission to the total signal from SSPs. The equivalent width of H emission in NGC 55 is consistent with an age of Myr, and the nebular continuum contributes only a small fraction of the total light for such ages (Figure 8 of Reines et al. 2010). That the Ca lines show only modest changes in strength in the three intervals examined in NGC 55, despite large spectrum-to-spectrum variations in the strength of H, further suggests that veiling by continuum emission is not significant.
Cenarro et al. (2001a) define an index – PaT – that measures the depths of Paschen lines at wavelength near the Ca triplet, and this index has been measured in the NGC 55 spectra. Instrumental CaT and PaT indices for the NGC 55 spectra are listed in Table 4. The CaT index becomes smaller (i.e. decreasing equivalent widths of Ca lines) with increasing distance from the disk plane. The CaT indices in NGC 55 are more-or-less consistent with those of the [Fe/H] models discussed in Section 3.2.2. The PaT indices are modest in size, and decrease with increasing distance from the disk plane, transitioning from weak absorption to weak emission.
| Point | CaT | PaT |
|---|---|---|
| (Å) | (Å) | |
| 0 – 14 asec | 6.76 | 0.3 |
| 14 – 28 asec | 6.41 | –0.1 |
| 28 – 44 asec | 5.97 | –0.4 |
| cluster 1 | 12.21 | 2.7 |
Line emission is expected to be modest for the Paschen series transitions that are targeted by the PaT index, although the PaT indices in the outer two intervals suggest that line emission is present. Assuming Case B recombination and an electron temperature of 104 K, then emission from the n=12 and n=14 transitions that are examined by the PaT index will have intensities that are only those of H (Brocklehurst 1971). The equivalent width of H in the center spectrum is Å, and Å in the 28 – 44 arcsec spectrum. Therefore, line emission in the n=12 and n=14 lines is expected to have an equivalent width Å assuming Case B recombination. This is roughly consistent with the PaT indices measured in the 14–28 and 28–44 arcsec spectra, thereby suggesting that Pa absorption due to the n=12 and n=14 transitions is modest in these angular intervals.
4.1.2 Comparisons with NGC 1978 and model spectra
The metallicity of young stars in NGC 55 is similar to that in NGC 1978 (e.g. Ferraro et al. 2006; Patrick et al. 2017 and references therein). The integrated spectrum of NGC 1978 is compared with the NGC 55 spectra in Figure 12, and the Ca absorption lines in NGC 55 are weaker than in NGC 1978. This difference occurs even though much of the light from NGC 55 at red and NIR wavelengths originates from intermediate age stars that have an age that is not greatly different from that of NGC 1978 (see below).
The characteristic age of the NGC 55 spectrum is explored in Figures 13 and 14, where the mean NGC 55 spectrum – constructed by combining the three spectra in Figure 11 – is compared with SSP model spectra. The models use the scaled-solar abundance Pietrinferni et al. et al. (2004) isochrones. [Fe/H] has been adopted with a Chabrier MF. As in Section 3, the model spectra were processed to match the spectral resolution and sampling of the GMOS data and have had the continuum removed. The metallicity of the 10 Gyr population in Figures 13 and 14 is the same as that of the younger populations, and so a flat age-metallicity relation has been assumed.


The best overall match between the models and the observed spectra in Figures 13 and 14 is found with the 1 or 2 Gyr models. The depths of the Ca absorption lines in the NGC 55 spectrum in Figure 14 match those in the 2 and 10 Gyr models, and are deeper than in the younger models. The CaT index in the arcsec NGC 55 spectrum matches that in the 2 Gyr model. Still, the 2 and 10 Gyr models have much stronger TiO band heads at 7100 and 7600Å than are observed, suggesting that the characteristic age of NGC 55 at red wavelengths is not ‘old’. An upper limit of 2 Gyr is thus set for the characteristic age of the red spectrum of NGC 55.
A lower limit to the characteristic age of NGC 55 is set using the depths of the Paschen lines. The models with ages Gyr in Figure 14 have moderately strong Pa absorption features near 8650Å (n=14 transition) and 8750Å (n=12 transition), and these are abscent in the NGC 55 spectrum. The absence of Pa lines in Figure 14 then argues for an age Gyr. With an effective age 1 – 2 Gyr for the red/NIR light from NGC 55 then the CN band head near 7900Å may have a contribution from C stars. However, the shallow nature of this feature indicates that C stars are not present in the numbers predicted by the models.
4.1.3 Low mass main sequence stars in NGC 55
The main focus of this paper is the influence that the brightest stars in a system have on the red/NIR spectrum. However, absorption from Na I near 8190Å and FeH near 9914Å provide insights into the low mass end of the MF. The good quantum efficiency of the Hamamatsu CCDs near m makes these data particularly well-suited to search for FeH absorption. The portions of the mean NGC 55 spectrum that sample these features are shown in Figure 15. The spectrum of the M5V star Gliese 51 from Rayner et al. (2009) – smoothed to match the spectral resolution of the NGC 55 observations – is also shown, as are model spectra of 2 and 10 Gyr populations that were constructed with a Chabrier MF.

The depths of the Na I and FeH features in the models have a mild sensitivity to age among old and intermediate age systems. Na I is deeper in the 10 Gyr model, and this reflects the diminishing (but still substantial) contribution that red giants make to the red light as one moves to ages older than 2 Gyr. Na I absorption has a depth of a few percent in the models. There is no evidence for Na I absorption in the NGC 55 spectrum, although the Paschen break at 8204Å warps the local continuum, complicating the detection of faint absorption features at nearby wavelengths.
The situation may be different for FeH. The models show that FeH produces a broad absorption feature with a depth of . The shallow nature of the FeH feature in the models highlights the challenges of detecting FeH in systems that do not have a bottom-heavy MF. Still, a wide absorption feature near 9900Å is seen in the NGC 55 spectrum, the short wavelength onset of which matches that of FeH in the M5V spectrum. However, this feature is narrower in NGC 55 than in the M5V spectrum. The red part of FeH absorption in NGC 55 may be affected by emission near 9930Å, which could prevent the detection of the red edge of the FeH feature. The source of this emission is not known. Given the inability to match the full wavelength range of the absorption feature, coupled with the possible presence of emission lines that could alter the local continuum at these wavelengths, then it is premature to identify the absorption near 9900Å in the NGC 55 spectrum with FeH.
4.2. NGC 55: The Spectrum of Cluster 1
The GMOS slit passes through the star-forming complex that Davidge (2005) named cluster 1. The light profile of the part of cluster 1 that is sampled with GMOS has a FWHM arcsec at wavelengths between 0.7 and m, and a spectrum was constructed by summing the light within this angular interval. Light from the main body of NGC 55 contributes significantly to cluster 1, and so a local sky spectrum was constructed by combining signal at the points where the cluster light profile blends into the main body of the galaxy. The local sky spectrum was then subtracted from the extracted spectrum to obtain the final cluster 1 spectrum that is discussed here.
The spectrum of cluster 1 is shown in Figures 16 and 17. Many of the strong emission lines in the NGC 55 spectrum are either removed or over-corrected by the subtraction of the local sky. The lines of H, [SII] and [SIII] are over-corrected, and these features have been clipped at a level that is lower than the continuum in Figure 16 to prevent interfering with the other spectra shown in the figure. That emission lines are stronger outside of cluster 1 suggests that the objects that are the dominant drivers of line emission are either (1) not concentrated in this part of cluster 1, but instead are located outside of the region sampled by GMOS, or (2) are present in cluster 1, but have created a bubble in the local ISM that girds the part of cluster 1 that is sampled by GMOS.


The GMOS spectra support the first possibility. The deep Ca triplet lines in the cluster 1 spectrum indicate that it is old enough for luminous red stars to have developed, pointing to a significant contribution from stars with an age Myr. This is an age where the luminous blue stars that power line emission disappear.
The dominant light contribution from cluster 1 appears to come from a population with an age of no more than a few tens of Myr. This is because the Ca lines in the cluster 1 spectrum in Figure 17 are sharp and deep, as expected if a large fraction of the light comes from RSGs. The mean spectrum of RSGs extracted from the NGC 3109 observations – discussed in the next section – is also shown in Figure 17. The NGC 3109 stars are probably dex more metal-poor than their NGC 55 counterparts. Still, the Ca lines in the spectrum of these RSGs are only slightly deeper than those in the cluster 1 spectrum
EMILES SSP model spectra are compared with the cluster 1 spectrum in Figures 16 and 17. The models assume [M/H] with scaled-solar abundances and a Chabrier MF. The TiO bands near 7100Å and 7600Å both match those in the 30 Myr model, and the shallow depth of the TiO band head near 7600Å is consistent with an age Gyr. While the 30 Myr model comes closest to matching the cluster 1 observations, the Ca lines are deeper in the cluster 1 spectrum than in that model, suggesting that cluster 1 has younger, brighter, and cooler RSGs than in the model. While a metallicity in excess of that used for the models could explain stronger Ca triplet lines, such an interpretation is unlikely for cluster 1 given the metallicities measured for young stars in NGC 55 (Patrick et al. 2017 and references therein). We thus suspect that cluster 1 contains a large contribution from stars with ages between 10 and 30 Myr. The EMILES compilation does not contain models with such ages.
There is a break in the cluster 1 spectrum that coincides with the CN band head near 7900Å. This feature is seen in all of the SSP models in Figure 16, it is deeper in cluster 1 than in any of the models. Other CN band heads occur near 7100Å and 9100Å. However, these coincide with TiO band heads, and so features at these wavelengths in the cluster 1 spectrum can not be linked unambiguously to CN. While the depth of the 7900Å band head suggests that cluster 1 may contain stars with ages older than a few hundred Myr, the CN band head is deepest in the 30 Myr model, suggesting that the CN feature may originate in RSGs. If cluster 1 had an age of a few hundred Myr then the models indicate that there would be deep Pa absorption lines that originate from bright stars near the main sequence turn-off. Pa absorption lines are not obvious in the cluster 1 spectrum. While there is a moderately deep line near 9200Å that coincides with the expected location of a Pa line, it is the only feature that coincides with Pa absorption.
The cluster 1 spectrum near Na I 8190 and FeH 9914 is examined in Figure 15. An absorption feature is seen near 8190Å that coincides with Na I, and it should be recalled that a similar feature is not present in the NGC 55 spectrum (Section 4.1). If due to photospheric Na I then this feature indicates that cluster 1 contains at least as many low mass stars as predicted by the Chabrier (2003) MF. However, if much of the light in cluster 1 comes from stars with an age Myr then stars with masses of a few tenths solar or less would not have had time to relax onto the main sequence (e.g. Siess et al. 2000), and so would not have the high surface gravities that are characteristic of deep Na I absorption. Given the age of cluster 1 then the Na absorption might be interstellar in origin, originating in gas along the cluster 1 line of sight.
As for the wavelength region near FeH, a feature that is similar to that found in the NGC 55 spectrum is also seen in the cluster 1 spectrum. However, the same caveats that were stated for the NGC 55 spectrum apply here, in that the match in wavelength coverage with FeH is not good. Also, if stars with masses near M⊙ have not relaxed on to the main sequence then the surface gravities may not be conducive to the formation of hydrides.
5. RESULTS: NGC 3109
5.1. NGC 3109: Stellar Spectra
Four distinct bright stars are located in the areas in NGC 3109 that were sampled by GMOS. None are obvious blends, although contamination from faint stars might go undetected. The spectra of these stars are shown in Figure 18. Two are in the 2MASS point source catalog, and their NIR brightnesses and colors are listed in Table 5. These stars are near the faint limit of the 2MASS survey, and are in moderately crowded fields. Therefore, the 2MASS photometry is subject to sizeable uncertainties. The 2MASS naming convention has been adopted to show the approximate co-ordinates of the other two stars.

| GMOS ID | 2MASS ID aaEntries in brackets indicate stars that are not in the 2MASS PSC. The numbers in brackets show RA and Declination, using the 2MASS naming scheme. | |||
|---|---|---|---|---|
| (RADec) | ||||
| P1-01 | (10031250–2608558) | – | – | – |
| P2-01 | 10030403–2609027 | 15.630 | 0.121 | 0.892 |
| P2-02 | (10030430–2608403) | – | – | – |
| P3-01 | 10030205–2608575 | 15.782 | 0.179 | 0.781 |
Three of the stars are members of NGC 3109, while another is a foreground Galactic star. The depths and shapes of the Ca triplet lines in the spectra of P2-01, P2-02, and P3-01 are similar, indicating comparable spectral-types. These stars have radial velocities km sec-1, which is consistent with membership in NGC 3109. Hence, these stars are RSGs in NGC 3109. The near-infrared colors of P2-01 and P3-01 are consistent with this conclusion. The mean spectrum of these three stars is shown in Figure 17. P1-01 has spectroscopic properties that differ from the others, in the sense that the Ca absorption lines in the P1-01 spectrum are shallower and broader. The radial velocity of P1-01 is km sec-1, indicating that it is not a member of NGC 3109, but instead is in the Galactic foreground.
5.2. NGC 3109: Integrated Spectra
The spectrum of NGC 3109 was constructed by averaging signal at each pointing in a arcsec wide interval along the slit. The center of the extraction window was the midpoint of the light profile that was constructed by collapsing the spectra between 0.7 and m. The NGC 3109 spectra have a much lower S/N ratio than those of NGC 55 due to the low surface brightness of the galaxy. Hence, the spectra of the three pointings were combined to boost the S/N ratio. Even then, the S/N ratio of the combined spectrum is poor at most wavelengths, and there is substantial noise at wavelengths dominated by sky emission lines. In recognition of this, the current investigation is restricted to the two wavelength regions shown in Figure 19. The top panel covers wavelengths near the band head of TiO at 7100Å. Wavelengths near this feature are free of telluric emission lines, while the TiO band head itself is a gauge of M giant content and is an age diagnostic (see below). The lower panel shows the region near the Ca triplet. This wavelength interval was selected for its astrophysical importance, although residuals from sky emission lines chop up much of the spectrum near these features.

The TiO band head near 7100Å is weak in the NGC 3109 spectrum when compared with that seen in the NGC 55 spectrum. This indicates that evolved M stars contribute less light to the NGC 3109 spectrum near 7100Å than in NGC 55, signalling a difference in stellar content. Residuals from the subtraction of telluric emission lines are significant throughout much of the wavelength region shown in the lower panel of Figure 19. While the Ca lines at 8498 and 8662Å are distorted by telluric emission residuals, the Ca line at 8540Å is in a part of the spectrum that is free of sky emission lines. Despite having a lower metallicity than NGC 55, Ca 8540 is deeper in NGC 3109 than in the NGC 55 spectrum.
The NGC 3109 spectrum is compared with SSP EMILES models in Figure 20. The models assume [M/H] = –0.66 for consistency with the metallicity measured among bright stars in NGC 3109 by Hosek et al. (2014). The TiO bandhead at 7100Å becomes less pronounced in the models as age decreases, suggesting that the lack of an obvious TiO feature in NGC 3109 is an age effect. The depth of Ca 8540 is best matched by the 30 Myr model in Figure 20, which is the youngest age in the EMILES compilation. While based on only two features, these results are consistent with the notion that the red light in NGC 3109 is dominated by stars with ages Myr, as expected if there has been a recent large upswing in the star formation rate of NGC 3109. Dolphin et al. (2005) found evidence for a surge in recent star formation in the analysis of the NGC 3109 CMD.

6. DISCUSSION
The spectroscopic properties of the intermediate age LMC cluster NGC 1978 and the galaxies NGC 55 and NGC 3109 have been examined in the wavelength interval m using long slit spectra recorded with GMOS on the Gemini South telescope. Spectra of integrated light from each system have been extracted, and these have been compared with model spectra from the EMILES compilation. Spectra of individual bright stars have also been extracted from the NGC 1978 and NGC 3109 spectra – NGC 55 is too distant for light from individual stars to be extracted from these data. In the case of NGC 1978 the stellar spectra allow the influence that individual bright stars have on the integrated spectrum to be explored.
NGC 1978 is an intermediate age ( Gyr) cluster with a metallicity that is comparable to that of NGC 55. There has been debate during the past decade about the nature of intermediate age clusters in the Magellanic Clouds, with emphasis on the origin of the extended main sequence turn-offs that have been found in the CMDs of many of these (see Goudfrooij et al. 2017 & Li et al. 2016 for recent discussions). Published spectroscopic and photometric observations indicate that NGC 1978 does not have an extended main sequence turn-off and that there is a tight upper limit on star-to-star metallicity differences. These argue that NGC 1978 is a SSP.
The NGC 1978 observations consist of five contiguous slit pointings, made through 2 arcsec wide slits that are aligned parallel to the major axis. Raster-scanning – in which a target is moved across the slit during an observation – is another technique that can be used to obtain the integrated spectra of star clusters. However, while raster-scanning has the potential of sampling light from a large part of a cluster, the spatial information that is needed to examine contributions from individual bright stars is lost.
The CaT indices measured in the spectra of 13 evolved stars in NGC 1978 are consistently larger than is expected for K and M giants with the same metallicity as NGC 1978. Deeper than expected Ca lines could occur if stars in NGC 1978 have [Ca/Fe] . However, observations challenge such an explanation for NGC 1978. Olszewski et al. (1991) discuss Ca measurements of NGC 1978 stars 8 and 9 in the numbering scheme of Lloyd Evans (1980b). Figure 10 of Olszewski et al. (1991) demonstrates that these stars do not depart from the trend between brightness and Ca equivalent width defined by other stars in the Magellanic Clouds. Star 8 is 2MASS05284847–6614387, which was one of the stars extracted from the GMOS spectra. Aside from the likely foreground stars 2MASS05283756–6613040 and 2MASS05284668–6614262, and the C star 2MASS05284449–6614039, 2MASS05284847–6614387 has the second lowest CaT index listed in Table 2. Both of the stars observed by Olszewski et al. (1991) in NGC 1978 are in the outer regions of the cluster (Plate 1 of Lloyd Evans 1980b), raising the possibility that one or both may belong to the LMC field population. [Ca/Fe] among intermediate age stars in the LMC bar and inner disk (Van der Swaelmen et al. 2013).
Mucciarelli et al. (2008) examine the chemical compositions of 11 bright giants in NGC 1978, and find a mean [Ca/Fe] with a dispersion dex. They also measure abundances for the elements O, Mg, and Si. The average [Mg/Fe] and [Si/Fe] is above solar, while [O/Fe] is sub-solar. As with the other intermediate age clusters examined by Mucciarelli et al. (2008) it thus appears that [/Fe] in NGC 1978 is close to solar. Thus, these measurements do not support a high [Ca/Fe] in NGC 1978.
The deep Ca lines in the NGC 1978 spectrum are not the only peculiar properties associated with this cluster. Lederer et al. (2009) discuss the abundances of C isotopes and O in bright stars in NGC 1978, and find differences when compared with models and similar measurements in the intermediate age cluster NGC 1846. They consider three possible causes for the abundance peculiarities in NGC 1978: multiple populations, stellar rejuventation, and extra mixing. As noted above, there are indications that NGC 1978 is an SSP, arguing against the first and second of these causes. As for extra mixing, Lederer at al. (2009) emphasize the ad hoc nature of this explanation, and highlight that much work needs to be done to better understand mixing mechanisms. Nevertheless, we note that extra mixing could be a consequence of rotation. If stars in NGC 1978 had a uniformly high initial rotation rate that persisted for much of their lives then they will develop larger core masses than non-rotating stars. This in turn could drive the surface gravities during the advanced stages of evolution to lower values than in non-rotating stars. It should be emphasized that there is no direct evidence for a uniformly high initial spin rate among stars in NGC 1978, and so this explanation is speculative only. Still, the prospect that the comparatively strong Ca triplet lines in the integrated spectrum of NGC 1978 might be linked to the chemical peculiarities found by Lederer et al. (2009) warrants further exploration.
While the depths of Ca triplet lines in model spectra do not match those observed in NGC 1978, the agreement between models and the spectra of NGC 55, which has a metallicity that is similar to NGC 1978, is better. NGC 55 is of course not an SSP, as stars in NGC 55 formed over a range of epochs. Still, comparisons with SSP models are useful to establish a characteristic age of the stars that contribute most to the light at these wavelengths. Comparisons with the models suggest that a large fraction of the integrated light at red wavelengths comes from populations with ages 1 – 2 Gyr. The CN bandhead near 7900Å is present but weak in the NGC 55 spectrum, suggesting that C stars do not contribute significantly to the integrated light in the area sampled by these spectra. Davidge (2005) discussed the star-forming history of NGC 55, and used different lines of evidence to conclude that the star formation rate in NGC 55 during recent epochs is much lower than during intermediate epochs. The characteristic age deduced from the GMOS spectra is consistent with this.
The GMOS spectra cover arcsec ( kpc) on either side of the major axis of NGC 55, and a gradient in the depth of the NIR Ca triplet is seen. Davidge (2005) found a gradient in the photometric properties of the most luminous AGB stars, albeit over a considerably larger range of offsets from the disk plane than are examined with the GMOS spectra. The disk of NGC 55 is inclined by 79o to the line of sight and the Holmberg radius is arcmin (Puche et al. 1991). The GMOS spectra thus sample light from the disk, even at the largest offsets, and the variation in CaT is likely driven by radial metallicity gradients in the NGC 55 disk. Indeed, Kudritzki et al. (2016) find a radial metallicity gradient among young blue supergiants in the NGC 55 disk. The GMOS data suggest that a metallicity gradient also is present among the intermediate age stars that dominate the integrated spectrum.
Non-secular processes may have played a significant role in shaping the present-day properties of the NGC 55 disk. Kudritzki et al. (2016) examine the chemical evolution of the NGC 55 disk, and find evidence for large scale infall and outflow. Tanaka et al. (2011) find metal-poor structures in the outermost regions of NGC 55, and suggest that these are artifacts of mergers with dwarf satellites. Tidal interactions during the assimilation of such companions may heat the disk. There is also evidence for interactions during intermediate epochs that could have triggered a large star-forming event. Westmeier et al. (2013) find an asymmetric HI distribution associated with NGC 55 that is interpreted as an artifact of ram pressure interactions with the inter-galactic medium, with the HI compacted in the western part of the galaxy, as expected if NGC 55 were moving away from NGC 300, which is its nearest large neighbor. They also find evidence that the gaseous component of the NGC 55 disk has been stirred. These two findings lead Westmeier et al. (2013) to suggest that NGC 55 and NGC 300 interacted 1 – 2 Gyr in the past, at which time the disk of NGC 55 was tidally heated. An interaction of this nature might also induce elevated levels of star-forming activity, and the timing of the interaction between the two galaxies is consistent with the characteristic age of the red spectrum of NGC 55.
The GMOS slit passes through one of the two star-forming complexes identified by Ferguson et al. (1996). While emission from H and other lines is widespread near the major axis of NGC 55, the spectrum of the part of cluster 1 that is sampled by GMOS contains line emission that is much weaker than in its immediate surroundings. Thus, this part of cluster 1 likely does not harbor a large concentration of massive hot ionizing stars. The presence of deep Ca absorption features indicates an age of at least 8 Myr for cluster 1, with an estimated upper age limit of 30 Myr. A deep CN bandhead at 7900Å is also seen in the cluster 1 spectrum. While this may be the result of an interloping C star (or interloping C stars), a moderately strong CN bandhead is also present in model spectra with ages of a few tens of Myr (e.g. Figure 16), suggesting that it may originate in RSGs. If C stars are present then C2 absorption should be seen at m. Davidge (2005) found a population of bright red supergiants in cluster 1, and the location of these objects on the two color diagram is consistent with an age of at least 10 Myr. Thus, there is consistency between the photometric and spectroscopic age estimates of cluster 1.
We close the discussion by examining NGC 3109. Holtzman et al. (2005) discuss a moderately deep CMD of a field in NGC 3109 that is restricted to stars with M. The morphology of the CMD is consistent with a constant SFR over a range of epochs, followed by a factor of 2 upswing in the SFR during the past 0.1 Gyr (Dolphin et al. 2005). While the cause of a recent upturn in star-forming activity in NGC 3109 is a matter of speculation, Barnes & de Blok (2001) suggest that NGC 3109 and Antlia A may have interacted Gyr ago. An interaction between these galaxies could have sparked elevated levels of star-forming activity at a time that coincides with the rise in the SFR indicated by the CMDs.
The interpretation of the NGC 3109 spectra is complicated by the low S/N ratio of the data, and the age information found from these spectra should be considered as preliminary only. Still, while there is the potential for an age-metallicity degeneracy, if [Fe/H] is adopted for the models as indicated by the abundance analysis of some of the brightest members of the galaxy (Hosek et al. 2014) then the models point to a characteristic age of tens of Myr, as opposed to the 1 – 2 Gyr age found for NGC 55. This conclusion is based on the depth of the Ca8540 line, which is sharper and deeper than its counterpart in the NGC 55 spectrum, despite originating in a lower metallicity environment. This suggests a larger contribution to the light from RSGs in NGC 3109 than in NGC 55. The weak TiO bandhead near 7100Å also supports a characteristic age Gyr. That significant star-forming activity has occured during recent epochs is consistent with the conclusion reached by Dolphin et al. (2005) that the SFR in NGC 3109 experienced an upturn during the past 0.1 Gyr.
7. CONCLUSIONS
Based on the spectra presented in this paper, we conclude the following:
1) Pointing-to-pointing differences are seen in the NGC 1978 spectra, highlighting the role that stochastic effects play at red and NIR wavelengths. The most obvious differences in the overall appearance of the spectra are attributed to the contribution made by the C star 2MASS05284449–6614039 to the light in each pointing. These differences highlight that the CN band head at 7900Å can signal the presence of C stars in the integrated spectra of intermediate age systems.
2) Spatial variations in the distribution of the brightest M giants can significantly affect the strengths of features such as the Ca triplet in slit spectra that sample only a small percentage of the light from the cluster. The impact of these variations is of course muted when light from different pointings is combined. Indeed, the CaT index defined by Cenarro et al. (2001a) is not greatly affected by the presence of the C star or the brightest M giant in the combined spectrum from all 5 pointings, changing by only 0.1Å when either star is removed. This demonstrates that the CaT index is a robust probe of red stellar content in dense stellar systems like NGC 1978.
3) The CaT indices measured in the spectra of the most evolved stars in NGC 1978 are consistently larger than is expected based on Galactic K and M giants that have the same metallicity as NGC 1978. Model spectra from the EMILES compilation that adopt the age and metallicity of NGC 1978 also underestimate the depth of the Ca triplet lines. Evidence is presented that this is not due to [Ca/Fe], and it is suggested that rotation may have affected the surface gravities of the most evolved stars in NGC 1978.
4) Surface photometry measurements made from 2MASS images reveal a central red cusp within arcsec of the center of NGC 1978, which is a region that contains some of the brightest stars in the cluster. While 2MASS05284449–6614039 contributes a significant fraction of the light from this part of the cluster, this cusp is not due solely to that star. Rather, the red cusp is a probable signature of mass segregation in NGC 1978, which might be primordial in origin (Parker et al. 2016). The stronger than expected Ca line strengths are not due to mass segregation, as the depth of the Ca triplet does not change if a spectrum is constructed that excludes light from the central cusp.
5) In contrast with NGC 1978, model spectra reproduce the depths of the Ca lines in the spectrum of NGC 55. Comparisons with the models suggest that a large fraction of the integrated light from NGC 55 at red wavelengths comes from populations with ages 1 – 2 Gyr. The CN bandhead near 7900Å is present but weak in the NGC 55 spectrum, suggesting that C stars do not contribute significantly to the integrated light in the area sampled by these data.
6) A gradient in the depth of the NIR Ca triplet with respect to distance from the major axis is seen in the NGC 55 spectrum. This is likely due to a radial metallicity gradient in the NGC 55 disk.
7) The spectrum of the part of cluster 1 in NGC 55 that is sampled by GMOS contains line emission that is much weaker than in its immediate surroundings. The presence of deep Ca absorption features indicates an age of at least 8 Myr for cluster 1, with an estimated upper age limit of 30 Myr.
8) Comparisons with models suggest a characteristic age of tens of Myr for NGC 3109, as opposed to the 1 – 2 Gyr age found for NGC 55. This age estimate is based largely on the depth of the Ca8540 line, which is sharper and deeper than its counterpart in the NGC 55 spectrum.
References
- (1)
- (2) Armandroff, T. E., & Zinn, R. 1988, AJ, 96, 92
- (3)
- (4) Barnes, D. G., & de Blok, W. J. G. 2001, AJ, 122, 825
- (5)
- (6) Battinelli, P., & Demers, S. 2005, A&A, 434, 657
- (7)
- (8) Bellazinni, M., Oosterloo, T., Fraternali, F., & Beccari, G. 2013, A&A, 559, L11
- (9)
- (10) Bessell, M. S., & Brett, J. M. 1988, PASP, 100, 1134
- (11)
- (12) Brocklehurst, M. 1971, MNRAS, 153, 471
- (13)
- (14) Carpenter, J. M. 2001, AJ, 121, 2851
- (15)
- (16) Castro, N., Urbaneja, M. A., Herrero, A., et al. 2012, A&A, 542, A79
- (17)
- (18) Cenarro, A. J., Cardiel, N., Gorgas, J., Peletier, R. F., Vazdekis, A., & Prada, F. 2001a, MNRAS, 326, 959
- (19)
- (20) Cenarro, A. J., Gorgas, J., Cardiel, N., Pedraz, S., Peletier, R. F., & Vazdekis, A. 2001b, MNRAS, 326, 981
- (21)
- (22) Cenarro, A. J., Gorgas, J., Cardiel, N., Vazdekis, A., & Peletier, R. F. 2002, MNRAS, 329, 863
- (23)
- (24) Chabrier, G. 2003, PASP, 115, 763
- (25)
- (26) Cook, K. H., Aaronson, M., & Norris, J. 1986, ApJ, 305, 634
- (27)
- (28) Cordier, D., Pietrinferni, A., Cassisi, S., & Salaris, M. 2007, AJ, 173, 468
- (29)
- (30) Dalcanton, J. J., Williams, B. F., Seth, A. C. et al. 2009, ApJS, 183, 67
- (31)
- (32) Davidge, T. J. 1998, ApJ, 497, 650
- (33)
- (34) Davidge, T. J. 2005, ApJ, 622, 279
- (35)
- (36) Davidge, T. J. 2016, ApJ, 818, 142
- (37)
- (38) Davidge, T. J., & Jensen, J. B. 2007, AJ, 133, 576
- (39)
- (40) Davidge, T. J., Andersen, D. R., Lardiere, O., Bradley, C., Blain, C., Oya, S., Akiyama, M. & Ono, Y. H. 2015, ApJ, 811, 133
- (41)
- (42) Demers, S., Battinelli, P., & Letarte, B. 2003, A&A, 410, 795
- (43)
- (44) Dolphin, A. E., Weisz, D. R., Skillman, E. D., & Holtzman, J. A. 2005, astro-ph 0506430v1
- (45)
- (46) Ferguson, A. M. N, Wyse, R. F. G., & Gallagher, J. S. 1996, AJ, 112, 2567
- (47)
- (48) Ferraro, F. R., Mucciarelli, A., Carretta, E., & Origlia, L. 2006, ApJ, 645, L33
- (49)
- (50) Fischer, P., Welch, D. L., & Mateo, M. 1992, AJ, 104, 1086
- (51)
- (52) Frogel, J. A., Mould, J., Blanco, V. 1990, ApJ, 352, 96
- (53)
- (54) Girardi, L., Bressan, A., Bertelli, G., & Chiosi, C. 2000, A&AS, 141, 371
- (55)
- (56) Goudfrooij, P., Girardi, L., & Correnti, M. 2017, ApJ, 846, 22
- (57)
- (58) Graham, J. A., & Lawrie, D. G. 1982, ApJ, 253, L73
- (59)
- (60) Hardy, T., Hanna, K., Szeto, K., & Burley, G. 2012, Proc. SPIEE, 8453, 84531Z
- (61)
- (62) Holtzman, J. A., Afonso, C., & Dolphin, A. 2005, ApJS, 166, 534
- (63)
- (64) Hook, I. M., Jorgensen, I., Allington-Smith, J. R., Davies, R. L., Metcalfe, N., Murowinski, R. G., & Crampton, D. 2004, PASP, 116, 425
- (65)
- (66) Hosek, M. W. Jr., Kudritzki, R. P., Bresolin, F., et al. 2014, ApJ, 785, 151
- (67)
- (68) Jedrzejewski, R. I. 1987, MNRAS, 226, 747
- (69)
- (70) Jones, J. E., Alloin, D. M., & Jones, B. J. T. 1984, ApJ, 283, 457
- (71)
- (72) Karachentsev, I. D., Grebel, E. K., Sharina, M. E., et al. 2003, A&A, 404, 93
- (73)
- (74) Kudritzki, R. P., Castro, N., Urbaneja, M. A., et al. 2016, ApJ, 829, A70
- (75)
- (76) Lederer, M. T., Lebzelter, T., Cristallo, S., Straniero, O., Hinkle, K. H., & Aringer, B. A&A, 502, 93
- (77)
- (78) Leitherer, C., Schaerer, D., Goldader, J. D., et al. 1999, ApJS, 123, 3
- (79)
- (80) Li, Z., Mao, C., Zhang, L., Zhang, X., & Chen, L. 2016, ApJS, 225, 7
- (81)
- (82) Lloyd Evans, T. 1980a, MNRAS, 193, 97
- (83)
- (84) Lloyd Evans, T. 1980b, MNRAS, 193, 87
- (85)
- (86) Magrini, L., Goncalves, D. R., & Vajgel, B. 2017, MNRAS, 464, 739
- (87)
- (88) Maraston, C. 1998, MNRAS, 300, 872
- (89)
- (90) Maraston, C. 2005, MNRAS, 362, 799
- (91)
- (92) Mateo, M. 1998, ARA&A, 36, 435
- (93)
- (94) Milone, A. P., Bedin, L. R., Piotto, G., & Anderson, J. 2009, A&A, 497, 755
- (95)
- (96) Miner, J., Rose, J. A., & Cecil, G. 2011, ApJL, 727, L15
- (97)
- (98) Mouhcine, M., Lancon, A., Leitherer, C., Silva, D., & Groenewegen, M. A. T., 2002, A&A, 393, 101
- (99)
- (100) Mucciarelli, A., Ferraro, F. R., Origlia, L., Fusi Pecci, F. 2007, AJ, 133, 2053
- (101)
- (102) Mucciarelli, A., Carretta, E., Origlia, L., & Ferraro, F. R. 2008, AJ, 136, 375
- (103)
- (104) Olszweski, E. W., Schommer, R. A., Suntzeff, N. B., & Harris, H. C. 1991, AJ, 101, 515
- (105)
- (106) Parker, R. J., Goodwin, S. P., Wright, N. J., Meyer, M. R., & Quanz, S. P. 2016, MNRAS, 459, L119
- (107)
- (108) Patrick, L. R., Evans, C. J., Davies, B., et al. 2017, MNRAS, 468, 492
- (109)
- (110) Pietrinferni, A., Cassisi, S., Salaris, M., & Castelli, F. 2004, ApJ, 612, 168
- (111)
- (112) Puche, D., Carignan, C., & Wainscoat, R. J. 1991, AJ, 101, 447
- (113)
- (114) Rayner, J. T., Cushing, M. C., & Vacca, W. D. 2009, ApJS, 185, 289
- (115)
- (116) Reines, A. E., Nidever, D. L., Whelan, D. G., & Johnson, K. E. 2010, ApJ, 708, 26
- (117)
- (118) Richer, H. B., Crabtree, D. R., & Pritchet, C. J. 1984, ApJ, 287, 138
- (119)
- (120) Richter, O.-G., Tammann, G. A., & Huchtmeier, W. K. 1987, A&A, 171, 33
- (121)
- (122) Rock, B., Vazdekis, A., Ricciardelli, E., Peletier, R. F., Knapen, J. H., & Falcon-Barroso, J. 2016, A&A, 589, A73
- (123)
- (124) Sand, D. J., Spekkens, K., Crnojevic, D., Hargis, J. R., Willman, B., Strader, J., & Grillmaiir, C. J. 2015, ApJ, 812, L13
- (125)
- (126) Seth, A. C., Dalcanton, J. J., & de Jong, R. S. 2005a, AJ, 129, 1331
- (127)
- (128) Seth, A. C., Dalcanton, J. J., & de Jong, R. S. 2005b, AJ, 130, 1574
- (129)
- (130) Siess, L., Dufour, E., & Forestini, M. 2000, A&A, 358, 593
- (131)
- (132) Skrutskie, M. F., Cutri, R. M., Stiening, R., et al. 2006, AJ, 131, 1163
- (133)
- (134) Spera, M., Mapelli, M., & Jeffries, R. D. 2016, MNRAS, 460, 317
- (135)
- (136) Stetson, P. B. 1987, PASP, 99, 191
- (137)
- (138) Stetson, P. B., & Harris, W. E. 1988,. AJ, 96, 909
- (139)
- (140) Tanaka, M., Chiba, M., Komiyama, Y., Guhathakurta, P., & Kalirai, J. S. 2011, ApJ, 738, 150
- (141)
- (142) Van der Swaelmen, M., Hill, V., Primas, F., & Cole, A. A. 2013, A&A, 560, A44
- (143)
- (144) Westmeier, T., Koribalski, B. S., & Braun, R. 2013, MNRAS, 434, 3511
- (145)
- (146) Worthey, G. 1994, ApJS, 95, 107
- (147)