Steps towards the experimental realization of surface plasmon polariton enhanced spontaneous parametric down-conversion
Abstract
The realization of efficient and miniature source of entangled photon pairs stills remains a challenge. In this work, we experimentally studied the possibility to enhance the process of spontaneous parametric down-conversion by surface plasmon polaritons. The details of the experimental setup will be discussed along with theoretical calculations of the enhancement factor.
keywords:
plasmonics, quantum optics , nonlinear opticsPACS:
42.65.Lm , 42.50.-p , 42.65.-k1 Introduction
Efficient source of entangled photon pairs is essential for many quantum optical experiments and applications like quantum communication, quantum-key distribution, quantum computing, etc [1, 2]. Up to now, the most perspective source of entangled photon pairs is based on spontaneous parametric down-conversion (SPDC) – splitting of pump photons into signal and idler photons due to nonlinear interaction with matter. Most commonly, the SPDC takes place in a bulk crystal, however, the practical availability is limited by the low efficiency of SPDC (only around ) and large footprint of the crystal (several millimeters) [3, 4, 5]. To overcome the problem of the low efficiency, the process of SPDC have been studied in nonlinear periodically-poled waveguides by many research groups and efficiencies up to have been reported [6, 7, 8, 9, 10]. However, the problem of large footprint still remains as a limitation of practical usability in miniature devices.
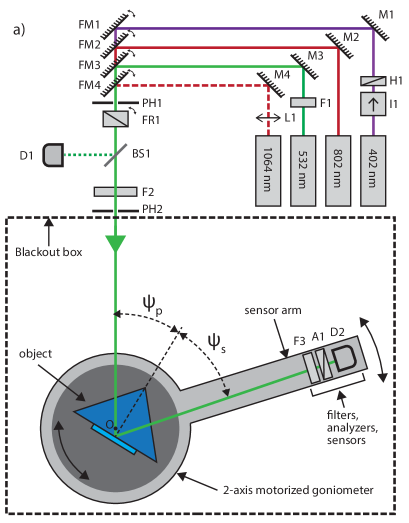
An idea to use the field enhancement of surface plasmon polaritons (SPPs) to boost the efficiency of SPDC was theoretically studied in Refs. [11, 12] and enhancements, also accessible in miniature sources, up to were predicted. For the proof of principle, the SPP-enhanced SPDC were studied in the structure similar to Kretschmann configuration (see Fig. 1), so splitting pump photons into two SPP modes (denoted by and in Fig. 1) instead to photonic modes becomes possible if phase-matching conditions (see Ref. [11])
| (1) | |||||
| (2) |
are fulfilled, where and denote the wavelength of the pump, signal and idler, respectively, is the tangential wavevector component of the pump beam, is the angle of incidence of the pump beam inside the prism, is the refractive index of the prism, and are the propagation constants of the signal and idler SPP modes, respectively. The enhancement of SPDC follows from the field enhancements of two participating plasmonic modes and the total enhancement of SPDC is given by
| (3) |
where and denote the field enhancement factors of the pump, signal and idler, respectively [11]. After propagation, the signal and idler plasmons leak back to the prism as photons.
The goal of this work is the experimental realization of SPP-enhanced SPDC in the structure shown in Fig. 1. To do that, goniometric measurement setup with lock-in amplification was designed. To the best of our knowledge, it is the first experimental attempt to plasmonically enhance SPDC.
2 Experimental setup
2.1 Structure
![[Uncaptioned image]](/html/1804.02166/assets/x1.png)
The structure for the realization of SPP-enhanced SPDC is shown in Fig. 1. First, polished X-cut single crystal quartz substrate () was bought from PI-KEM Ltd. It acts as a nonlinear crystal (second-order susceptibility ) and is selected due to relatively small refractive index () in comparison to the other commercially available nonlinear crystals [13]. Next, approximately thick silver film was deposited on one side of the quartz crystal and subsequently covered with approximately thick aluminum oxide layer in order to protect the silver surface. The deposition was done by AJA International ultra-high vacuum magnetron sputtering system at room temperature. The silver film was deposited using target, argon pressure, direct current power, biasing RF (radio frequency) power at the sample (to make the silver surface smoother) and the deposition time was . The aluminum oxide was deposited using target, argon pressure, RF source and deposition time . Shortly before measurements, the silver-quartz structure was attached to the high refractive index N-SF11 right-angle prism (Edmund Optics #47-276, side length ) with index-matching liquid (IML) from Cargille (Series M, refractive index ).
2.2 Goniometric setup
|
|
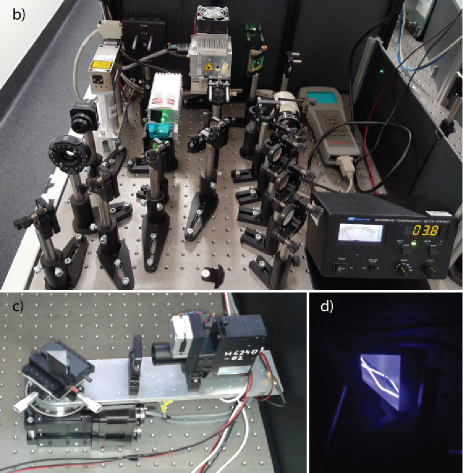
The structure in Fig. 1 was measured in custom-made two-axis motorized goniometer schematically shown in Fig. 2. The goniometer consists of two computer-controllable rotational stages from STANDA (8MR190V-2-VSS42), which are mounted on top of each other to independently rotate the object and the sensor around it [14]. Lasers are stationary on the optical table and the stepper motors of the rotational stages are driven by a two-axis controller (STANDA 8SMC1-USBhF-B2-MC2) allowing independent control of the angle of incidence () and sensor position () with a resolution up to
The structure under the study could be illuminated by four different laser wavelengths: (Toptica iBeam smart ), (Thorlabs LD808-SA60 mounted into Thorlabs TCLDM9 and controlled by Thorlabs LDC205C), (Sintec ST-532-ST-I ) and (Horus HLX-I E020-12101 pulsed ). The violet laser ( is protected by optical isolator I1 (Thorlabs IO-5-405-LP) and the linearly polarized output is rotated by half-wave plate H1 (Thorlabs WPH05M-405). The green laser () is additionally spectrally cleaned by color filter F1 and the divergent output of the laser is collimated by lens L1. All lasers are linearly polarized.
The beams of the lasers are aligned to be parallel to the surface of the optical table and to coincide the axis of the goniometer (denoted by O) with a pair of mirrors (Thorlabs BB1-E02 for and Thorlabs PF10-03-P01 for others), where FM1 - FM4 are flip mounted for easy switching between the wavelengths. Two pinholes, PH1 and PH2, are installed to simplify the alignment process. The polarization angle of lasers (except ) is adjusted by flip mounted Fresnel rhomb FR1. A small fraction of the laser light is reflected to the photodiode D1 (Thorlabs PM100 with head S130A) by the quartz beamsplitter BS1 to monitor the laser power during measurements. Finally, before the sample, the laser light is spectrally cleaned by filters F2 that will be shortly specified.
On the detection side, several different configurations are possible – it is possible to use different filters F3, motorized polarization analyzer A1 and different detectors D2. The concrete detection configuration will be specified shortly for the measurements of reflection curves, second-harmonic generation (SHG) and SPDC.
For the angular calibration of the goniometer and for the positioning of the object, the procedures given in Ref. [14] was followed.
2.3 Measurement of reflection curves
The SPP resonances of the structure in Fig. 1 were measured at two wavelengths ( and ). To do that, lasers were p-polarized with the Fresnel rhomb FR1, the cleanup filter F2 was not necessary and on the sensor arm only the detector D2 was used. In the case of wavelength photodiode Thorlabs PM100 with head S130A was used and in the case of the pulsed laser, Melles Griot 13 PEM 001 with thermopile sensor head was used.
2.4 Measurement of SHG
For the measurement of SPP-enhanced SHG, the structure was excited by the p-polarized pulsed laser, which was spectrally cleaned by three filters (Semrock FF01-593-LP, BLP01-633R and FF01-715-LP) in the position F2. On the detection side, the laser light was filtered out by Semrock FF01-535/150-25 and FF03-525/50-25 in the position F3 and the signal was detected through the p-polarized analyzer (A3) by Hamamatsu H6240-02 photo-multiplier tube (PMT) in the position D2. The TTL pulses from the PMT were counted by LabJack U6 in counter mode with collection time and the distance of PMT from the rotational axis O was
2.5 Measurement of SPDC
In the case of the measurement of the SPP-enhanced SPDC (shown in Fig. 1), two filters (Semrock FF01-535/150-25 and FF03-525/50-25) were added to the experimental scheme (F2) to clean the pump laser.
On the detection side, three interference filters (one Semrock BLP01-633R and two Semrock FF01-800-12) were used to filter out the pump laser (F3). As a detector (D2), Hamamatsu H6240-02 PMT was used (sensitive up to , quantum efficiency around at ). The distance of PMT from the rotational axis O was and the resulting angular detection span
To boost the signal-to-noise ratio of the measurements, digital lock-in amplifier was used by placing a rotating polarization analyzer (Thorlabs LPVIS050) to the position A1. The analyzer was rotated by a custom-built setup consisting of a stepper motor (Phidgets NEMA-17 20mm) and its controller (PhidgetStepper Bipolar HC 1067). The rotation frequency of the analyzer was which corresponds to the modulation frequency .
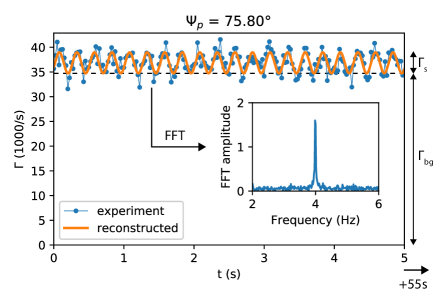
As SPPs are always p-polarized, then also the outcoupled SPDC signal is p-polarized, opposite to noise, which is unpolarized. The count rate of the PMT is then described by Malus’s Law
| (4) |
where is the rate of background (unpolarized) counts, is the rate of the polarized SPDC signal and is time. The time-dependent signal was registered by LabJack U6 in a stream mode at the detection rate over time period. The resulting time series were analyzed by software lock-in amplifier to extract the signal rate where
| (5) | |||||
| (6) |
Such method was shown to produce shot noise limited results [15, 16].
3 Results
3.1 Reflection curves
| a) | b) |
|
|
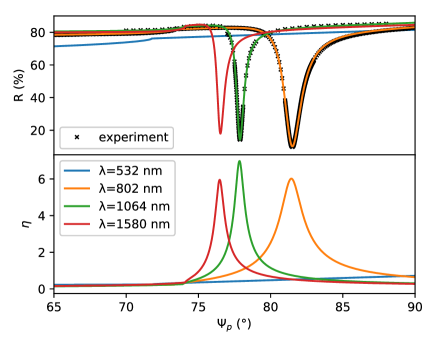
The measured reflection curves along with theoretical modeling are shown in Fig. 3a. Sharp plasmonic resonances are clearly visible by a minimum in the reflection () and by a maximum in the enhancement (). The theoretical reflection/enhancement curves were calculated by transfer-matrix method (TMM) and the unknown parameters were fitted [17, 18, 19, 11]. Really good overlap of the experiment and the model was achieved and the thicknesses and the complex refractive indices obtained from the modeling are presented in Tab. 2.1. The refractive indices of the N-SF11 prism and the single crystal quartz (ordinary component) perfectly match the known values from the literature (www.schott.com and Ref. [20]). The Al2O3 layer in the model is effective and also accounts for the losses in the IML. The fitting of the silver layer parameters revealed, that indeed, the thickness of the layer is close to and the complex refractive indices match quite well with the values reported in Ref. [21].
The reflection and the enhancement curves were also estimated for wavelengths and by using the refractive index data from the literature [21, 20]. The maximum field enhancement factors are up seven times (see Fig. 3a), which are considerably lower than the values predicted in our previous theoretical calculations in Ref. [11]. This discrepancy is accounted for different refractive index data for silver (data from P. B. Johnson and R. W. Christy [22]), which is known to significantly depend on the deposition and measurement process [23]. Also, it shows, that the quality of the silver film, used in this work, could be significantly improved by the optimization of the deposition process.
3.2 SPP-enhanced SHG
Before studying SPP-enhanced SPDC, the structure was tested with simpler SHG process. The enhancement of SHG by SPPs is well established both theoretically and experimentally (see Refs. [24, 25, 26, 27]) and thus can be used to confirm the nonlinearities of the structure.
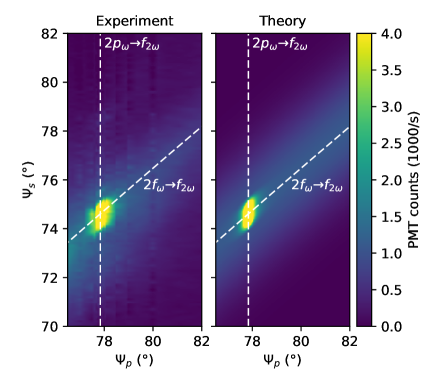
Here, we follow the methodology proposed by N. B. Grosse [27] to study SPP-enhanced SHG by k-space spectroscopy – we scanned both the angle of incidence of the pump beam and the angle of the sensor. Two different processes of SHG can take place in our structure: two photons can produce another photon at twice the frequency () and the pump laser can excite two plasmons and subsequently produce one photon (). The pure photonic process () can take place at any angle of incidence of the pump beam, however, the plasmonic process () can only happen at the specific SPP resonance angle of the pump beam.
The experimental results are shown in Fig. 3b together with theoretical predictions. The weak SHG signal is clearly visible along the predicted line of the process If the angle of incidence of the pump beam equals to the SPP-resonance angle, then the process is greatly enhanced by plasmonic enhancement (maximum in Fig. 3b). It is direct evidence, that our structure supports the plasmonic enhancement of nonlinear processes.
3.3 SPP-enhanced SPDC
| a) | b) |
|
|
Our initial plan was to observe the SPP-enhanced SPDC by the laser and to detect the equally split signal and idler photons () by PMT. However, incompatibility of the N-SF11 prism and IML with the laser appeared – the prism is luminescent (see Fig. 2d) and IML is not photostable while irradiated by violet light and visibly changes its color from transparent to brown in a couple of minutes.
As a workaround, the unequal splitting of (laser power ) was studied instead (like shown in Fig. 1). It is possible to select between different splitting ratios by tuning the angle of incidence of the pump beam due to the phase-matching conditions (see Ref. [11]).
Our strategy to detect the SPP-enhanced SPDC is the following. First, only the photons at wavelength are detected due to the sensitivity restriction of the PMT. Secondly, as the signal is first generated into the plasmonic mode and then outcoupled to the prism, we can easily experimentally determine the required sensor angle. To do that, we use data from previous measurements of SPP resonance at (see Fig. 3a): the resonance happens at and the correct positioning of the sensor is at Note, that the angle of incidence and the angle of the sensor are not the same due to the refraction of light in the prism (discussed in Ref. [14]). Now, if the plasmons are generated at wavelength we know the correct positioning of the sensor in advance. Finally, the only remaining free parameter is the angle of incidence of the pump laser which can be scanned to fulfill the phase-matching conditions.
The detection of the signal by lock-in amplification is described in Sec. 2.5 and is illustrated in Fig. 4a for the angle of incidence Clear modulation of the signal at frequency is visible (Fourier spectrum is in the inset of Fig. 4a) and the reconstructed signal clearly follows the noisy experimental data.
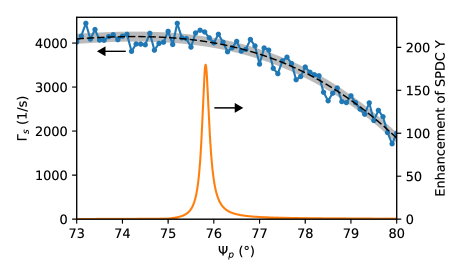
The angle of incidence of the pump beam was scanned over range in steps of ( and ) to achieve phase matching. It is expected to have a single maximum near the angle The results are shown in Fig. 4b together with the estimated enhancement factor of SPDC (Eq. 3). However, no maximum near the expected angle is visible – the dependence of on the angle of incidence of the pump beam is smooth and has a decreasing trend (black dashed line). The gray shaded region in Fig. 4b represents the theoretical limitation of the detection by shot noise ( confidence interval). The noise in the experimental data seems to be a bit higher, but still close to the theoretical limitation.
From Fig. 4b it is estimated, that the noise of the measurement is around Taking into account the power of the pump laser light and the quantum efficiency of the PMT, the minimum detectable yield of SPDC is calculated to be around – the yield of SPP-enhanced SPDC must be lower than it.
4 Discussion
Here we discuss the three main possibilities why no SPP-enhanced SPDC was detected. Firstly, the full modeling of SPP-enhanced SPDC in the recent paper (Ref. [12]) has revealed limiting factors in addition to the plasmonic enhancement. The main limitation is the short coherent buildup length () caused by the losses. However, the process of SPDC requires a long coherent buildup distance (several millimeters) for the yield and long coherent buildup distance only permits yield – the yield is still small () after the predicted enhancement by SPPs and below the detection limit of our setup [12]. Despite it, the SPP-enhanced SPDC has still high potential in miniature sources: the short coherent buildup is not a problem and the enhancement factor up to four orders of magnitude is still available.
Secondly, only a fraction of the full enhancement of SPDC predicted by a numerical modeling was experimentally available due to deficiencies of the silver film [11]. The fitting of reflection curves (see Fig. 3a) revealed, that the maximum enhancement of SPPs is only around 7 – several times lower than predicted in Ref. [11] on the basis of silver refractive data from P. B. Johnson and R. W. Christy [22]. The optimization of the deposition of the silver film could further enhance the SPDC by two orders of magnitude.
Thirdly, the lowest detectable yield of SPDC in our experimental setup is limited to mainly by the high background signal originating from the N-SF11 prism. To boost the sensitivity of the experimental setup, the background rate must be reduced. To do that, different prism or different excitation method (e.g. gratings) must be used. As the prism must have a high refractive index (), the selection of materials is quite limited.
5 Conclusions
In this communication, we have outlined a sensitive optical setup and measurement protocol to experimentally realize the enhancement of SPDC by SPPs. The details of the experimental setup were discussed along with theoretical calculations of the enhancement factor. The structure was characterized by the measurement of the reflection curves and the nonlinearity of the structure was experimentally demonstrated by SPP-enhanced SHG. However, no SPP-enhanced SPDC was detected mainly due to the short coherent buildup distance in our structure.
6 Acknowledgments
This work was supported by the Estonian research projects IUT2-27, IUT34-27 and the European Union through the European Regional Development Fund (project 3.2.0101.11-0029 and Centre of Excellence 2014-2020.4.01.15-0011) and through the ERA.Net Rusplus project “88 DIABASE”.
—————–
References
- Mandel and Wolf [1995] L. Mandel, E. Wolf, Optical coherence and quantum optics, Cambridge University Press, ISBN 9780521417112, 1995.
- Gerry and Knight [2004] C. Gerry, P. Knight, Introductory Quantum Optics, Cambridge University Press, Cambridge, ISBN 9780521527354, 2004.
- Burnham and Weinberg [1970] D. C. Burnham, D. L. Weinberg, Observation of Simultaneity in Parametric Production of Optical Photon Pairs, Physical Review Letters 25 (2) (1970) 84–87, doi:10.1103/PhysRevLett.25.84.
- Klyshko [1967] D. N. Klyshko, Coherent photon decay in a nonlinear medium, JETP Letters 6 (1) (1967) 490–492.
- Klyshko [1988] D. N. Klyshko, Photons and Nonlinear Optics, Gordon and Breach Science Publishers, ISBN 9782881246692, 1988.
- Tanzilli et al. [2001] S. Tanzilli, H. De Riedmatten, W. Tittel, H. Zbinden, P. Baldi, M. De Micheli, D. Ostrowsky, N. Gisin, Highly efficient photon-pair source using periodically poled lithium niobate waveguide, Electronics Letters 37 (1) (2001) 26, doi:10.1049/el:20010009.
- Sanaka et al. [2001] K. Sanaka, K. Kawahara, T. Kuga, New high-efficiency source of photon pairs for engineering quantum entanglement, Physical Review Letters 86 (24) (2001) 5620–5623, doi:10.1103/PhysRevLett.86.5620.
- Banaszek et al. [2001] K. Banaszek, a. B. U’ren, I. a. Walmsley, Generation of correlated photons in controlled spatial modes by downconversion in nonlinear waveguides., Optics letters 26 (17) (2001) 1367–1369, doi:10.1364/OL.26.001367.
- Mason et al. [2002] E. J. Mason, M. a. Albota, F. König, F. N. C. Wong, Efficient generation of tunable photon pairs at 0.8 and 1.6 microm., Optics letters 27 (23) (2002) 2115–7, doi:10.1364/OL.27.002115.
- Bock et al. [2016] M. Bock, A. Lenhard, C. Chunnilall, C. Becher, Highly efficient heralded single-photon source for telecom wavelengths based on a PPLN waveguide, Optics Express 24 (21) (2016) 23992, doi:10.1364/oe.24.023992.
- Loot et al. [2015] A. Loot, I. Sildos, V. Hizhnyakov, Enhanced spontaneous parametric down-conversion in a metal-dielectric interface, in: 2015 9th International Congress on Advanced Electromagnetic Materials in Microwaves and Optics (METAMATERIALS), vol. 7342484, IEEE, ISBN 978-1-4799-7836-6, 451–453, doi:10.1109/MetaMaterials.2015.7342484, 2015.
- Loot and Hizhnyakov [2018] A. Loot, V. Hizhnyakov, Modeling of enhanced spontaneous parametric down-conversion in plasmonic and dielectric structures with realistic waves, Journal of Optics in press, doi:10.1088/2040-8986/aab6c0.
- Dmitriev et al. [1999] V. G. Dmitriev, G. G. Gurzadyan, D. N. Nikogosyan, Handbook of optical nonlinear crystals, Springer, ISBN 9783540467939, 1999.
- Loot et al. [2013] A. Loot, L. Dolgov, S. Pikker, R. Lõhmus, I. Sildos, Goniometric Setup for Plasmonic Measurements and Characterization of Optical Coatings, in: Springer Proceedings in Physics, vol. 146, 119–134, 2013.
- Braun and Libchaber [2002] D. Braun, A. Libchaber, Computer-based photon-counting lock-in for phase detection at the shot-noise limit., Optics letters 27 (16) (2002) 1418–1420, doi:10.1364/OL.27.001418.
- Clarkson et al. [2010] P. Clarkson, T. J. Esward, P. M. Harris, A. A. Smith, I. M. Smith, Software simulation of a lock-in amplifier with application to the evaluation of uncertainties in real measuring systems, Measurement Science and Technology 21 (4) (2010) 045106, doi:10.1088/0957-0233/21/4/045106.
- Abeles [1957] F. Abeles, Optical Properties of Thin Absorbing Films, JOSA 47 (6) (1957) 473–482, doi:10.1364/josa.47.000473.
- Chilwell and Hodgkinson [1984] J. Chilwell, I. Hodgkinson, Thin-films field-transfer matrix theory of planar multilayer waveguides and reflection from prism-loaded waveguides, J. Opt. Soc. Am. 1 (7) (1984) 742–753, doi:10.1364/JOSAA.1.000742.
- Hodgkinson et al. [1997] I. Hodgkinson, S. Kassam, Q. Wu, Eigenequations and Compact Algorithms for Bulk and Layered Anisotropic Optical Media: Reflection and Refraction at a Crystal-Crystal Interface, Journal of Computational Physics 133 (1) (1997) 75–83, doi:10.1006/jcph.1997.5648.
- Ghosh [1999] G. Ghosh, Dispersion-equation coefficients for the refractive index and birefringence of calcite and quartz crystals, Optics Communications 163 (1-3) (1999) 95–102, doi:10.1016/S0030-4018(99)00091-7.
- Rakic et al. [1998] A. D. Rakic, A. B. Djurisic, J. M. Elazar, M. L. Majewski, Optical properties of metallic films for vertical-cavity optoelectronic devices., Applied optics 37 (22), doi:10.1364/AO.37.005271.
- Johnson and Christy [1972] P. B. Johnson, R. W. Christy, Optical Constants of the Noble Metals, Physical Review B 6 (12) (1972) 4370–4379, doi:10.1103/PhysRevB.6.4370.
- Jiang et al. [2016] Y. Jiang, S. Pillai, M. A. Green, Realistic Silver Optical Constants for Plasmonics, Scientific Reports 6 (2016) 1–7, doi:10.1038/srep30605.
- Simon et al. [1974] H. J. Simon, D. E. Mitchell, J. G. Watson, Optical Second-Harmonic Generation with Surface Plasmons in Silver Films, Physical Review Letters 33 (26) (1974) 1531–1534, doi:10.1103/PhysRevLett.33.1531.
- Simon et al. [1977] H. Simon, R. Benner, J. Rako, Optical second harmonic generation with surface plasmons in piezoelectric crystals, Optics Communications 23 (2) (1977) 245–248, doi:10.1016/0030-4018(77)90317-0.
- Kauranen and Zayats [2012] M. Kauranen, A. V. Zayats, Nonlinear plasmonics, Nature Photonics 6 (October) (2012) 737–748, doi:10.1038/nphoton.2012.244.
- Grosse et al. [2012] N. B. Grosse, J. Heckmann, U. Woggon, Nonlinear Plasmon-Photon Interaction Resolved by k-Space Spectroscopy, Physical Review Letters 108 (136802) (2012) 1–5, doi:10.1103/PhysRevLett.108.136802.
- Loot and Hizhnyakov [2017] A. Loot, V. Hizhnyakov, Extension of standard transfer-matrix method for three-wave mixing for plasmonic structures, Applied Physics A 123 (3) (2017) 152, doi:10.1007/s00339-016-0733-0.