First Accurate Normalization of the
-delayed Decay of 16N
and Implications
for the
Astrophysical Reaction Rate
Abstract
The reaction plays a central role in astrophysics, but its cross section at energies relevant for astrophysical applications is only poorly constrained by laboratory data. The reduced width, , of the bound level in 16O is particularly important to determine the cross section. The magnitude of is determined via sub-Coulomb -transfer reactions or the -delayed decay of 16N, but the latter approach is presently hampered by the lack of sufficiently precise data on the -decay branching ratios. Here we report improved branching ratios for the bound level [] and for -delayed emission []. Our value for is 33% larger than previously held, leading to a substantial increase in . Our revised value for is in good agreement with the value obtained in -transfer studies and the weighted average of the two gives a robust and precise determination of , which provides significantly improved constraints on the 12C cross section in the energy range relevant to hydrostatic He burning.
In the hot and dense interior of stars, helium is burned into carbon and oxygen by means of the triple- reaction and the reaction. The rates of the two reactions regulate the relative production of carbon and oxygen—a quantity of paramount importance in astrophysics affecting everything from grain formation in stellar winds to the late evolution of massive stars and the composition of type-Ia supernova progenitors deBoer2017 . At the temperatures characteristic of hydrostatic He burning, the triple- reaction is dominated by a single, narrow resonance—the so-called Hoyle resonance—and hence it has been possible to constrain the reaction rate through measurements of the properties of the Hoyle resonance. In contrast, the reaction receives contributions from several levels in 16O, which, as it happens, all lie outside the energy window where thermal fusion of in the stellar environment is efficient—the so-called Gamow window. This makes the task of determining the rate rather complex. While the triple- rate is now considered known within 10% in the energy range relevant to hydrostatic He burning fynbo2014 , with efforts underway to reduce the uncertainty to 5% tur2008 ; kibedi2012 , the uncertainty on the rate was recently estimated to be at least 20% which is insufficient for several astrophysical applications deBoer2017 .
The cross section has been measured down to center-of-mass energies of MeV, but the rapidly decreasing tunneling probability makes it challenging to extend the measurements to lower energies and practically impossible to reach the Gamow energy of 0.3 MeV. According to current understanding deBoer2017 , the capture cross section at 0.3 MeV receives its largest single contribution from the high-energy tail of the bound level in 16O, situated at an excitation energy of MeV only 45 keV below the threshold . The reduced width of this level, , provides a measure of how strongly the level couples to the channel. Therefore, is a critical quantity in determining the level’s contribution to the capture cross section at 0.3 MeV and, more generally, in constraining the extrapolation of the cross section to the energy range relevant for stellar helium burning. Specifically, the dominant term in the expression for the capture cross section (see, e.g., Eq. (6) in Ref. azuma1994 ) is proportional to where is the -wave penetration factor of the channel.
The magnitude of can be determined from the -delayed spectrum ( spectrum) of 16N barker1971 , but currently this approach is hindered by uncertainties in the normalization of the spectrum humblet1991 ; buchmann2009 as the inferred value for is strongly correlated with the assumed -decay branching ratios (, see Supplemental Material). Furthermore, the spectral form is not well determined experimentally due to small but significant discrepancies between existing measurements. Here, we focus our attention on the two high-precision spectra of Refs. azuma1994 ; tang2010 while disregarding a handful of other spectra, including those of Refs. hattig1970 ; france2007 , which all “retain significant experimental effects” deBoer2017 .
In this Letter, we report on an experimental study of the decay of 16N in which the unique radioactive-isotope production capabilities of the ISOLDE facility catherall2017 are exploited to provide the first accurate and precise determination of . We also present a novel -matrix analysis of the spectra of Refs. azuma1994 ; tang2010 , propose a resolution to the discrepancies between the two spectra, and extract an improved value for which is in good agreement with the value inferred from sub-Coulomb -transfer reactions. Finally, we comment on the implications of our findings for the determination of the cross section at 0.3 MeV. A detailed account of the experimental work and the -matrix analysis will be published separately kirsebom_in_prep_2018 .
The experiment was performed at the ISOLDE radioactive-beam facility of CERN catherall2017 . Radioactive isotopes were produced by the impact of a 1.4-GeV proton beam on a nano-structured CaO target ramos2014 , before being ionized in a cooled plasma ion source and accelerated through an electrostatic potential difference of 30 kV. Ions with the desired mass-to-charge () ratio were selected in the High-Resolution Separator and guided to the ISOLDE Decay Station fynbo2017 where their decay was studied. The ions were stopped in a thin ( g/cm2) carbon foil surrounded by five double-sided silicon strip detectors (DSSD) and four high-purity germanium (HPGe) clovers, allowing for the simultaneous detection of charged particles and rays. Meanwhile, auxiliary detectors were used to check that the beam was being fully transmitted to the center of the setup and stopped in the foil. During five days of data taking, the decay of 16N was studied mainly on (16N14N+) but also on (16N14N1H+). Additionally, the decays of 17Ne (, , ), 18N (, ), and 34Ar () were studied on , 32, and 34, providing crucial data for the efficiency calibration of the HPGe array and the energy calibration of the DSSD array.
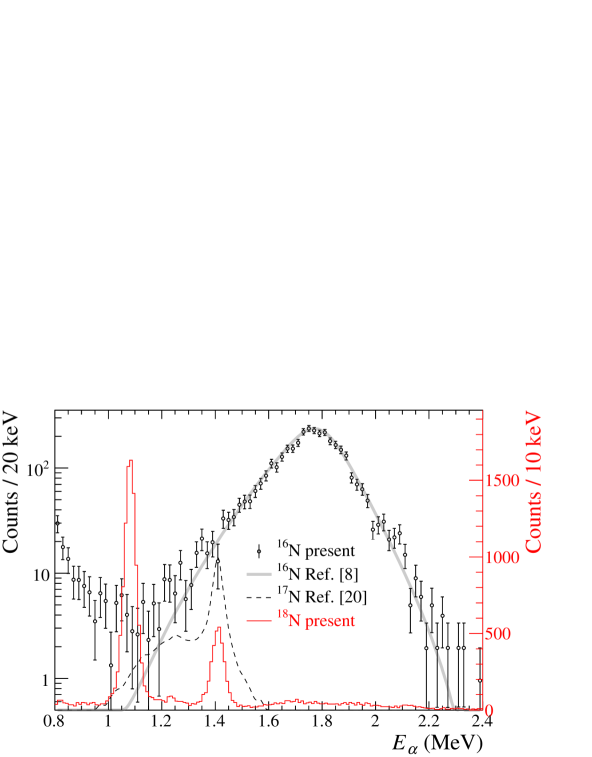
Three of the DSSDs were sufficiently thin (40 m and 60 m) to allow the spectrum of 16N to be clearly separated from the background. The other two DSSDs were much thicker (300 m and 1 mm) and served primarily to detect the particles. The distortions of the spectrum due to summing was negligible due to the high granularity of the DSSDs kirsebom2011 . Fig. 1 shows the spectrum obtained in one of the thin DSSDs on during 32 hours of measurement at an average 16N implantation rate of ions/s. The two narrow peaks at and keV in the spectrum of hahn1993 ; tunl18 obtained on were used to determine the detector response and energy calibration. The energy resolution was 30 keV (FWHM) for the two 60-m DSSDs and 70 keV for the 40-m DSSD.
The top panel of Fig. 2 shows the -ray spectrum measured in the HPGe clovers. The spectrum exhibits the characteristic rays from the decay of 16N tunl16 , most notably the prominent lines at 2.74, 6.13, and 7.12 MeV. Additionally, the spectrum provides evidence for only one other -delayed particle emitter, namely, 17N, present at a level of 1.3% relative to 16N, as inferred from the observation of its 0.871-MeV and 2.18-MeV rays.
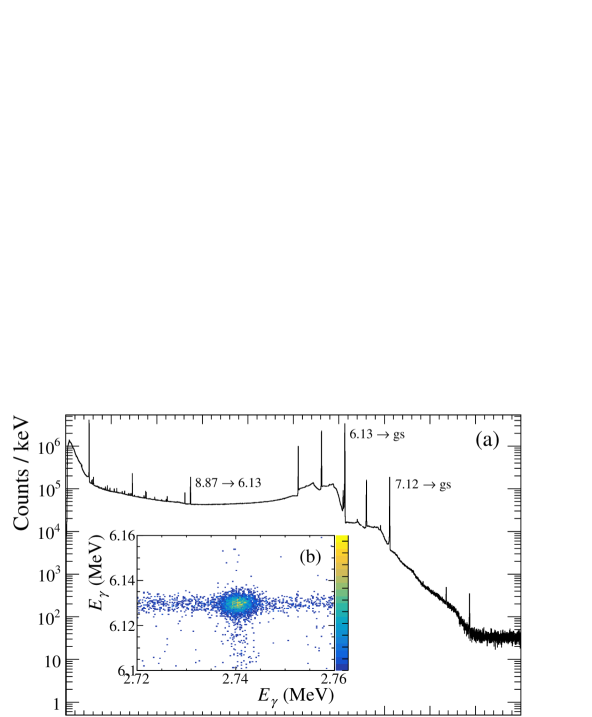
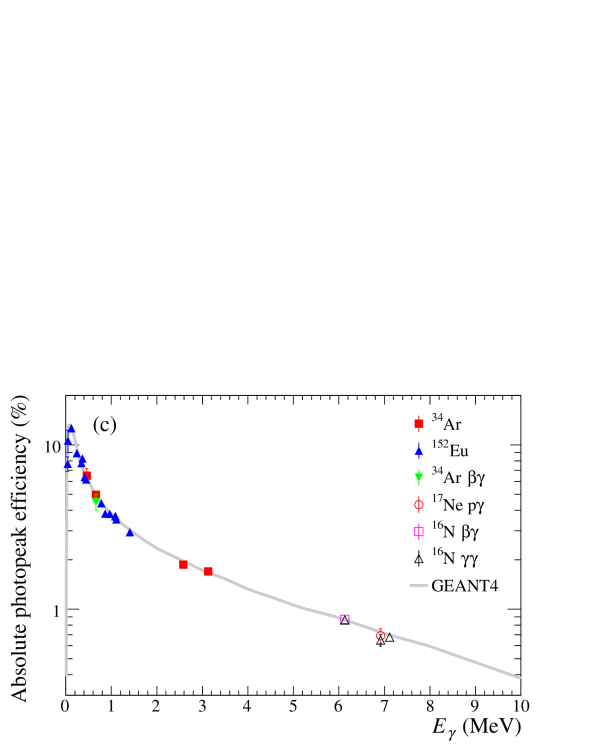
Based on the known branching ratio of 17N of dombsky1994 , we determine the level of 17N contamination in our spectrum to be . In order to convert the observed -ray yields to intensity ratios it is necessary to correct for the energy dependent detection efficiency of the HPGe array. An absolutely calibrated 152Eu source was used to determine the detection efficiency at low energies, while , , and coincidence-data were used to extend the efficiency calibration to higher energies. A GEANT4 simulation sotty_IDS_GEANT4_in_preparation , normalized only to the 152Eu data, was used to validate the efficiency calibration. As seen in Fig. 2 (c), there is excellent agreement across the entire energy range. Particular attention was paid to the 6.13-MeV ray since it is used for the overall normalization. Using the coincidences due to the cascade (Fig. 2 (b)) and coincidences, the detection efficiency at 6.13 MeV was determined with a precision of 1.4%. After correcting the observed coincidence yield for the known angular correlation vermeer1982 , the two approaches ( and ) gave fully consistent results.
Based on the relative -ray yields, we determine the -decay branching ratio to the 7.12-MeV level in 16O to be in agreement with Refs. tunl16 ; millar1951 ; toppel1956 ; alburger1959 ; tang2010 , but with a reduced uncertainty due to the precise efficiency calibration and high energy resolution of the present study. Based on the number of detected particles, the measured 6.13-MeV -ray yield, and the known relative intensity of the 6.13-MeV -ray line ( tunl16 ; warburton1984 ; heath1985 ), we determine the branching ratio for emission to be with the following error budget: -particle detection efficiency, 3.0%; -ray detection efficiency, 1.4%; -particle counting uncertainty, 1.3%; tabulated intensity of the 6.13-MeV ray, 0.9%; and subtraction of the 17N contamination, 0.4%. When added in quadrature these uncertainties combine to give the quoted total uncertainty of 3.8% on . Our value for is significantly larger than the literature value of tunl16 ; kaufmann1961 , but consistent with the less precise values of obtained by Ref. zhao1993 and obtained by us in a previous study using a different experimental technique refsgaard2016 .
In order to parametrize the shape of the spectrum, we adopt an -matrix model similar to that of Refs. azuma1994 ; tang2010 , consisting of two physical -wave levels at and 9.59 MeV, two physical -wave levels at and 11.60 MeV, and a -wave background pole at higher energy. The -matrix model of Refs. azuma1994 ; tang2010 additionally includes an -wave background pole with zero feeding, but we find that the inclusion of such a pole only gives a marginal improvement of and a slightly worse and hence we do not include it. On the other hand, we allow the feeding of the 11.60-MeV level, which was also set to zero in Refs. azuma1994 ; tang2010 , to vary freely. Our analysis differs from those of Refs. azuma1994 ; tang2010 in a few significant respects: First and most importantly, the analyses of Refs. azuma1994 ; tang2010 were aimed at determining the capture cross section at 0.3 MeV and therefore involved the simultaneous fitting of -decay data, -scattering data, and -capture data. Our analysis, on the other hand, is aimed at determining the constraints imposed on by the -decay data alone and at resolving the discrepancies between Refs. azuma1994 ; tang2010 , and hence we restrict our attention to the -decay data. We also adopt our improved values for and , and we fix the asymptotic normalization coefficient (ANC) of the 6.13-MeV level to the rather precise value of fm-1/2 inferred from sub-Coulomb transfer reactions avila2015 . All -matrix calculations have been performed with the code ORM ORM . Further details provided in Supplemental Material.
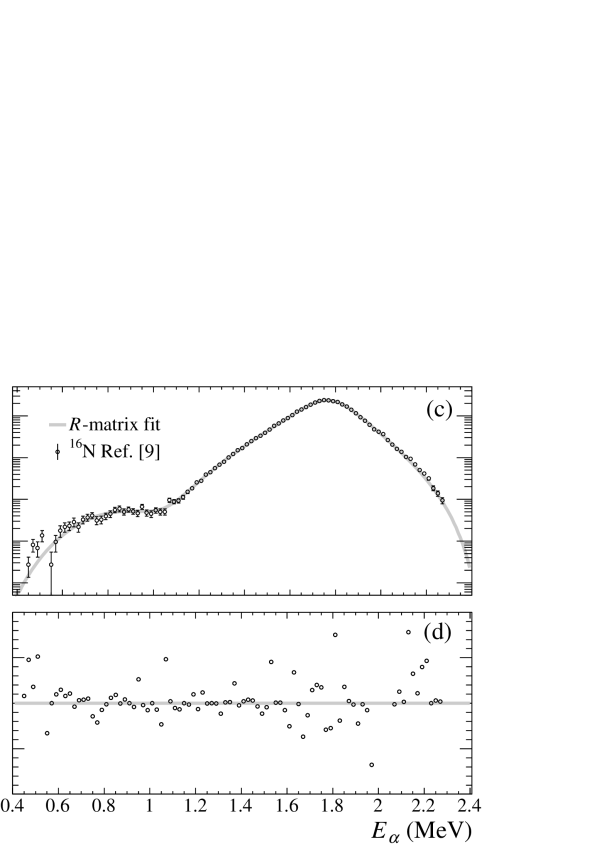
Following Refs. azuma1994 ; tang2010 we ignore the four data points in the vicinity of the narrow level at MeV. Allowing the channel radius to vary, we obtain a very good fit to the spectrum of Ref. azuma1994 (, , Fig. 3 left panel) yielding
| (1) |
(with evaluated at 0.3 MeV) and a preferred channel radius of fm. The largest contribution to the systematic uncertainty comes from the energy calibration (3.8%) with smaller contributions from (2.7%) and (2.0%) and even smaller contributions from the subtraction of 17N and 18N impurities (1.0%), the ANC of the 6.13-MeV level (0.4%), and the energy resolution (0.3%). Using the old branching ratio of tunl16 ; kaufmann1961 , we obtain eV with no change in fit quality. Thus, our revised value for leads to a 32% increase in . The precise effect on the capture cross section is difficult to determine since it requires a simultaneous fit to the spectrum, -capture data, and -scattering data, which is beyond the scope of the present study. An accurate estimate can, however, be obtained by adopting the best-fit parameters of Ref. azuma1994 and only modify the value of . Doing so, one finds a 24% increase in the capture cross section at 0.3 MeV, implying an upward shift of the best estimate of the astrophysical -factor from keV b azuma1994 to keV b.
We are unable to obtain a satisfactory fit to the spectrum of Ref. tang2010 (, , Fig. 3 right panel). Also, the channel radius preferred by the fit is significantly smaller ( fm). Yet, we obtain eV in fair agreement with Eq. (1).
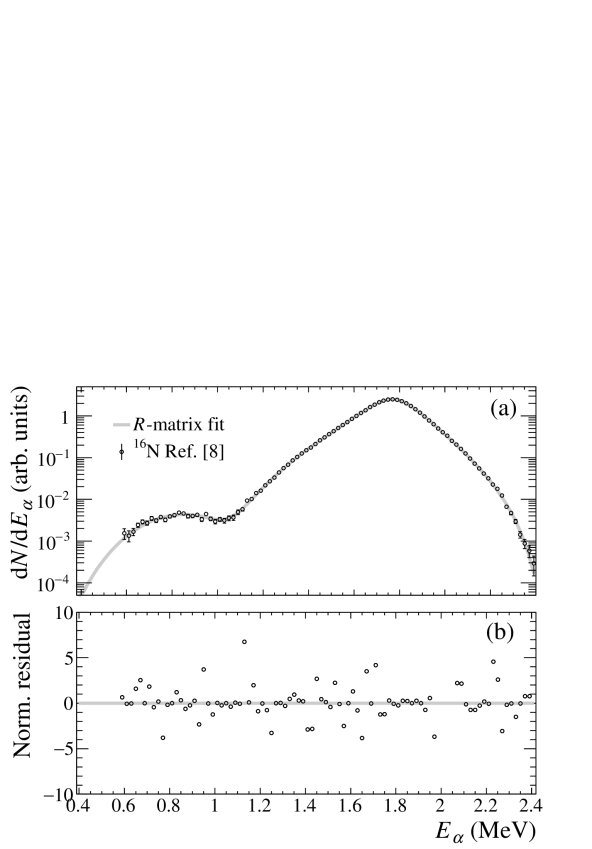
Given the discrepancies between the two spectra fn1 , it is a little surprising that we obtain almost agreeing values for . As seen in Fig. 4, the dip around MeV is less pronounced in the spectrum of Ref. tang2010 , and the main peak is slightly wider and shifted by keV relative to the spectrum of Ref. azuma1994 .
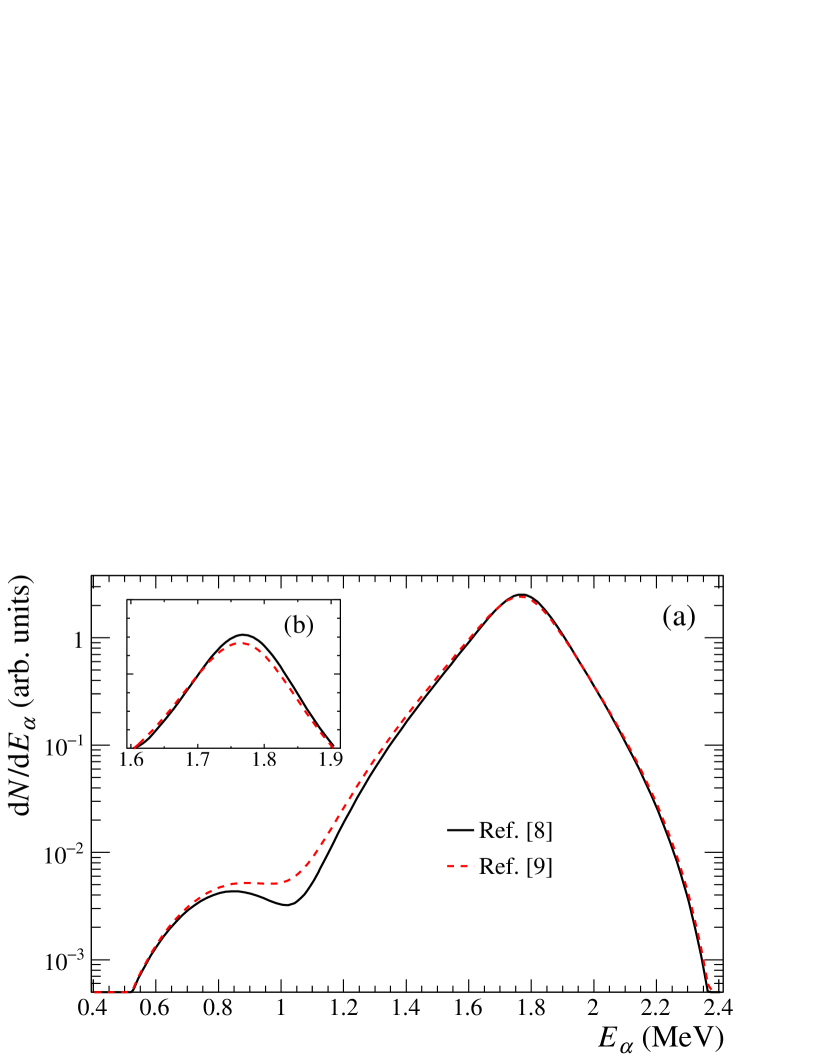
However, a detailed analysis reveals the agreement to be little more than a lucky coincidence: The less pronounced dip favours a larger value, but the downward energy shift has the opposite effect on so the two differences almost cancel out.
The spectrum obtained in the present work contains significantly fewer counts () than the spectra of Refs. azuma1994 ; tang2010 ( and ) and hence does not impose any useful constraints on . Our spectrum does, however, impose useful constraints on the position of the maximum of the -matrix distribution. Taking into account the uncertainty on the energy calibration, the maximum is found to be consistent with Ref. azuma1994 , but shifted by keV relative to Ref. tang2010 . Apart from this small shift, our spectrum is consistent with both previous spectra as the level of statistics is insufficient to reveal the small discrepancies in the region around MeV. Thus, our analysis shows that the spectrum of Ref. azuma1994 is both supported by the better fit quality and in better agreement with the energy calibration of the present spectrum.
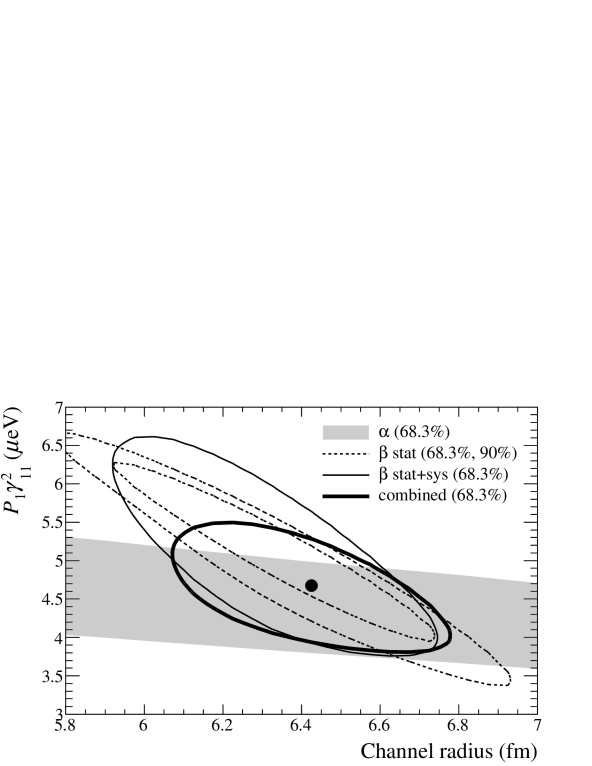
Sub-Coulomb -transfer reactions provide an alternative route to determining by constraining the ANC of the 7.12-MeV level which is related to via Eq. (44) in Ref. deBoer2017 . Adopting the most recent and most precise ANC value of fm-1 avila2015 and assuming the channel radius to be fm (the 68.3% confidence interval determined from the -decay data, see the figure in Supplemental Material.), we obtain eV in good agreement with Eq. (1). The weighted average of the two is eV, when statistical and systematic uncertainties are combined in quadrature, yielding a relative uncertainty of 12%. We note that the less precise ANCs obtained in three previous -transfer studies are in good agreement with that of Ref. avila2015 .
In conclusion, we have obtained the first accurate normalization of the -delayed spectrum of 16N and resolved a significant discrepancy between two previous high-precision measurements of the spectral shape. The branching ratio for -delayed emission is found to be 33% larger than previously held and the value of inferred from the spectrum is increased by the same factor. Our value for is in good agreement with the value inferred from sub-Coulomb transfer studies and has comparable precision. The weighted average of the two has an uncertainty of 12%. Since the dominant term in the expression for the capture cross section is proportional to , our result implies that indirect measurements alone now constrain the capture cross section to within close to 12%, a remarkable result considering the large variability in the values reported over the last 60 years (Table IV of Ref. deBoer2017 ). By further including direct measurements of the capture cross section as well as -scattering data it may be possible to reduce the uncertainty even further. Considering the progress made in recent years in constraining the other components of the cross section, it may finally be possible to bring the uncertainty on the total cross section at 0.3 MeV below 10%.
Acknowledgements
Acknowledgements.
We are grateful to the ISOLDE technical staff for providing excellent running conditions during the experiment, and thank the anonymous reviewers for their valuable comments and suggestions to improve the quality of the manuscript. This work has been supported by the European Research Council under the ERC starting grant LOBENA, No. 307447, the Horizon 2020 Research and Innovation Programme under grant agreement No. 654002, the Spanish MINECO through projects FPA2015-64969-P, FPA2015-65035-P, and FPA2017-87568-P, the Romanian IFA grant CERN/ISOLDE, the United Kingdom Science and Technology Facilities Council, the FWO-Vlaanderen (Belgium) and GOA/2010/010 (BOF KU Leuven), the German BMBF under contract 05P15PKCIA (ISOLDE) and Verbundprojekt 05P2015. BJ acknowledges support from The Royal Society of Arts and Sciences in Gothenburg and OSK from the Villum Foundation through project no. 10117.Supplemental Material
The thickness of the catcher foil was determined from the energy loss of particles from a standard spectroscopy source. The thickness was found to be g/cm2 before the run and g/cm2 after the run, indicating negligible changes in foil properties during the experiment. The two peaks in the spectrum of 18N were fitted with a Gaussian function, representing the experimental resolution, convoluted with the -recoil broadening function appropriate for a pure GT transition with the spin sequence clifford1989 (34). This broadening function has the approximate shape , where is the deviation from the mean -particle energy expressed as a fraction of the maximum deviation (36.3 keV for the 1081-keV peak and 38.3 keV for the 1409-keV peak). The experimental resolutions quoted in the Letter (30 keV for the two 60-m DSSDs and 70 keV for the 40-m DSSD) refer to the full width at half maximum (FWHM) of the Gaussian function. For the decay of 16N, the -recoil broadening function was approximated by a Gaussian with a width of 15 keV FWHM azuma1994 . This width was added in quadrature with the experimental resolution to obtain the full Gaussian resolution for the -matrix fit.
We use the -matrix parametrization of Ref. brune2002 (35) in which the spectrum is calculated as the incoherent sum of -wave () and -wave () components given by,
| (2) |
where is the number of observed particles, is the -decay phase-space factor, is the penetration factor, is the feeding amplitude, is the reduced width, is the level matrix, and the summation runs over the levels in the model. For bound levels, the feeding amplitude is given by barker1988 (36),
| (3) |
where is the branching ratio to the level in question, is the branching ratio for delayed decay, and is the shift factor. Thus, to keep the product constant and thereby preserve the spectral shape, we must have . The best-fit parameters for the spectrum of Ref. azuma1994 are given in Table 1 where is the level energy relative to the C threshold of 7161.92 keV.
| Level () | (MeV) | (MeV1/2) | |
|---|---|---|---|
| 11 | |||
| 21 | |||
| 31 | |||
| 13 | |||
| 23 |
As mentioned in the Letter, the -matrix distribution obtained from the fit to the spectrum of Ref. tang2010 is slightly wider and shifted by keV relative to that obtained from the spectrum of Ref. azuma1994 . We have confirmed this result using the best-fit parameters given in the respective papers azuma1994 ; tang2010 . On the other hand, Ref. deBoer2017 determines the shift to be only keV (their TABLE IX). While it is difficult for us to pinpoint the reason for this deviation with complete certainty, we note that the 1-sigma resolutions adopted by the authors of Ref. deBoer2017 for the spectra of Refs. azuma1994 ; tang2010 were in fact FWHM resolutions, implying that the resolution was greatly overestimated in their fits. (The authors of Ref. deBoer2017 have acknowledged this error to us in private communication.)
In Fig. 5 we compare the constraints imposed on by the present work to the constraints imposed by the most recent and precise -transfer study avila2015 . For the -decay data, statistical and systematic uncertainties were added in quadrature. The combined confidence region was determined with equal weights assigned to the two data sets.
References
- (1) R. J. deBoer et al., Rev. Mod. Phys. 89, 035007 (2017).
- (2) H. O. U. Fynbo and C. A. Diget, Hyperfine Interactions 223, 103 (2014).
- (3) C. Tur et al., Nucl. Instrum. Meth. A 594, 66 (2008).
- (4) T. Kibédi et al., EPJ Web of Conferences 35, 06001 (2012).
- (5) F. C. Barker, Aust. J. Phys. 24, 777 (1971).
- (6) J. Humblet, B. W. Filippone, and S. E. Koonin, Phys. Rev. C 44, 2530 (1991).
- (7) L. Buchmann, G. Ruprecht, and C. Ruiz, Phys. Rev. C 80, 045803 (2009).
- (8) R. E. Azuma et al., Phys. Rev. C 50, 1194 (1994).
- (9) X. D. Tang et al., Phys. Rev. C 81, 045809 (2010).
- (10) H. Hättig, K. Hünchen, and H. Wäffler, Phys. Rev. Lett. 25, 941 (1970).
- (11) R. H. France III et al., Phys. Rev. C 75, 065802 (2007).
- (12) R. Catherall et al., J. Phys. G: Nucl. Part. Phys. 44, 094002 (2017).
- (13) O. S. Kirsebom, in preparation.
- (14) J. Ramos et al., Nucl. Instrum. Meth. B 320, 83 (2014).
- (15) H. Fynbo, O. S. Kirsebom, and O. Tengblad, J. Phys. G: Nucl. Part. Phys. 44, 044005 (2017).
- (16) O. S. Kirsebom et al., Phys. Rev. C 83, 065802 (2011).
- (17) K. I. Hahn, C. R. Brune, and P. R. Wrean, Phys. Rev. C 48, 914 (1993).
- (18) D. Tilley, H. Weller, and C. Cheves, Nucl. Phys. A 564, 1 (1993).
- (19) D. Tilley, H. Weller, C. Cheves, and R. Chasteler, Nucl. Phys. A 595, 1 (1995).
- (20) M. Dombsky et al., Phys. Rev. C 49, 1867 (1994).
- (21) J. Phys. G: Nucl. Phys. 8 (1982) 743.
- (22) C. Sotty and R. Lica, in preparation.
- (23) C. H. Millar, G. A. Bartholomew, and B. B. Kinsey, Phys. Rev. 81, 150 (1951).
- (24) B. J. Toppel, Phys. Rev. 103, 141 (1956).
- (25) D. E. Alburger, A. Gallmann, D. H. Wilkinson, Phys. Rev. 116 (1959) 939.
- (26) E. K. Warburton, D. E. Alburger, and D. J. Millener, Phys. Rev. C 29, 2281 (1984).
- (27) A. R. Heath and G. T. Garvey, Phys. Rev. C 31, 2190 (1985).
- (28) W. Kaufmann and H. Wäffler, Nucl. Phys. 24 (1961) 62.
- (29) Z. Zhao, et al., Phys. Rev. C 48 (1993) 429.
- (30) J. Refsgaard et al., Phys. Lett. B 752, 296 (2016).
- (31) M. L. Avila et al., Phys. Rev. Lett. 114, 071101 (2015).
- (32) M. Munch, O. S. Kirsebom, and J. Refsgaard,“Open R-matrix” doi:10.5281/zenodo.1174079 (2018).
- (33) Possible reasons for the discrepancies between the spectra of Refs. azuma1994 ; tang2010 are discussed in Ref. buchmann2009 .
- (34) E. T. H. Clifford al., Nucl. Phys. A 493 (1989) 293–322.
- (35) C. R. Brune, Phys. Rev. C 66, 044611 (2002).
- (36) F. C. Barker and E. K. Warburton, Nucl. Phys. A 487, 269 (1988).