Observation of transition from semiconducting to metallic ground state in high-quality single crystalline FeSi
Abstract
We report anomalous physical properties of single-crystalline FeSi over a wide temperature range 1.8-400 K. X-ray diffraction, specific heat, and magnetization measurements indicate that the FeSi crystals synthesized in this study are of high quality with a very low concentration of magnetic impurities (0.01). The electrical resistivity () can be described by activated behavior with an energy gap = 57 meV between 67 K and 150 K. At temperatures below 67 K, () is significantly lower than an extrapolation of the activated behavior, and the Hall coefficient and magneto-resistivity undergo a sign change in this region. At 19 K, a transition from semiconducting to metallic-like behavior is observed with deceasing temperature. Whereas the transition temperature is very robust in a magnetic field, the magnitude of the resistivity below 30 K is very sensitive to magnetic field. There is no indication of a bulk phase transition or onset of magnetic order in the vicinity of either 67 K or 19 K from specific heat and magnetic susceptibility measurements. These measurements provide evidence for a conducting surface state in FeSi at low temperatures.
pacs:
Valid PACS appear hereI Introduction
The transition metal silicides FeSi, MnSi, CoSi, and CrSi, have the B20 crystal structure, which is the only group in the cubic system without an inversion center. These compounds exhibit rich physical phenomena that are of great interest for fundamental understanding and potential applications. For example, the -electron compound FeSi shows a remarkable similarity to -electron Kondo insulators, and the electrical resistivity () evolves continuously with decreasing temperature from metallic behavior (d/d 0) to strongly correlated semiconducting behavior (d/d 0) Jaccarino et al. (1967); Z. Schlesinger and Aeppli (1993); Sales et al. (1994); mandrus1995thermodynamics; Paschen et al. (1997). A considerable amount of theoretical effort Takahashi and Moriya (1979); Aeppli and Fisk (1992); Fisk et al. (1995); Varma (1994); Fu and Doniach (1995); Anisimov et al. (1996) has been expended to explain the strong temperature dependence of the magnetic susceptibility () of FeSi which reaches a maximum value at around 500 K Jaccarino et al. (1967) that is not related to magnetic order Wertheim et al. (1965); Kohgi and Ishikawa (1981).
The ground state of FeSi is considered to be non-magnetic; however, experimental investigations of FeSi at low temperature reveal features that are sample dependent and are not well understood Paschen et al. (1997); Jarlborg (1995); Sun et al. (2014). The published results are consistent in terms of the small semiconducting energy gap of 50-60 meV in the temperature range of 70-170 K. However, further decrease of the temperature results in either saturation steps Paschen et al. (1997), a hump (shoulder) at 70 K Sun et al. (2014); Petrova et al. (2010) or 35 K Mihalik et al. (1996), a moderate increase of with decreasing temperature below 40 K Bocellip et al. (1995) or 50 K Schlesinger et al. (1993), or a saturation below about 5 K Hunt et al. (1994) of (). Besides, the values of below 70 K reported by these references are also very different, indicating strong sample dependence of the electrical transport behavior. It has been well established in experiments that the electrical properties of semiconductors can be very sensitive to external dopants. Brian et al. (2011); Dietl (2010); Fang et al. (2015a) To investigate the intrinsic physical properties of FeSi, we prepared high quality single-crystal samples of FeSi and performed various physical property measurements over a wide temperature range of 1.8-400 K. Anomalous electrical transport behavior associated with a change in primary charge carriers and negative magneto-resistivity at low temperatures were observed in all of the samples. We also report metallic conducting behavior of FeSi single crystals below 19 K, yielding evidence for a conducting surface state, consistent with specific heat, magneto-resistivity, and magnetization measurements.
II Experimental details
Single-crystalline samples of FeSi were grown in high-temperature Sn flux with Fe: Si molar ratio of 1: 1. The quality of the FeSi samples was assessed by means of single crystal X-ray diffraction at room temperature. A Bruker Apex II X-ray diffractometer with Mo Kα1 ( = 0.71073 Å) radiation was used to measure the scattering intensity. The crystal structure was refined with SHELXTL package Sheldrick (2008). Electrical resistivity, magneto-resistivity, Hall effect, and specific heat measurements were performed in a Quantum Design Physical Property Measurement System (PPMS) DynaCool. The magnetization and magnetic susceptibility measurements were carried out in a Quantum Design Magnetic Property Measurement System (MPMS) Fang et al. (2015b).
III Results and Discussion

The FeSi single crystals grow along the [111] direction in the Sn flux, resulting in bar-shaped samples. The results of single-crystalline X-ray diffraction on FeSi are shown in Fig. 1. Consistent with previous studies, stoichiometric FeSi crystallizes in the cubic chiral structure with space group 213 (20-type) and lattice parameter = 4.4860(5) Å. No vacancies were observed according to the refinement. The resulting profile residual Rp is 1.79 with weighted profile residual Rwp 4.11. No electron density residual was detected, indicating the high quality of the FeSi crystals.
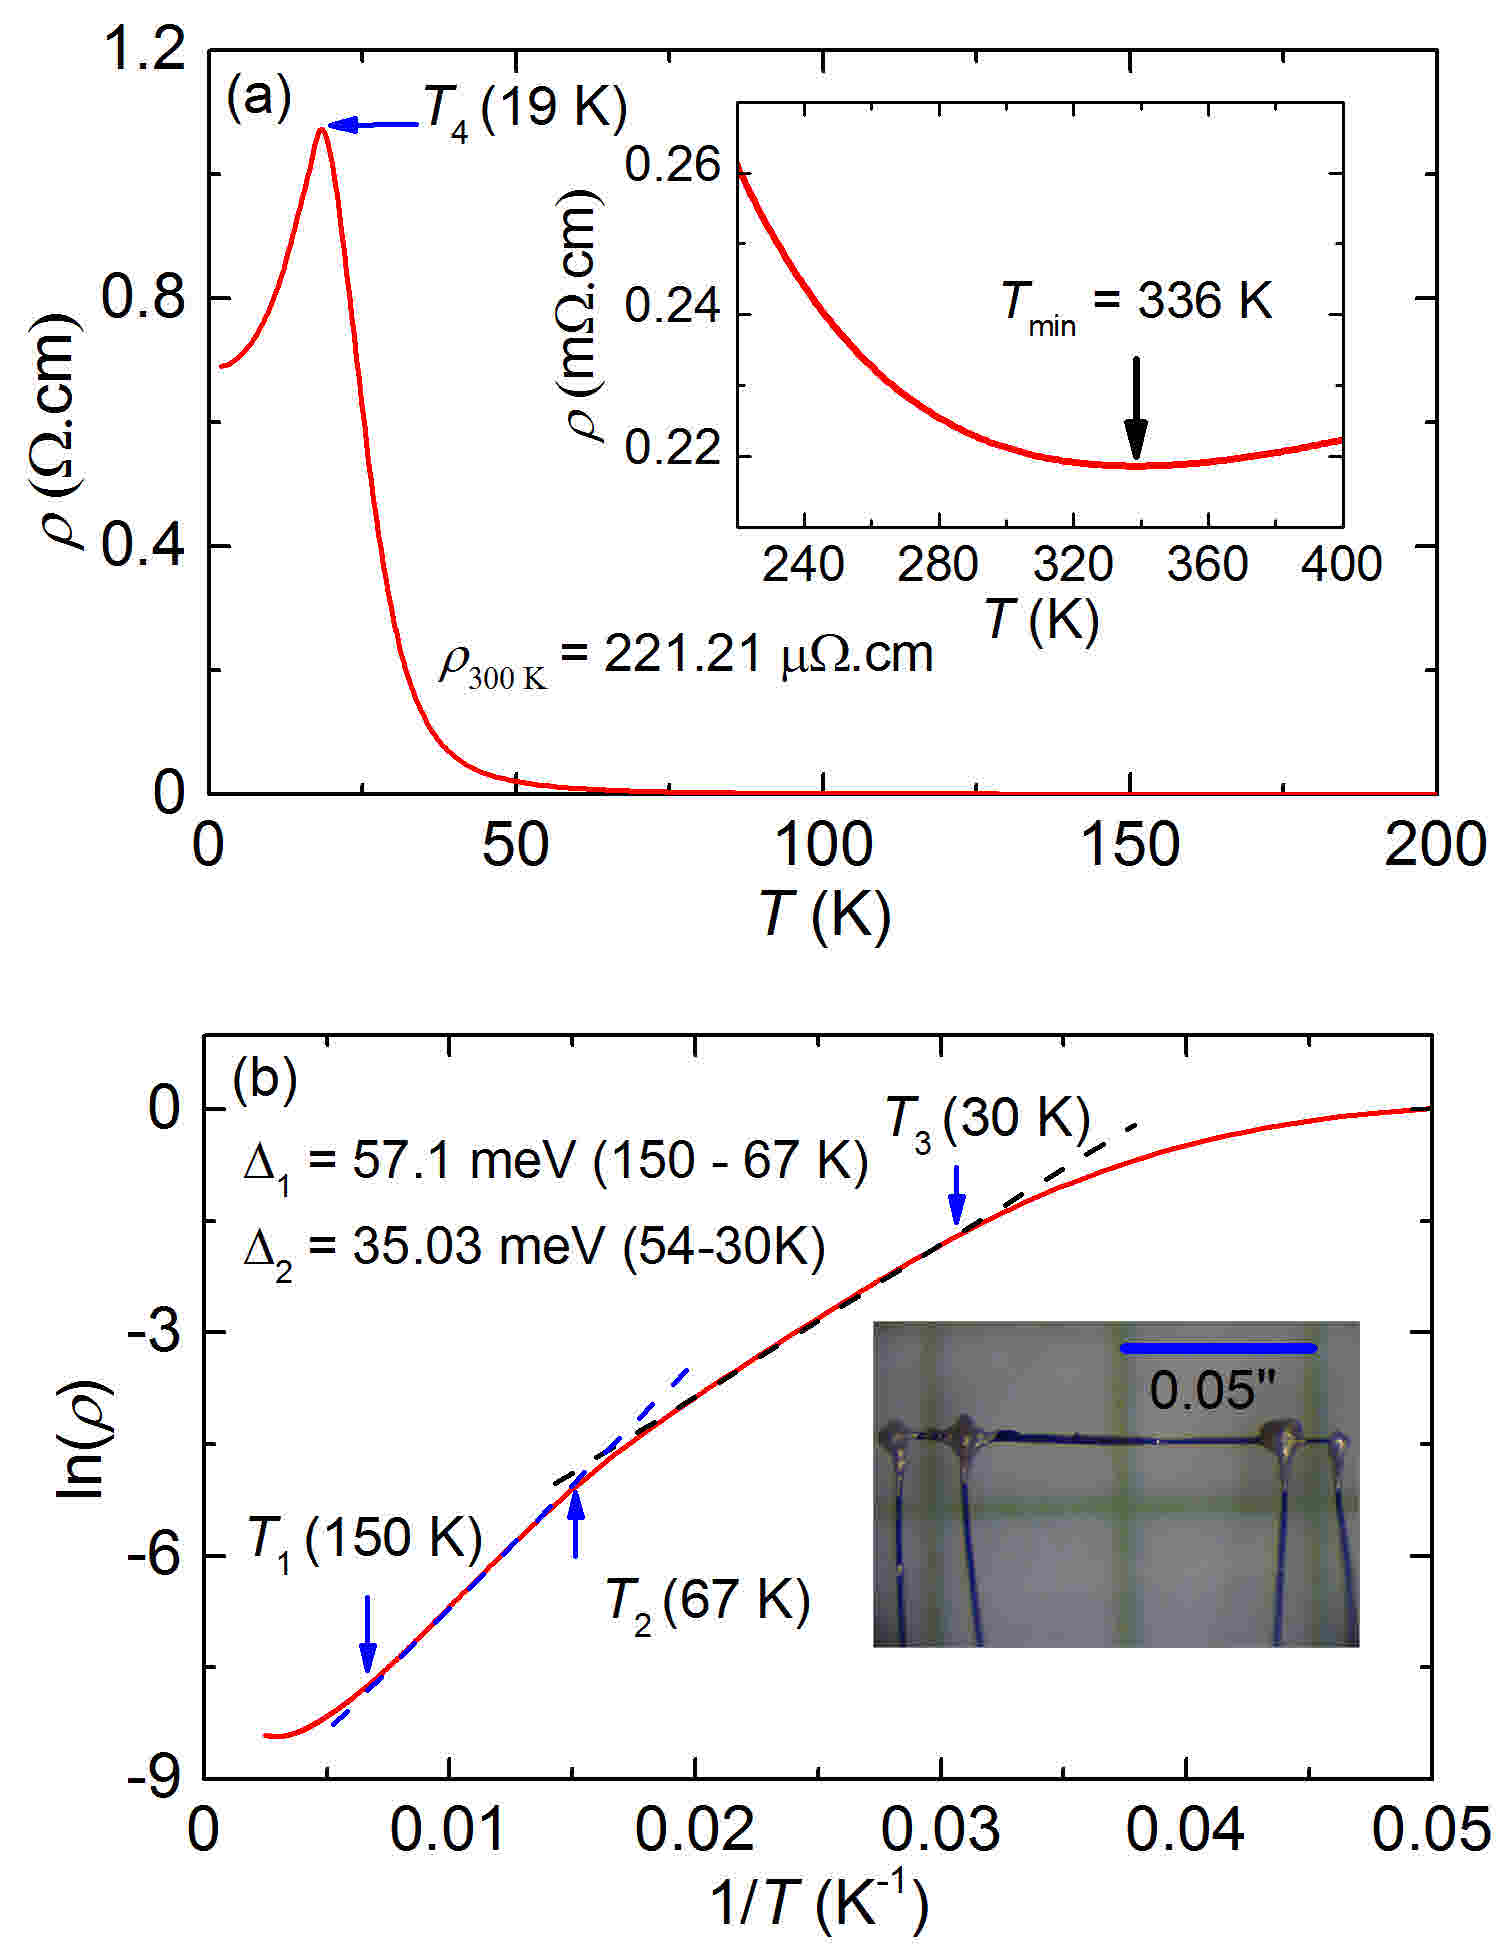
Because of their bar-shape and high quality, the FeSi single crystals are very suitable for electron transport measurements along the [111] direction. Upon cooling from 400 K, metallic-like behavior can be observed down to 336 K, below which the resistivity increases with decreasing temperature, resulting in a minimum in () at = 336 K (see the inset of Fig. 2(a)). Similar features can also be found in other references with values of mostly in the range 150-300 K) Samuely et al. (1996); Wolfe et al. (1965); Buschinger et al. (1997); Paschen et al. (1997). Decreasing the temperature further results in a gradual enhancement of semiconducting behavior down to 152 K, which has been reported to be related to the opening of a semiconducting energy gap Ishizaka et al. (2005); Arita et al. (2008); Klein et al. (2008).
A plot of ln() vs. (1/) for FeSi shown in Fig. 2(b) is linear in the temperature range 152 K () to 67 K (), consistent with standard activated behavior with an energy gap = 57.1 meV; this value of is comparable to previously reported gap values of 50-60 meV Petrova et al. (2010); Schlesinger et al. (1993); Jaccarino et al. (1967); Sales et al. (1994). From 54-30 K, where the relation ln() vs. 1/ is also linear, the value of ln()/d(1/) corresponds to am energy gap of 35 meV. Below 30 K (), the () curve cannot be described by a standard activation model. Further decrease of the temperature below 19 K () results in a decrease of with decreasing temperature as shown in Fig. 2(a). As the phenomena observed in () below are quiet different from the electrical transport behavior of FeSi reported in other references, we repeated the measurements on five different FeSi single crystals which yielded the same results.
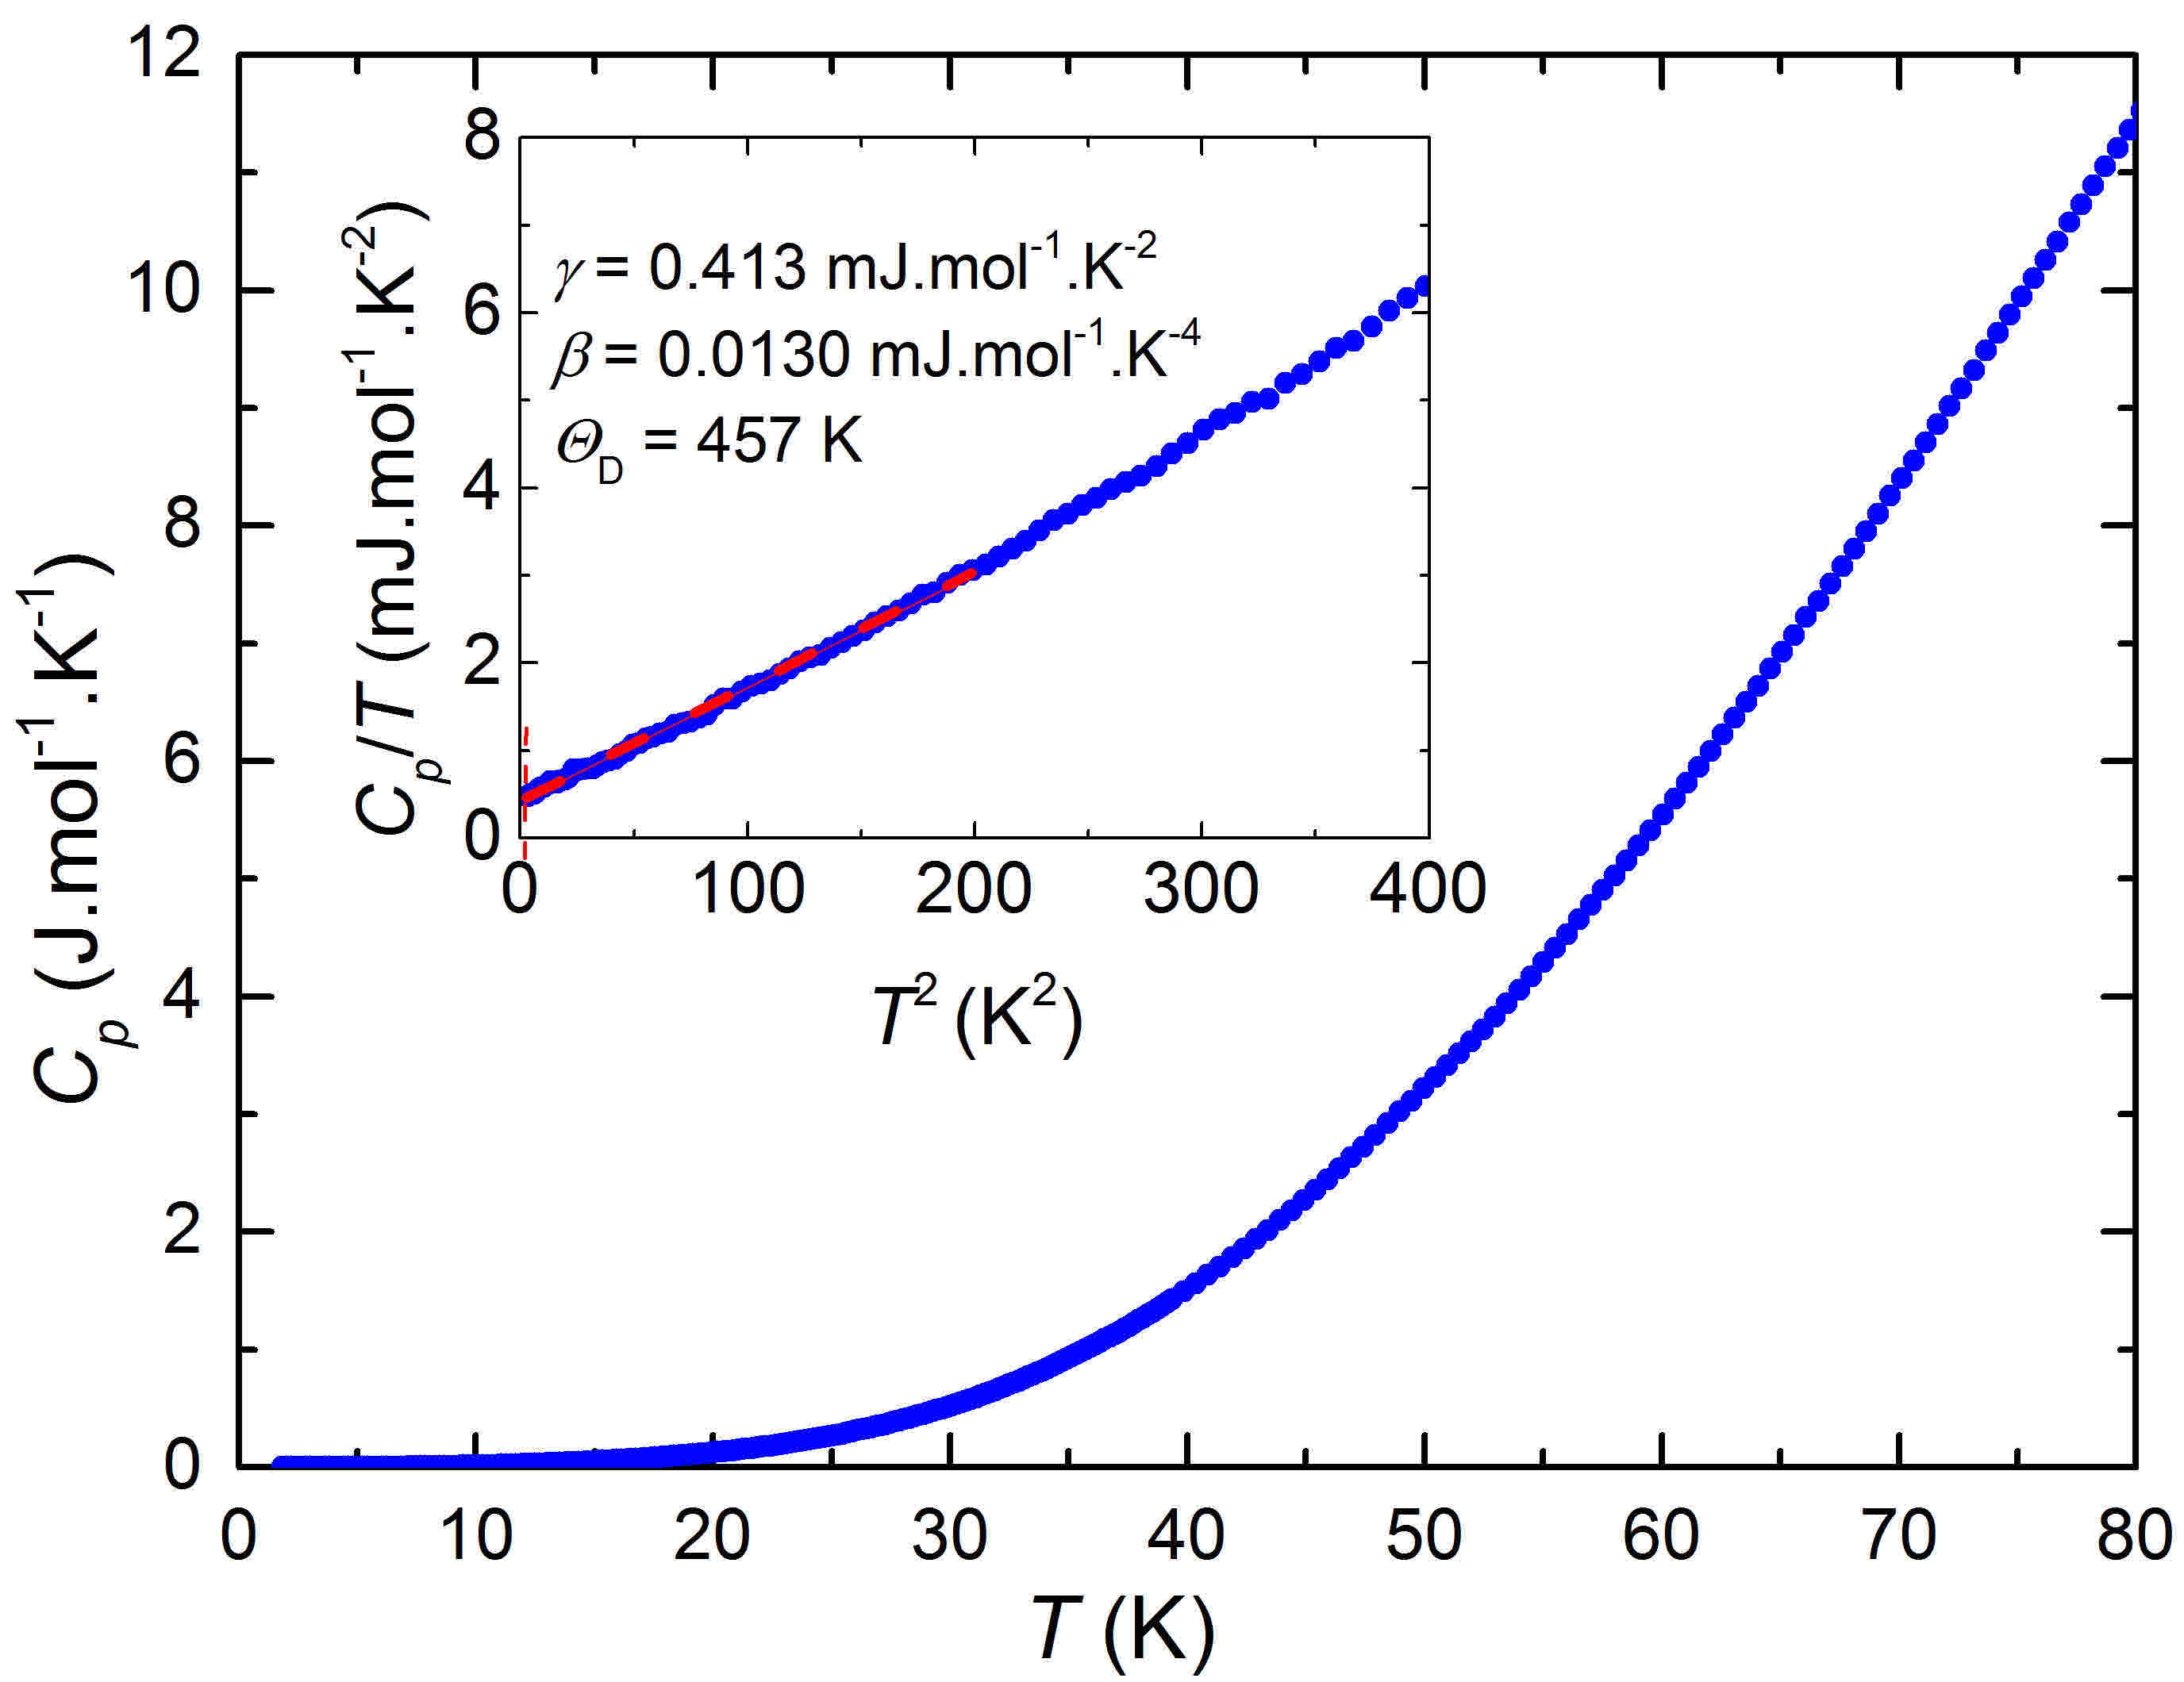
For a better understanding of the temperature dependence of the observed electrical transport behavior, especially the metallic conducting behavior, we performed specific heat () measurements on the samples down to 1.8 K, the results of which are shown in Fig. 3. The specific heat () can be reasonably well described by the sum of electronic and lattice contributions at low temperatures = + . No anomalies at = 67 K, = 30 K, and = 19 K can be observed, indicating the absence of any bulk phase transitions in FeSi at these temperatures. The estimated value of the Debye temperature D of 457 K lies within the range of 377-515 K previously reported Paschen et al. (1997); Takahashi et al. (2000); Marklund et al. (1974). On the other hand, the electronic specific heat coefficient is estimated to be 0.41 mJ.mol-1.K-2, which is only about 8-30 of previously reported values Paschen et al. (1997), suggesting that the samples studied in this work have a lower concentration of electron donor impurities, as the value of is proportional to the density of electronic states at the Fermi level. The metallic-like conduction below = 19 K exhibited by the FeSi samples in this work is dramatically different from the semiconducting behavior observed in other FeSi samples which have higher concentrations of charge carriers. The seemingly contradictory phenomena suggest that the metallic conduction observed in this study is unlikely to be a bulk phenomenon, which is also supported by the absence of phase transition features in the () data.
The temperature dependence of the magnetic susceptibility () for FeSi is shown in Fig. 4. Above 100 K, the value of susceptibility increases with increasing temperature, which is similar to the behavior of () for an antiferromagnet at temperatures below the Néel temperature. In the temperature range 20-100 K, () is very small 0.15 emu.mol-1.T-1, indicating a very weak response of FeSi to external magnetic field and a non-magnetic ground state for FeSi. Below 15 K, () of FeSi has a Curie-Weiss like upturn with decreasing temperature, which is believed to be associated with magnetic impurities Jaccarino et al. (1967); Wertheim et al. (1965). In this study, however, the magnitude and the onset temperature of the () upturn is significantly smaller and lower, respectively, than previously reported values Koyama et al. (1999); Mihalik et al. (1996); Petrova et al. (2010), indicating lower magnetic impurity concentration for the present samples. The kink observed in the () curve at around 2 T indicated by the arrow in the inset of Fig. 4 is also consistent with the paramagnetic impurity scenario. Above 2 T, it seems that the magnetic field does not dramatically affect the magnetization of the samples, which also suggests the absence of magnetic order at low temperatures. The results of the magnetic measurements reveal that the samples are of high quality and the transitions observed around = 67 K and = 19 K in the () curve are not related to any bulk magnetic transitions.
In this study, the magnetization of FeSi can be well described by using the following Langevin functions:
| (1) |
in which is the magnetic moment of the impurity clusters and is the saturation magnetization. The corresponding fitting of () at 3.5 K gives = 2.4331020 B/mol and = 7.95 B. If we assume that the magnetic moment per impurity atom is 3 as in pure iron, the concentration of impurity Fe atoms is only about 130 ppm per Fe atom, which is significantly lower than the impurity concentration previously estimated for single crystal specimens of FeSi Koyama et al. (1999); Wertheim et al. (1965). The fitting results also show that, on average, there is only about 2-3 magnetic impurity atoms in each cluster, indicating atomic size magnetic clusters.

Figure 5 shows () data for FeSi under external magnetic field. At high temperatures, the values of are almost independent of the applied magnetic field; however, a negative magneto-resistivity (), where = (3T - 0T)/0T, can be observed around 70 K as indicated by the arrow in the inset of Fig. 5. that becomes very significant below 30 K, which is very close to the temperatures = 67 K and = 30 K, respectively. It should be mentioned that previous studies of the are not consistent: A negative was reported by Paschen below 30 K and attributed to quantum interference effects Paschen et al. (1997); however, a change of sign at around 70 K (close to = 67 K in this study) was reported later below which the is positive Sun et al. (2014). In this study, the negative reaches a minimum value at = 19 K. The peak in the absolute value of the in this study is about 20, which is obviously higher than the peak in the absolute value of the reported in Refs. Paschen et al. (1997) and Sun et al. (2014), revealing the dependence of the on sample quality. While () is very sensitive to the applied field at low temperatures, the value of seems independent of , which provides additional evidence that the transition observed in () around is not related to magnetic order.
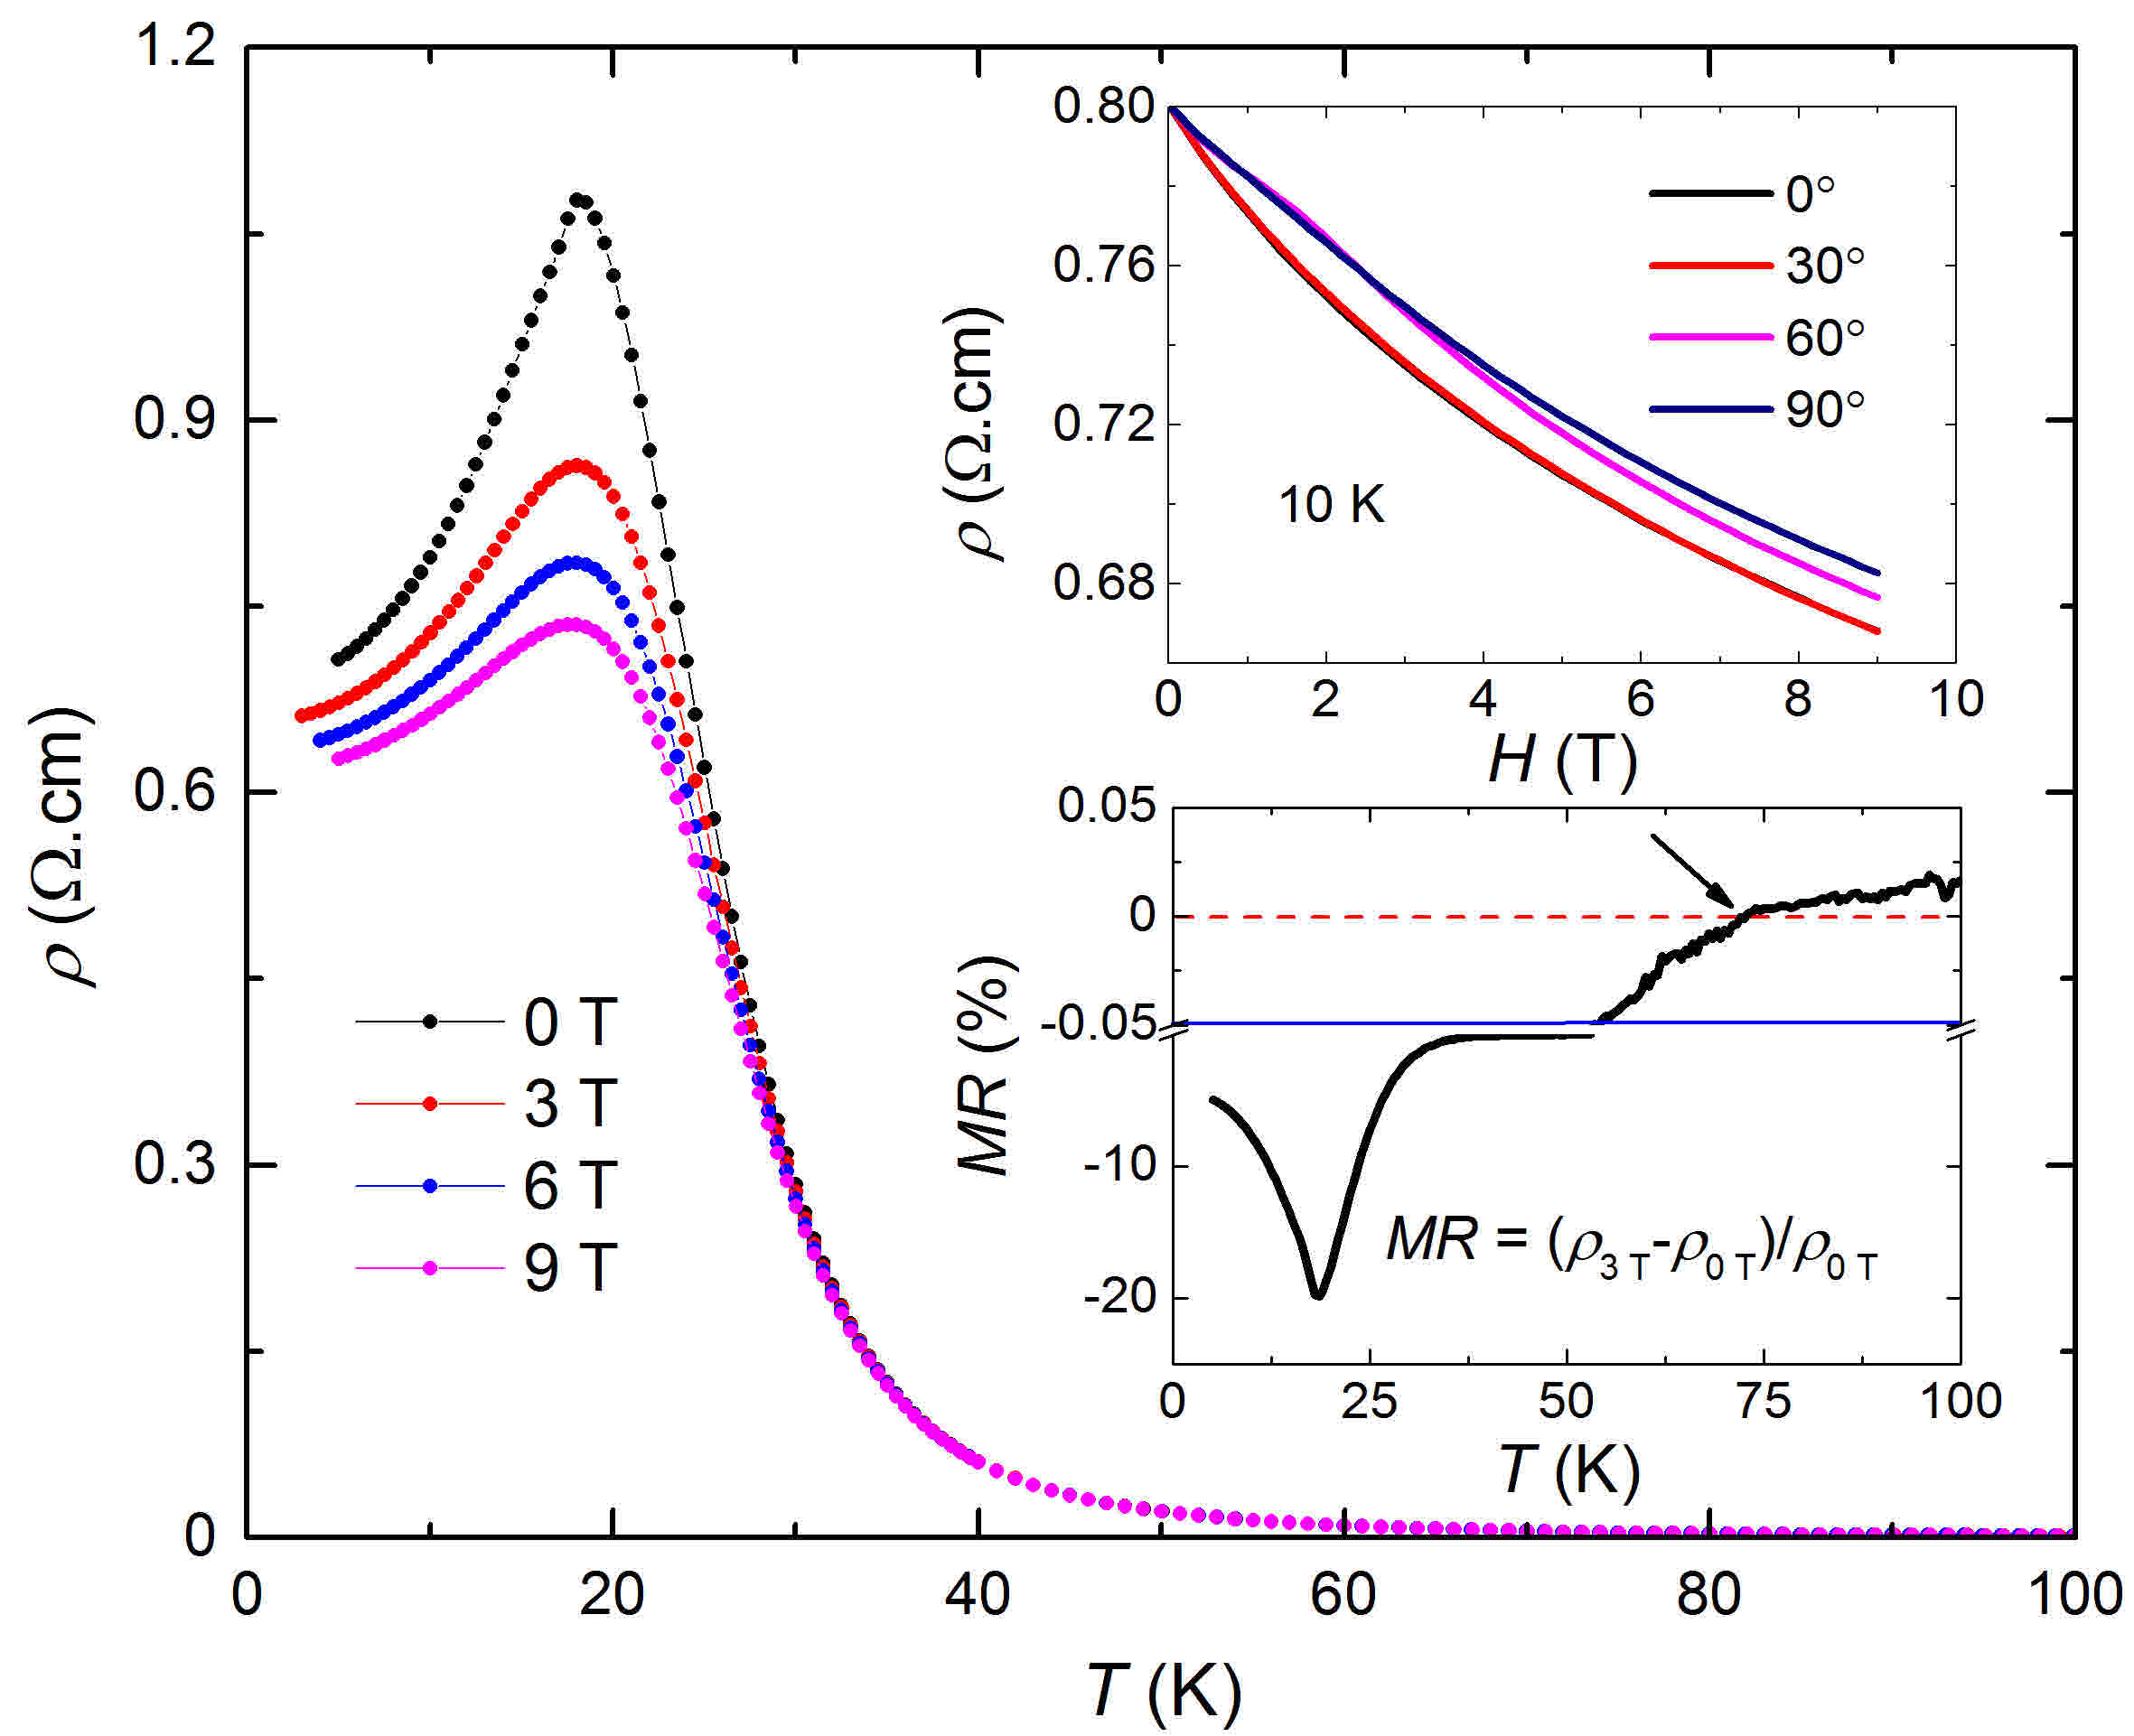
The evolution of as a function of at several angles of with respect to the long axis of the FeSi crystal at 10 K is shown in the upper inset of Fig. 5. The value of is suppressed with increasing field, but the evolution of () deviates slightly from a linear relation. The angle between the directions of the applied field and the current () has only a slight effect on the values of (). However, the negative is still very remarkable in the case that the applied field is parallel to the current (parallel to the surface of the sample), which is inconsistent with the behavior of topological insulators. This behavior can be qualitatively understood by considering both bulk and surface electron conduction for FeSi. The negative can be observed at temperature which is far above , suggesting that the negative is a bulk phenomenon. If we assume that the response of surface resistivity to external field is positive due to the additional scattering of free electrons by the Lorentz force, increasing will increase the effective applied field on the sample’s surface and thus slightly enhance the .
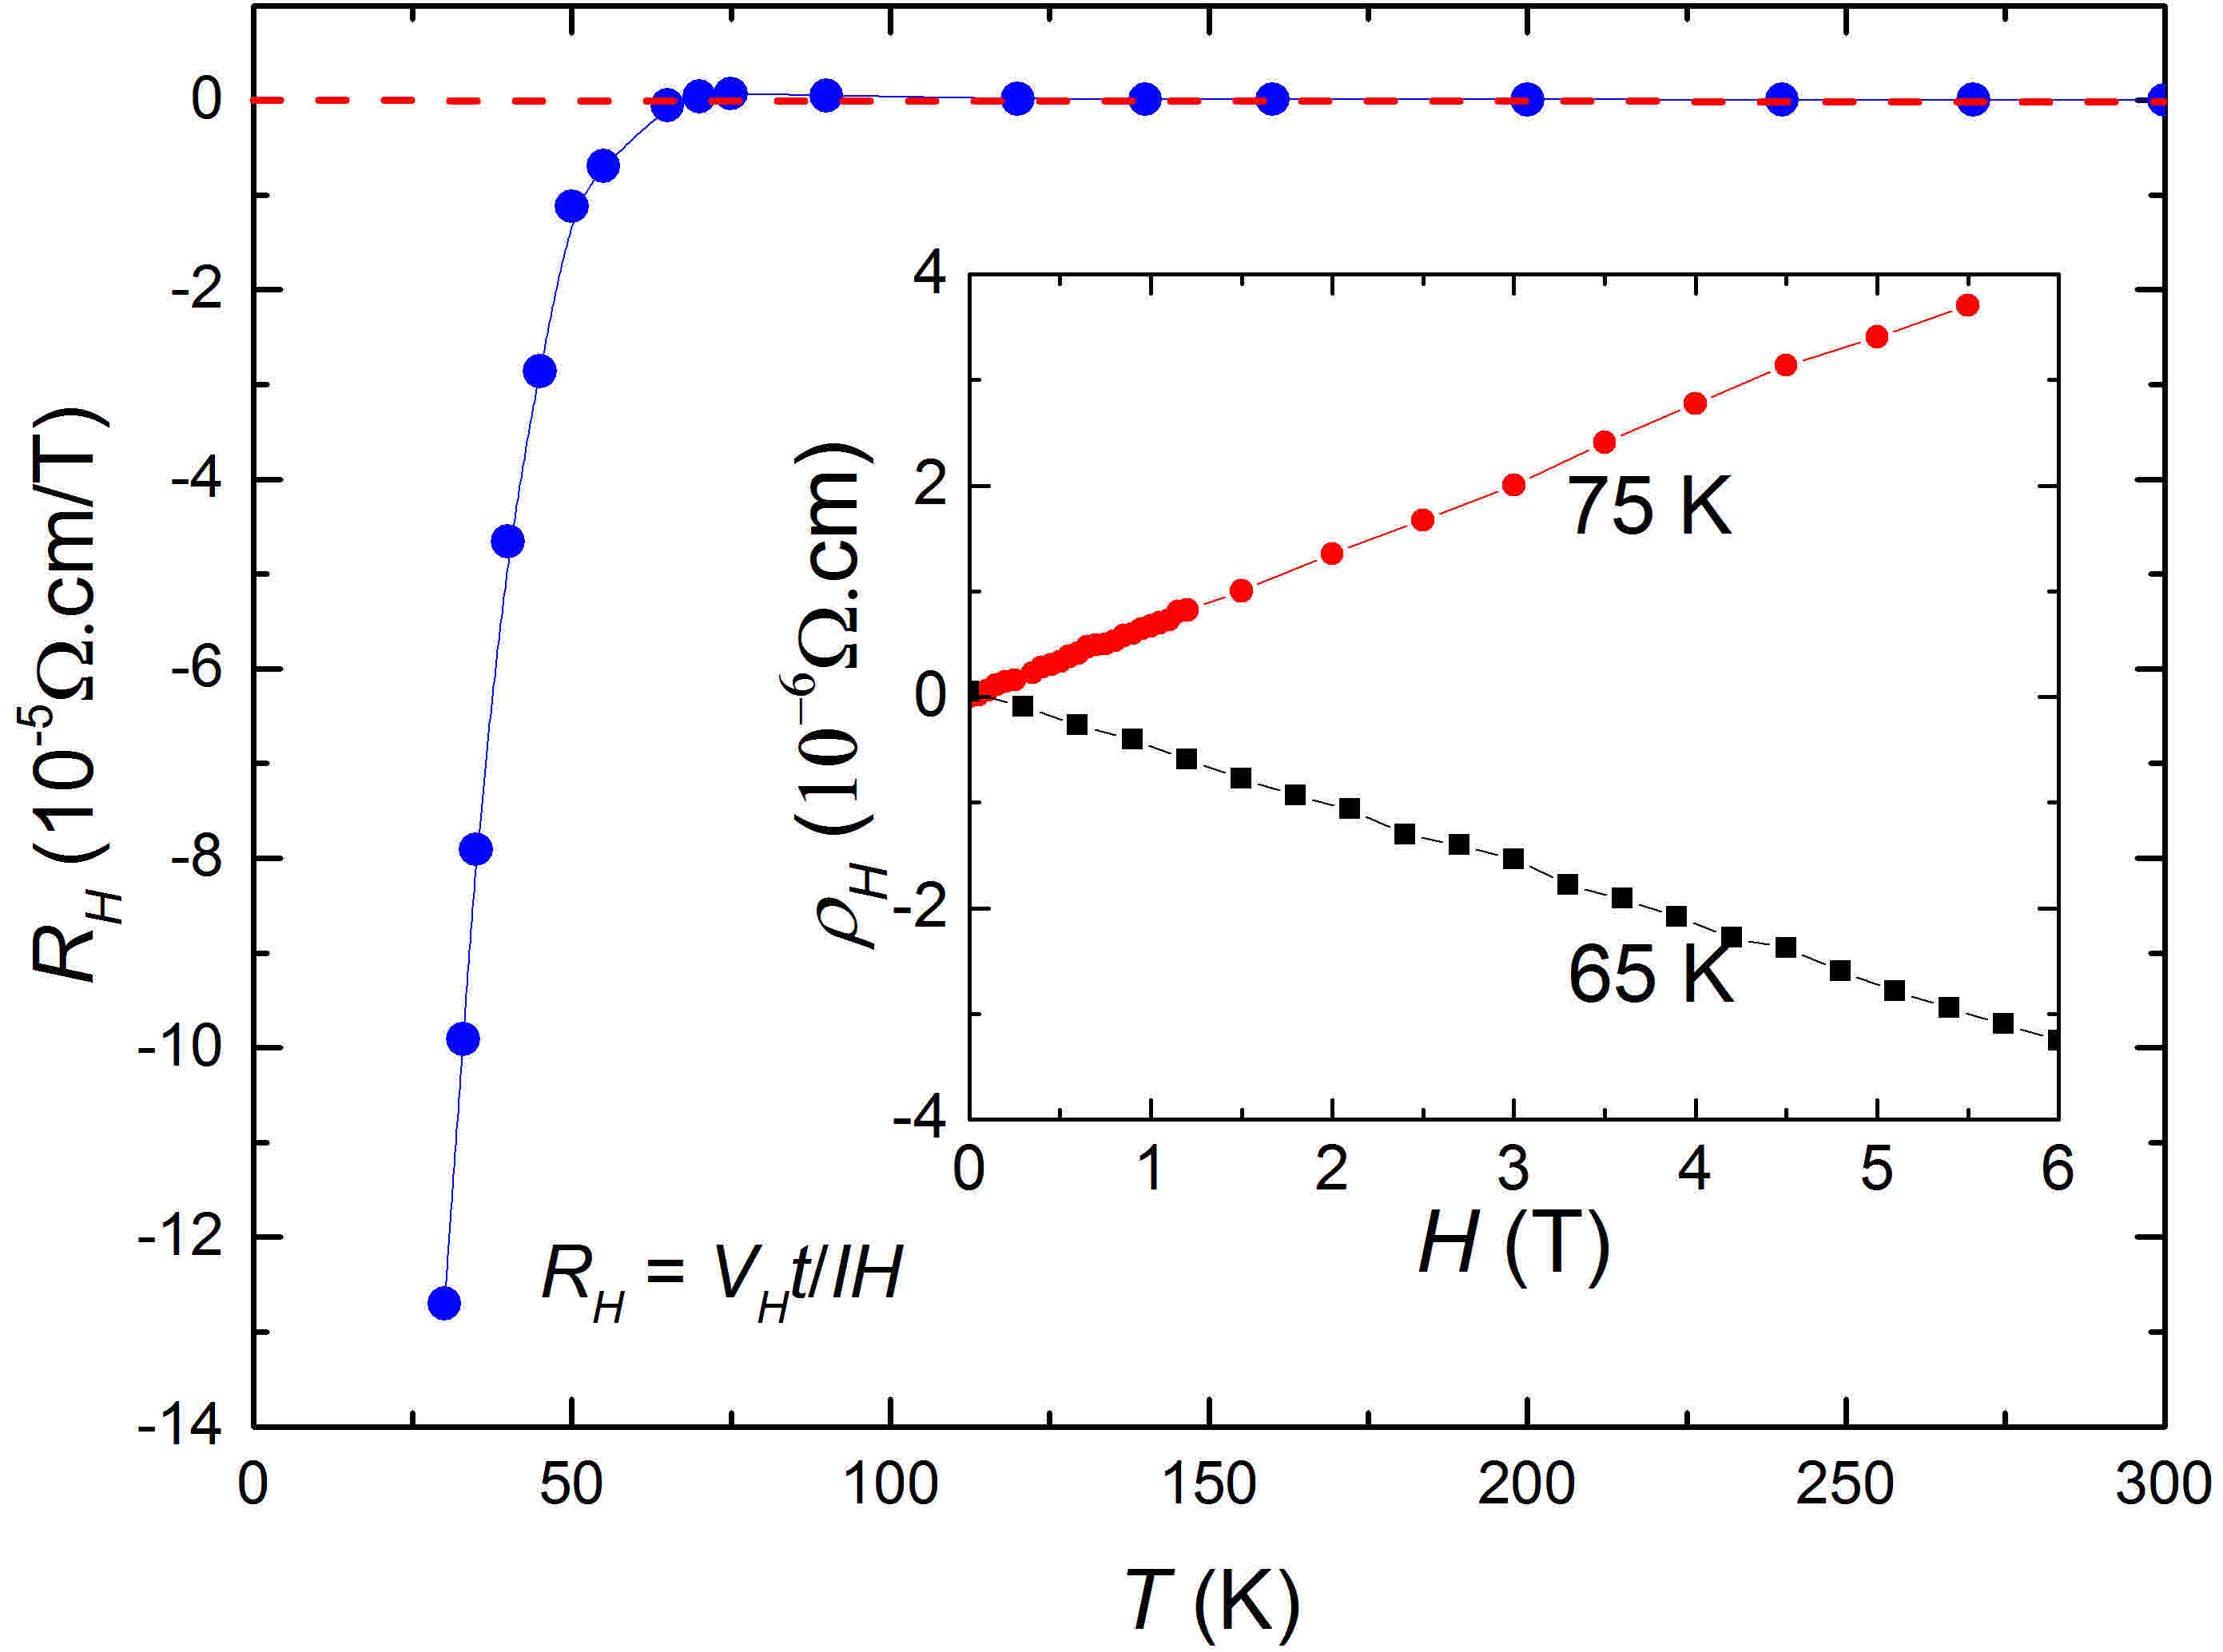
The main results of the Hall effect measurements at temperatures down to 30 K are displayed in Fig. 6. Unlike the results of previous reports Paschen et al. (1997), linear relations of the Hall resistivity vs. applied external field can be seen up to 9 T over a wide temperature range above 30 K (see the inset of Fig. 6). At high temperatures, the Hall coefficient is positive and increases slightly with decreasing temperature, indicating that the dominant charge carriers are electrons (which is understandable as the mobility of electrons in intrinsic semiconductors are usually much higher than that of holes). However, a change of sign of is observed at 68 K, which is very close to = 67 K and to the temperature of the sign change of the . The phenomena observed in the (), (), and () measurements are consistent with one another, indicating that there is a electronic phase transition at around = 67 K below which the resistivity is dominated by hole conduction and is sensitive to external field.
IV Summary
In summary, the following conclusions can be drawn from this study:
(1) The electron transport behavior of FeSi is highly sensitive to sample quality. High quality of the single crystal samples in this study is supported by X-ray diffraction, specific heat, and magnetization measurements.
(2) In the temperature range 150-67 K, the semiconducting energy gap is 57 meV. Below 67 K, a much smaller energy gap and a sign change of magneto-resistance and Hall coefficient are observed.
(3) Further decrease of the temperature results in a sharp reversible transition from a negative slope to a positive slope of () at 19 K. Corresponding magnetization and magneto-resistivity measurements suggest that there is no magnetic order associated with this transition. Furthermore, no feature can be observed in specific heat measurements. The results indicate that the metallic conduction behavior below is probably a surface phenomenon.
(4) We should also emphasize that the intrinsic response of FeSi to an external magnetic field is almost zero below 100 K; however, a significantly large negative magneto-resistivity which reaches its maximum value at = 19 K is observed in the resistivity measurements. Considering the possibility that a trivial signal can not be observed in the MPMS, the contradictory phenomena also suggests the existence of a special surface state that contributes additional electronic conductivity to the samples.
(5) This study cannot provide a clear picture of the surface state of FeSi and the possibility that FeSi as a topological insulator cannot be ruled out. Further investigations of the electronic states on the surface are needed to explore this possibility.
V Acknowledgements
Helpful discussions with Zachary Fisk and James Allen are greatly appreciated. Materials synthesis and characterization at UCSD was supported by the US Department of Energy, Office of Basic Energy Sciences, Division of Materials Sciences and Engineering, under Grant No. DEFG02-04-ER46105. Low temperature measurements at UCSD were sponsored by the National Science Foundation under Grant No. DMR 1206553. Single crystalline X-ray diffractions by WX at LSU was supported by LSU startup funding.
References
- Jaccarino et al. (1967) V. Jaccarino, G. K. Wertheim, J. H. Wernick, L. R. Walker, and S. Arajs, Physical Review 160, 476 (1967).
- Z. Schlesinger and Aeppli (1993) H.-T. Z. M. B. M. J. D. Z. Schlesinger, Z. Fisk and G. Aeppli, Phys. Rev. Lett 71, 1748 (1993).
- Sales et al. (1994) B. C. Sales, E. C. Jones, B. C. Chakoumakos, J. A. Fernandez-Baca, H. E. Harmon, J. W. Sharp, and E. H. Volckmann, Physical Review B 50, 8207 (1994).
- Paschen et al. (1997) S. Paschen, E. Felder, M. A. Chernikov, L. Degiorgi, H. Schwer, H. R. Ott, D. P. Young, J. L. Sarrao, and Z. Fisk, Physical Review B 56, 12916 (1997).
- Takahashi and Moriya (1979) Y. Takahashi and T. Moriya, Journal of the Physical Society of Japan 46, 1451 (1979).
- Aeppli and Fisk (1992) G. Aeppli and Z. Fisk, Matter Phys 16, 1192 (1992).
- Fisk et al. (1995) Z. Fisk, J. L. Sarrao, J. D. Thompson, D. Mandrus, M. F. Hundley, A. Miglori, B. Bucher, Z. Schlesinger, G. Aeppli, E. Bucher, J. F. DiTusa, C. S. Oglesby, H. R. Ott, P. Canfield, and S. E. Brown, Physica B: Condensed Matter 206, 798 (1995).
- Varma (1994) C. M. Varma, Physical Review B 50, 9952 (1994).
- Fu and Doniach (1995) C. Fu and S. Doniach, Physical Review B 51, 17439 (1995).
- Anisimov et al. (1996) V. I. Anisimov, S. Y. Ezhov, I. S. Elfimov, I. V. Solovyev, and T. M. Rice, Physical review letters 76, 1735 (1996).
- Wertheim et al. (1965) G. K. Wertheim, V. Jaccarino, J. H. Wernick, J. A. Seitchik, H. J. Williams, and R. C. Sherwood, Physics Letters 18, 89 (1965).
- Kohgi and Ishikawa (1981) M. Kohgi and Y. Ishikawa, Solid State Communications 37, 833 (1981).
- Jarlborg (1995) T. Jarlborg, Physical Review B 51, 11106 (1995).
- Sun et al. (2014) P. Sun, B. Wei, D. Menzel, and F. Steglich, Physical Review B 90, 245146 (2014).
- Petrova et al. (2010) A. E. Petrova, V. N. Krasnorussky, A. A. Shikov, W. M. Yuhasz, T. A. Lograsso, J. C. Lashley, and S. M. Stishov, Physical Review B 82, 155124 (2010).
- Mihalik et al. (1996) M. Mihalik, M. Timko, P. Samuely, N. Tomašovičova-Hudákova, P. Szabó, and A. A. Menovsky, Journal of magnetism and magnetic materials 157, 637 (1996).
- Bocellip et al. (1995) S. Bocellip, F. Marabelli, R. Spolenak, and E. Bauer, MRS Online Proceedings Library Archive 402 (1995).
- Schlesinger et al. (1993) Z. . Schlesinger, Z. Fisk, H.-T. Zhang, M. Maple, J. DiTusa, and G. Aeppli, Physical review letters 71, 1748 (1993).
- Hunt et al. (1994) M. B. Hunt, M. A. Chernikov, E. Felder, H. R. Ott, Z. Fisk, and P. Canfield, Physical Review B 50, 14933 (1994).
- Brian et al. (2011) C. S. Brian, D. Olivier, A. M. Michael, and A. F. May, Physical review B 83 (2011).
- Dietl (2010) T. Dietl, Nature Materials 9, 965 (2010).
- Fang et al. (2015a) Y. Fang, C. T. Wolowiec, D. Yazici, and M. B. Maple, Novel Superconducting Materials 1, 79 (2015a).
- Sheldrick (2008) G. M. Sheldrick, Acta Crystallographica Section A: Foundations of Crystallography 64, 112 (2008).
- Fang et al. (2015b) Y. Fang, D. Yazici, B. D. White, and M. B. Maple, Physical review B 91 (2015b).
- Samuely et al. (1996) P. Samuely, P. Szabó, M. Mihalik, N. Hudáková, and A. A. Menovsky, Physica B: Condensed Matter 218, 185 (1996).
- Wolfe et al. (1965) R. Wolfe, J. H. Wernick, and S. E. Haszko, Physics Letters 19, 449 (1965).
- Buschinger et al. (1997) B. Buschinger, C. Geibel, F. Steglich, D. Mandrus, D. Young, J. L. Sarrao, and Z. Fisk, Physica B: Condensed Matter 230, 784 (1997).
- Ishizaka et al. (2005) K. Ishizaka, T. Kiss, T. Shimojima, T. Yokoya, T. Togashi, S. Watanabe, C. Q. Zhang, C. T. Chen, Y. Onose, Y. Tokura, and S. Shin, Physical Review B 72, 233202 (2005).
- Arita et al. (2008) M. Arita, K. Shimada, Y. Takeda, M. Nakatake, H. Namatame, M. Taniguchi, H. Negishi, T. Oguchi, T. Saitoh, A. Fujimori, and T. Kanomata, Physical Review B 77, 205117 (2008).
- Klein et al. (2008) M. Klein, D. Zur, D. Menzel, J. Schoenes, K. Doll, J. Röder, and F. Reinert, Physical review letters 101, 046406 (2008).
- Takahashi et al. (2000) Y. Takahashi, T. Kanomata, R. Note, and T. Nakagawa, Journal of the Physical Society of Japan 69, 4018 (2000).
- Marklund et al. (1974) K. Marklund, M. Larsson, S. Byström, and T. Lindqvist, Physica Scripta 9, 47 (1974).
- Koyama et al. (1999) K. Koyama, T. Goto, T. Kanomata, and R. Note, Journal of the Physical Society of Japan 68, 1693 (1999).