Online Abuse of UK MPs in 2015 and 2017: Perpetrators, Targets, and Topics
Abstract
Concerns have reached the mainstream about how social media are affecting political outcomes. One trajectory for this is the exposure of politicians to online abuse. In this paper we use 1.4 million tweets from the months before the 2015 and 2017 UK general elections to explore the abuse directed at politicians. This collection allows us to look at abuse broken down by both party and gender and aimed at specific Members of Parliament. It also allows us to investigate the characteristics of those who send abuse and their topics of interest. Results show that in both absolute and proportional terms, abuse increased substantially in 2017 compared with 2015. Abusive replies are somewhat less directed at women and those not in the currently governing party. Those who send the abuse may be issue-focused, or they may repeatedly target an individual. In the latter category, accounts are more likely to be throwaway. Those sending abuse have a wide range of topical triggers, including borders and terrorism.
Introduction
The recent UK EU referendum and the US presidential election, among other recent political events, have drawn attention to the increasing power of social media usage to influence major international outcomes. Such media profoundly affect our society, in ways which are yet to be fully understood. One particularly unsavoury way in which people attempt to influence each other is through verbal abuse and intimidation. In response to this concern, the UK government has recently announced a review looking at how abuse and intimidation affect Parliamentary candidates during elections.111https://www.gov.uk/government/news/review-into-abuse-and-intimidation-in-elections Shadow Home Secretary Diane Abbott has taken a key role in drawing attention to the phenomenon and speaking out about how it affects her and her colleagues.222https://www.theguardian.com/politics/2017/jul/12/pm-orders-inquiry-into-intimidation-experienced-by-mps-during-election333https://www.theguardian.com/politics/2017/feb/19/diane-abbott-on-abuse-of-mps-staff-try-not-to-let-me-walk-around-alone
There is a broad perception that intolerance, for example religious or racial, is on the increase in recent years, some associating this with the election of Donald Trump.444https://www.newyorker.com/news/news-desk/hate-on-the-rise-after-trumps-election555https://www.opendemocracy.net/transformation/ae-elliott/assemble-ye-trolls-rise-of-online-hate-speech In the UK, the outcome of the EU membership referendum, in which the British public chose to leave the EU, was also associated with the legitimisation of racist attitudes and an ensuing increased expression of those attitudes.666https://www.theguardian.com/commentisfree/2016/jun/27/brexit-racism-eu-referendum-racist-incidents-politicians-media Twitter is a barometer as well as mediator of these mindsets, providing a forum where users can communicate their message to public figures with relatively little personal consequence.
In this work we focus on abusive replies to tweets by UK politicians in the run-up to the 2015 and 2017 UK general elections. The analysis focuses on tweets using obscene nouns (“cunt”, “twat”, etc), racist or otherwise bigoted language, milder insults (“you idiot”, “coward”) and words that can be threats (“kill”, “rape”). In this way, we define “abuse” broadly; “hate speech”, where religious, racial or gender groups are denigrated, would be included in this, but we do not limit our analysis to hate speech. We include all manner of personal attacks and threats. Obscene language more generally (e.g. “fucking”, “bloody”) was not counted as abusive as it was less likely to be targeted at the politician personally. These data allowed us to explore the following questions:
-
•
What influences the amount of abuse a politician receives?
-
•
What can we learn about those who send abuse?
-
•
What are the topics of concern to those who send abuse?
-
•
What difference do we see in the above between the two time periods studied?
The work presented is part of a new and under-researched field looking at how abuse and intimidation are directed at our political representatives online. As politicians increasingly talk about their reluctance to expose themselves to this abuse and intimidation777https://www.theguardian.com/technology/2016/jun/18/vile-online-abuse-against-women-mps-needs-to-be-challenged-now, we see that there is a very real danger that they may no longer choose to do this work, and the part they play in creating a fair representation of the electorate will be lost. For this reason, it is important to engage with this aspect of the way the web is affecting our society. Previous work has examined abusive behaviour online towards different groups, but the reasons why a politician might inspire an uncivil response are very different to an ordinary member of the public, with resulting different implications. Additionally, to the best of our knowledge, this is the first study to contrast quantitative changes across two comparable but temporally distinct samples (the two general election periods).
Related Work
Whilst online fora have attracted much attention as a way of exploring political dynamics (?; ?; ?; ?; ?; ?), and the effect of abuse and incivility in these contexts has been explored (?; ?; ?; ?), little work exists regarding the abusive and intimidating ways people address politicians online; a trend that has worrying implications for democracy. Theocharis et al (?) collected tweets centred around candidates for the European Parliament election in 2014 from Spain, Germany, the United Kingdom and France posted in the month surrounding the election. They find that the extent of the abuse and harrassment a politician is subject to correlates with their engagement with the medium. Their analysis focuses on the way in which uncivil behaviour negatively impacts on the potential of the medium to increase interactivity and positively stimulate democracy. Stambolieva (?) studies online abuse against female Members of Parliament (MPs) only; in studying male MPs as well, we are able to contrast the level of abuse they each receive. Furthermore, we contrast proportional with absolute figures, creating quite a different impression from the one she gives.
A larger body of work has looked at hatred on social media more generally (?; ?; ?; ?). Williams and Burnap present work demonstrating the potential of Twitter for evidencing social models of online hate crime that could support prediction, as well as exploring how attitudes co-evolve with events to determine their impact (?; ?). Silva et al (?) use natural language processing (NLP) to identify the groups targeted for hatred on Twitter and Whisper.
Work exists regarding accurately identifying abusive messages automatically (?; ?; ?; ?; ?). The work of Wulczyn et al has been described as the state of the art, with precision/recall of 0.63 being reported as equivalent to human performance. Bartlett et al (?) report a human interannotator agreement of only 0.69 in annotating racial slurs, and Theocharis et al (?) report a human agreement of 0.8 with a Krippendorf’s alpha of 0.25 on UK data, demonstrating that the limiting factor is the complexity of the task definition. Burnap and Williams (?) particularly focus on hate speech with regards to protected characteristics such as race, disability and sexual orientation. Waseem and Hovy (?) also focus on hate speech, and share a gold standard UK Tweet corpus. Dadvar et al (?) seek to identify the problem accounts rather than the problem material. Schmidt and Wiegand (?) provide a review of prior work and methods.
In the next section, we describe our data collection methodology. We then present our results, beginning with an analysis of who receives the abuse, before moving on to who sends it and the topics that are most likely to trigger abusive replies.
Data Collection
The 2015 corpus was created by downloading tweets in real-time using Twitter’s streaming API. Tweets posted from the end of May 6th to the end of June 6th (the day before the election) were collected. The data collection focused on Twitter accounts of MPs, candidates, and official party accounts. We obtained a list of all current MPs888From a list made publicly available by BBC News Labs, which we cleaned and verified and all currently known election candidates999List of candidates obtained from https://yournextmp.com (at that time) who had Twitter accounts (506 currently elected MPs and 1811 candidates, of whom 444 MPs were also standing for re-election). We collected every tweet by each of these users, and every retweet and reply (by anyone) for the month leading up to the 2015 general election. The methodology was the same for the 2017 collection, this time collecting from the end of April 7th to the end of May 7th, for 1952 candidates and 480 sitting MPs, of whom 417 were also candidates. Data were of a low enough volume not to be constrained by Twitter rate limits. Corpus statistics are given in table 1, and are separated out into all politicians studied and just those who were then elected as MPs.
| #collected | #hadabuse | %abusive | |
|---|---|---|---|
| 2015 MPs+cands | 597 411 | 16 628 | 2.8% |
| 2015 MPs | 277 000 | 10 091 | 3.6% |
| 2017 MPs+cands | 821 662 | 32 791 | 4% |
| 2017 MPs | 613 952 | 24 659 | 4% |
In order to identify abusive language, the politicians it is targeted at, and the topics in the politician’s original tweet that tend to trigger abusive replies, we use a set of NLP tools, combined into a semantic analysis pipeline. It includes, among other things, a component for MP and candidate recognition, which detects mentions of MPs and election candidates in the tweet and pulls in information about them from DBpedia. Topic detection finds mentions in the text of political topics (e.g. environment, immigration) and subtopics (e.g. fossil fuels). The list of topics was derived from the set of topics used to categorise documents on the gov.uk website101010e.g. https://www.gov.uk/government/policies, first seeded manually and then extended semi-automatically to include related terms and morphological variants using TermRaider111111https://gate.ac.uk/projects/arcomem/TermRaider.html, resulting in a total of 940 terms across 51 topics. We also perform hashtag tokenization, in order to find abuse and threat terms that otherwise would be missed. In this way, for example, abusive language is found in the hashtag “#killthewitch”.
A dictionary-based approach was used to detect abusive language in tweets. An abusive tweet is considered to be one containing one or more abusive terms from the vocabulary list.121212see supplementary materials for anonymous review This contained 404 abuse terms in British and American English, comprising mostly an extensive collection of insults, with a few threat terms such as “kill” and “die” also included. Racist and homophobic terms are included as well as various terms that denigrate a person’s appearance or intelligence.
Data from Kaggle’s 2012 challenge, “Detecting Insults in Social Commentary”131313https://www.kaggle.com/c/detecting-insults-in-social-commentary/data, was used to evaluate the success of the approach, comprising two similar corpora of short online comments marked as either abusive or not abusive, amounting to around 6000 items. Our approach was shown to have an accuracy of 0.78 (Cohen’s Kappa: 0.39) on the first set, with a precision of 0.62, a recall of 0.45 and an F1 0.53; and 0.78 on the second (Cohen’s Kappa: 0.36), a precision of 0.60, recall of 0.43 nad F1 of 0.50. In practice, performance is likely to be slightly better than this, since the Kaggle corpus is American English. This performance is comparable to that obtained by Stambolieva (?), though somewhat lower than the state of the art, where F1s in excess of 0.6 have been reported on longer texts (see the previous section). Given the noisy and brief nature of tweets, however, it is often the case that deeper semantic analysis methods, e.g. dependency parsing, tend to perform poorly, which is why we opted for a robust dictionary-based approach. Manual review of the errors shows that some false positives arise in the area of threat terms, such as “rape” and “murder”, which are often discussed as being topics of concern, and there are also a small number of cases where strong language is used simply for emphasis or even meant positively, as in one case where a politician was praised for “working his balls off” and encouraged to “get his arse into Downing Street”. (Downing Street is the location of the UK government headquarters.) The errors do not seem to show any particular bias that might affect the results reported here.
Who is receiving the abuse?
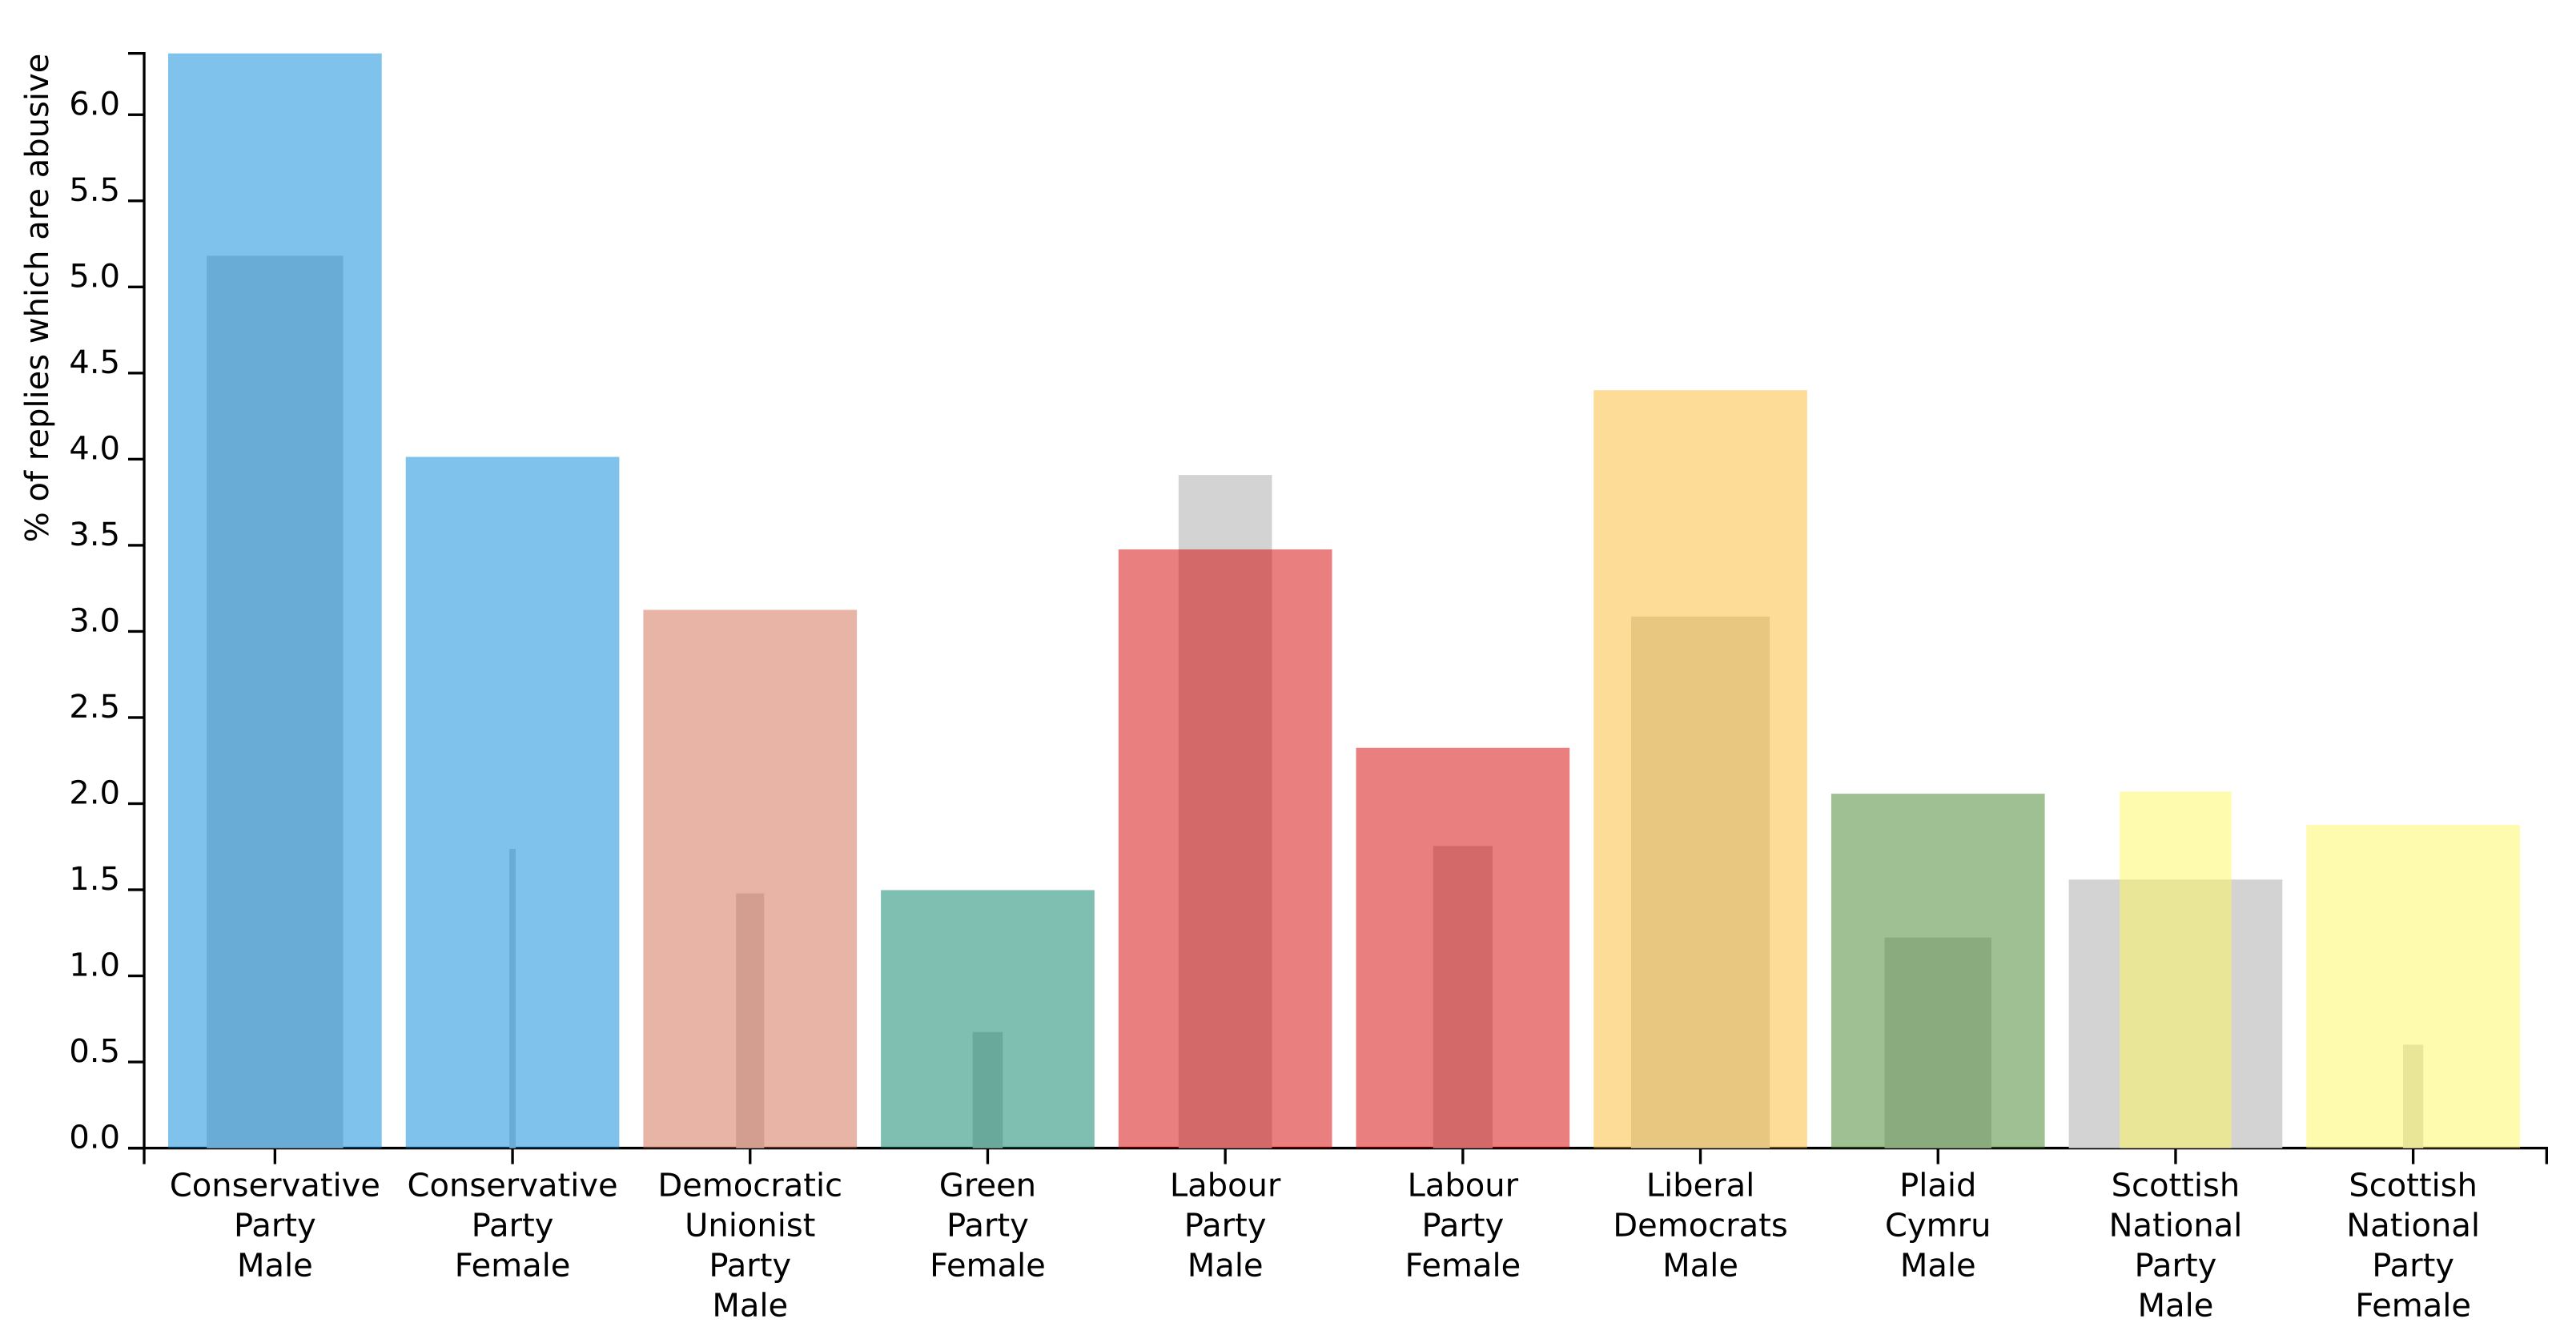
One claim made by politicians from all parties is that the amount of abuse, in terms of both volume and proportion, has increased in recent years. With our dataset spanning both the 2015 and 2017 UK general elections, we have the opportunity to contribute some evidence on this point. Figure 1 shows both the proportion of replies which are abusive (the heights of the bars) for 2015 (grey bars) and 2017 (bars coloured by party), and the change in volume of abusive replies (the width of the bars). The graph shows that in most cases, regardless of party or gender (note that only party/gender combinations which are relevant to both 2015 and 2017 are shown), both the proportion and volume have increased between 2015 and 2017. The two exceptions are where the proportion of abusive replies has fallen for male Labour Party MPs, and where the volume of abusive replies has fallen for male Scottish National Party (SNP) MPs. The former is difficult to explain, whereas the latter can be easily attributed to the loss of seats (the party as a whole went from winning 56 seats in 2015 to winning just 35 in 2017). In most cases, however, it is clear that both the proportion and volume of abusive replies have risen in the two years between elections. In some cases this rise has been dramatic, noticeably for female Conservative MPs, although there are clear reasons (Theresa May becoming Prime Minister in this case) behind most of the dramatic changes. However, these are better investigated through other analyses and visualizations.
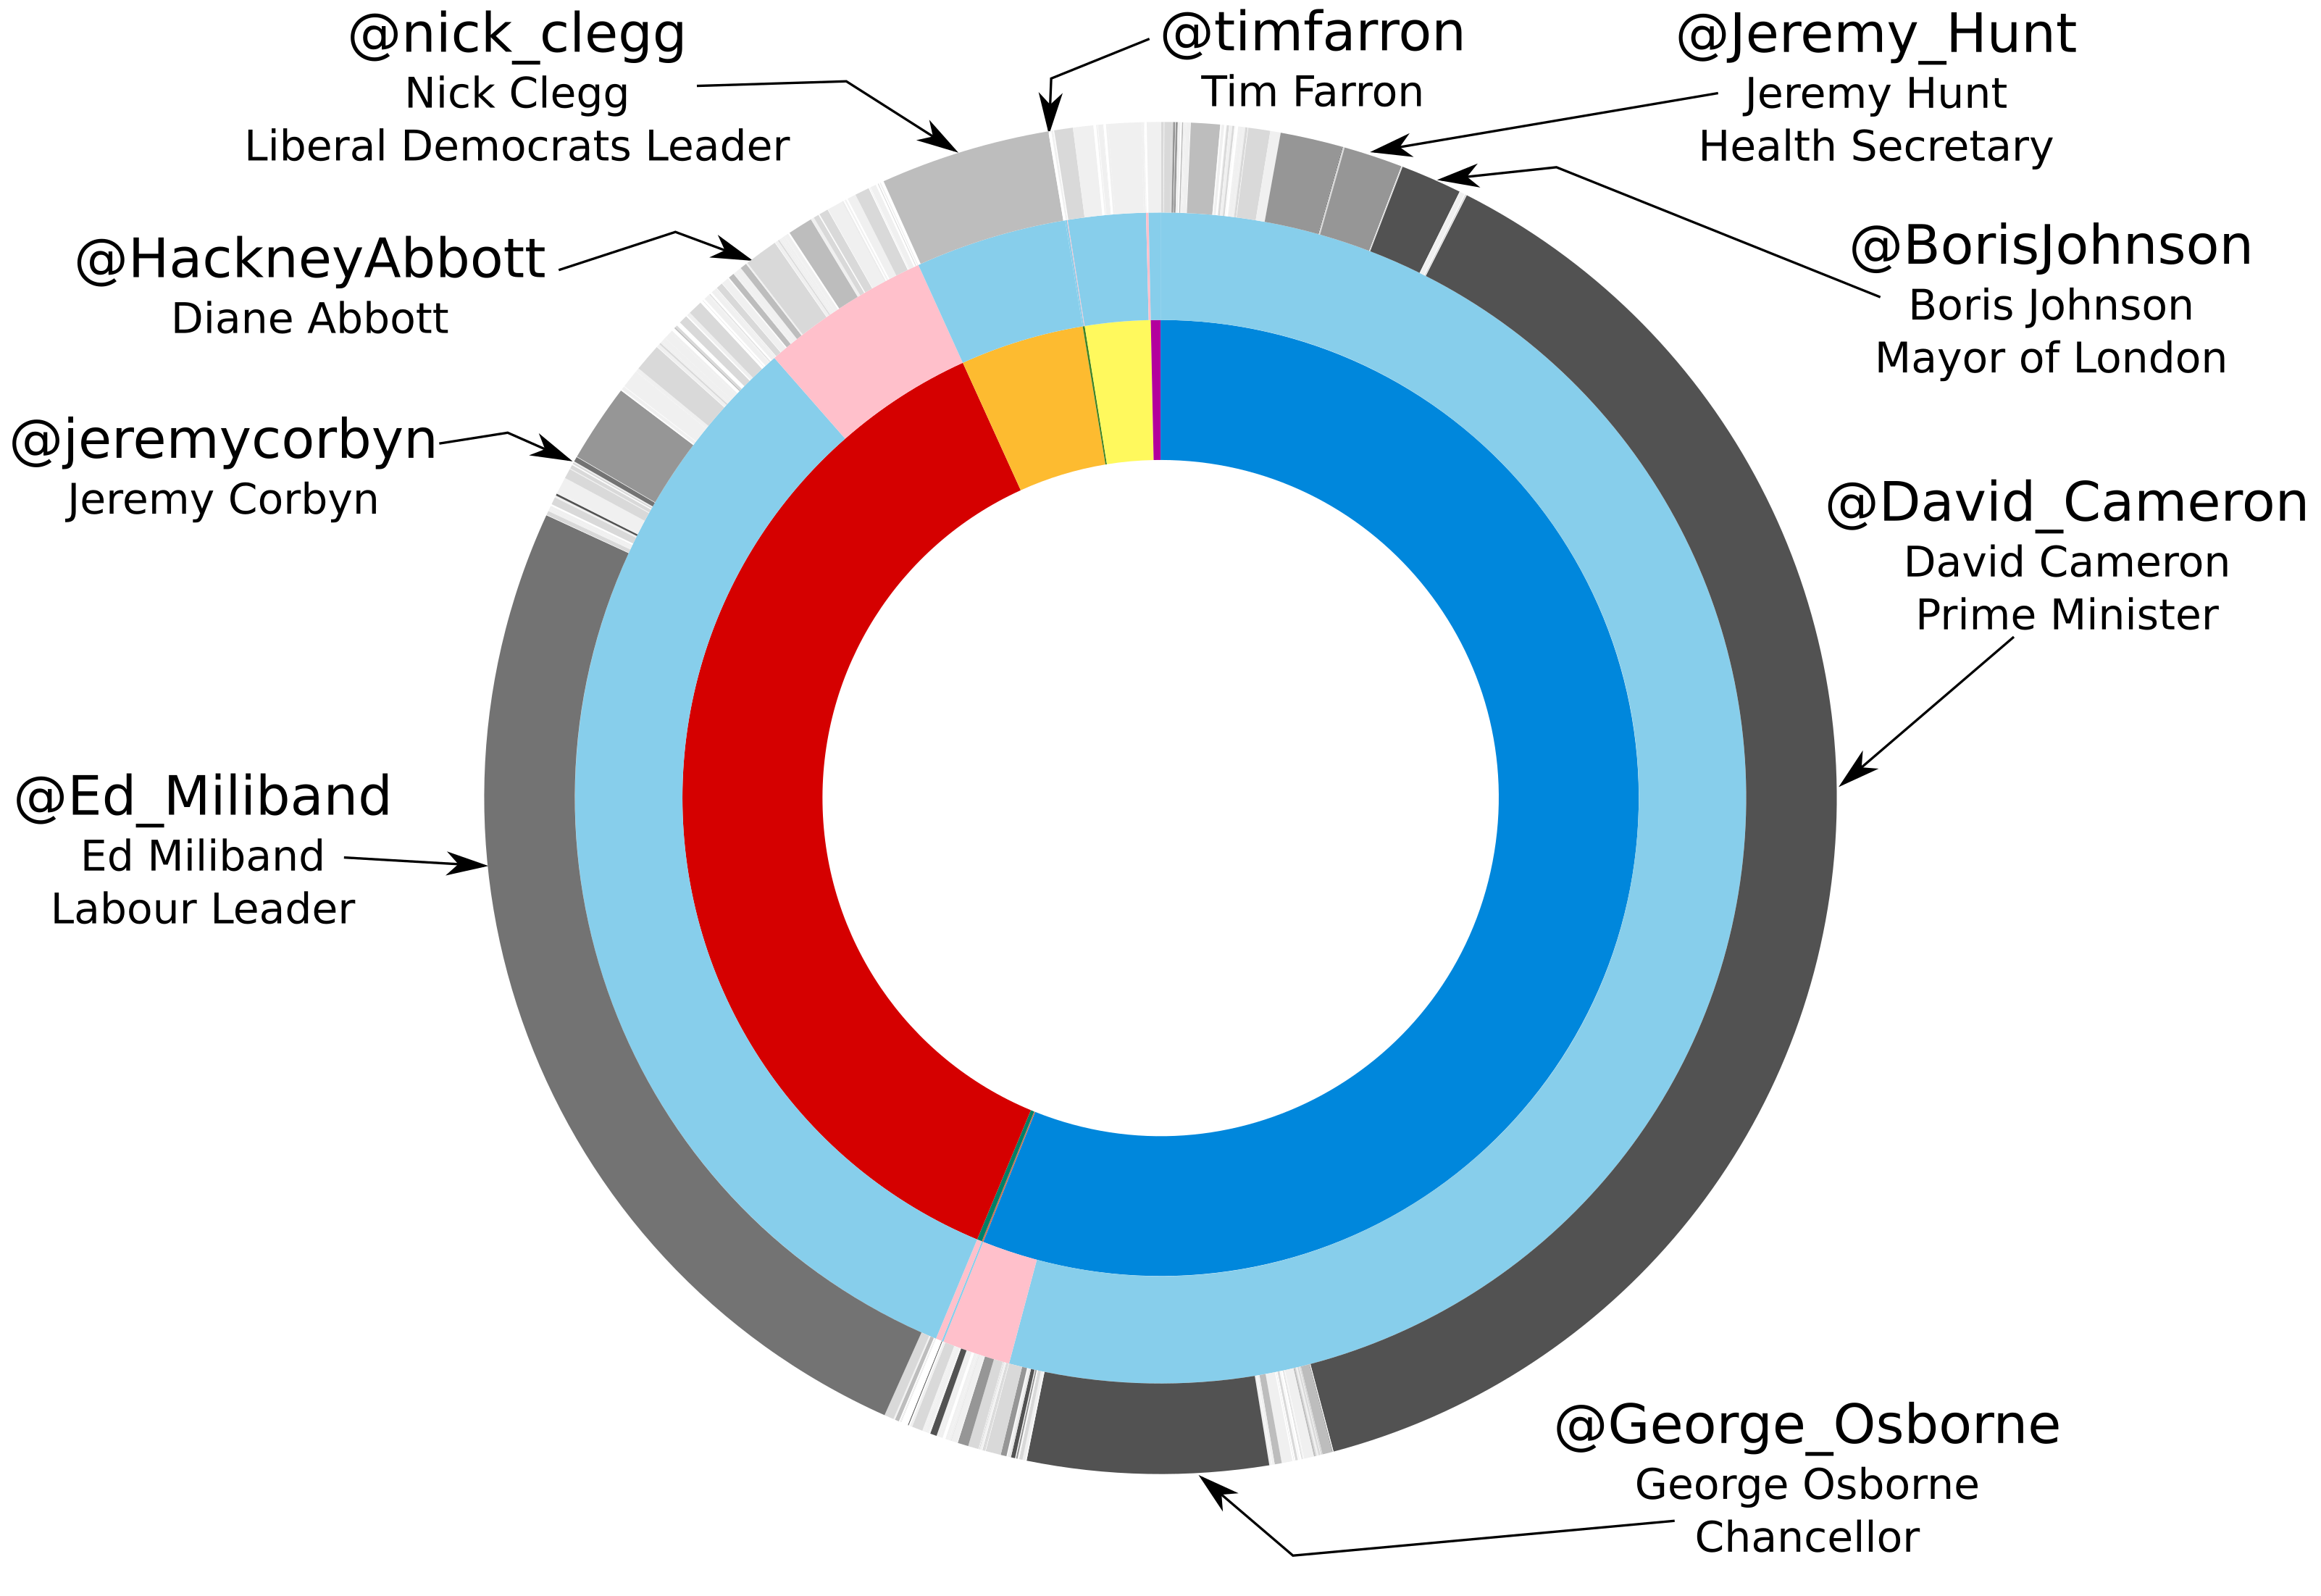
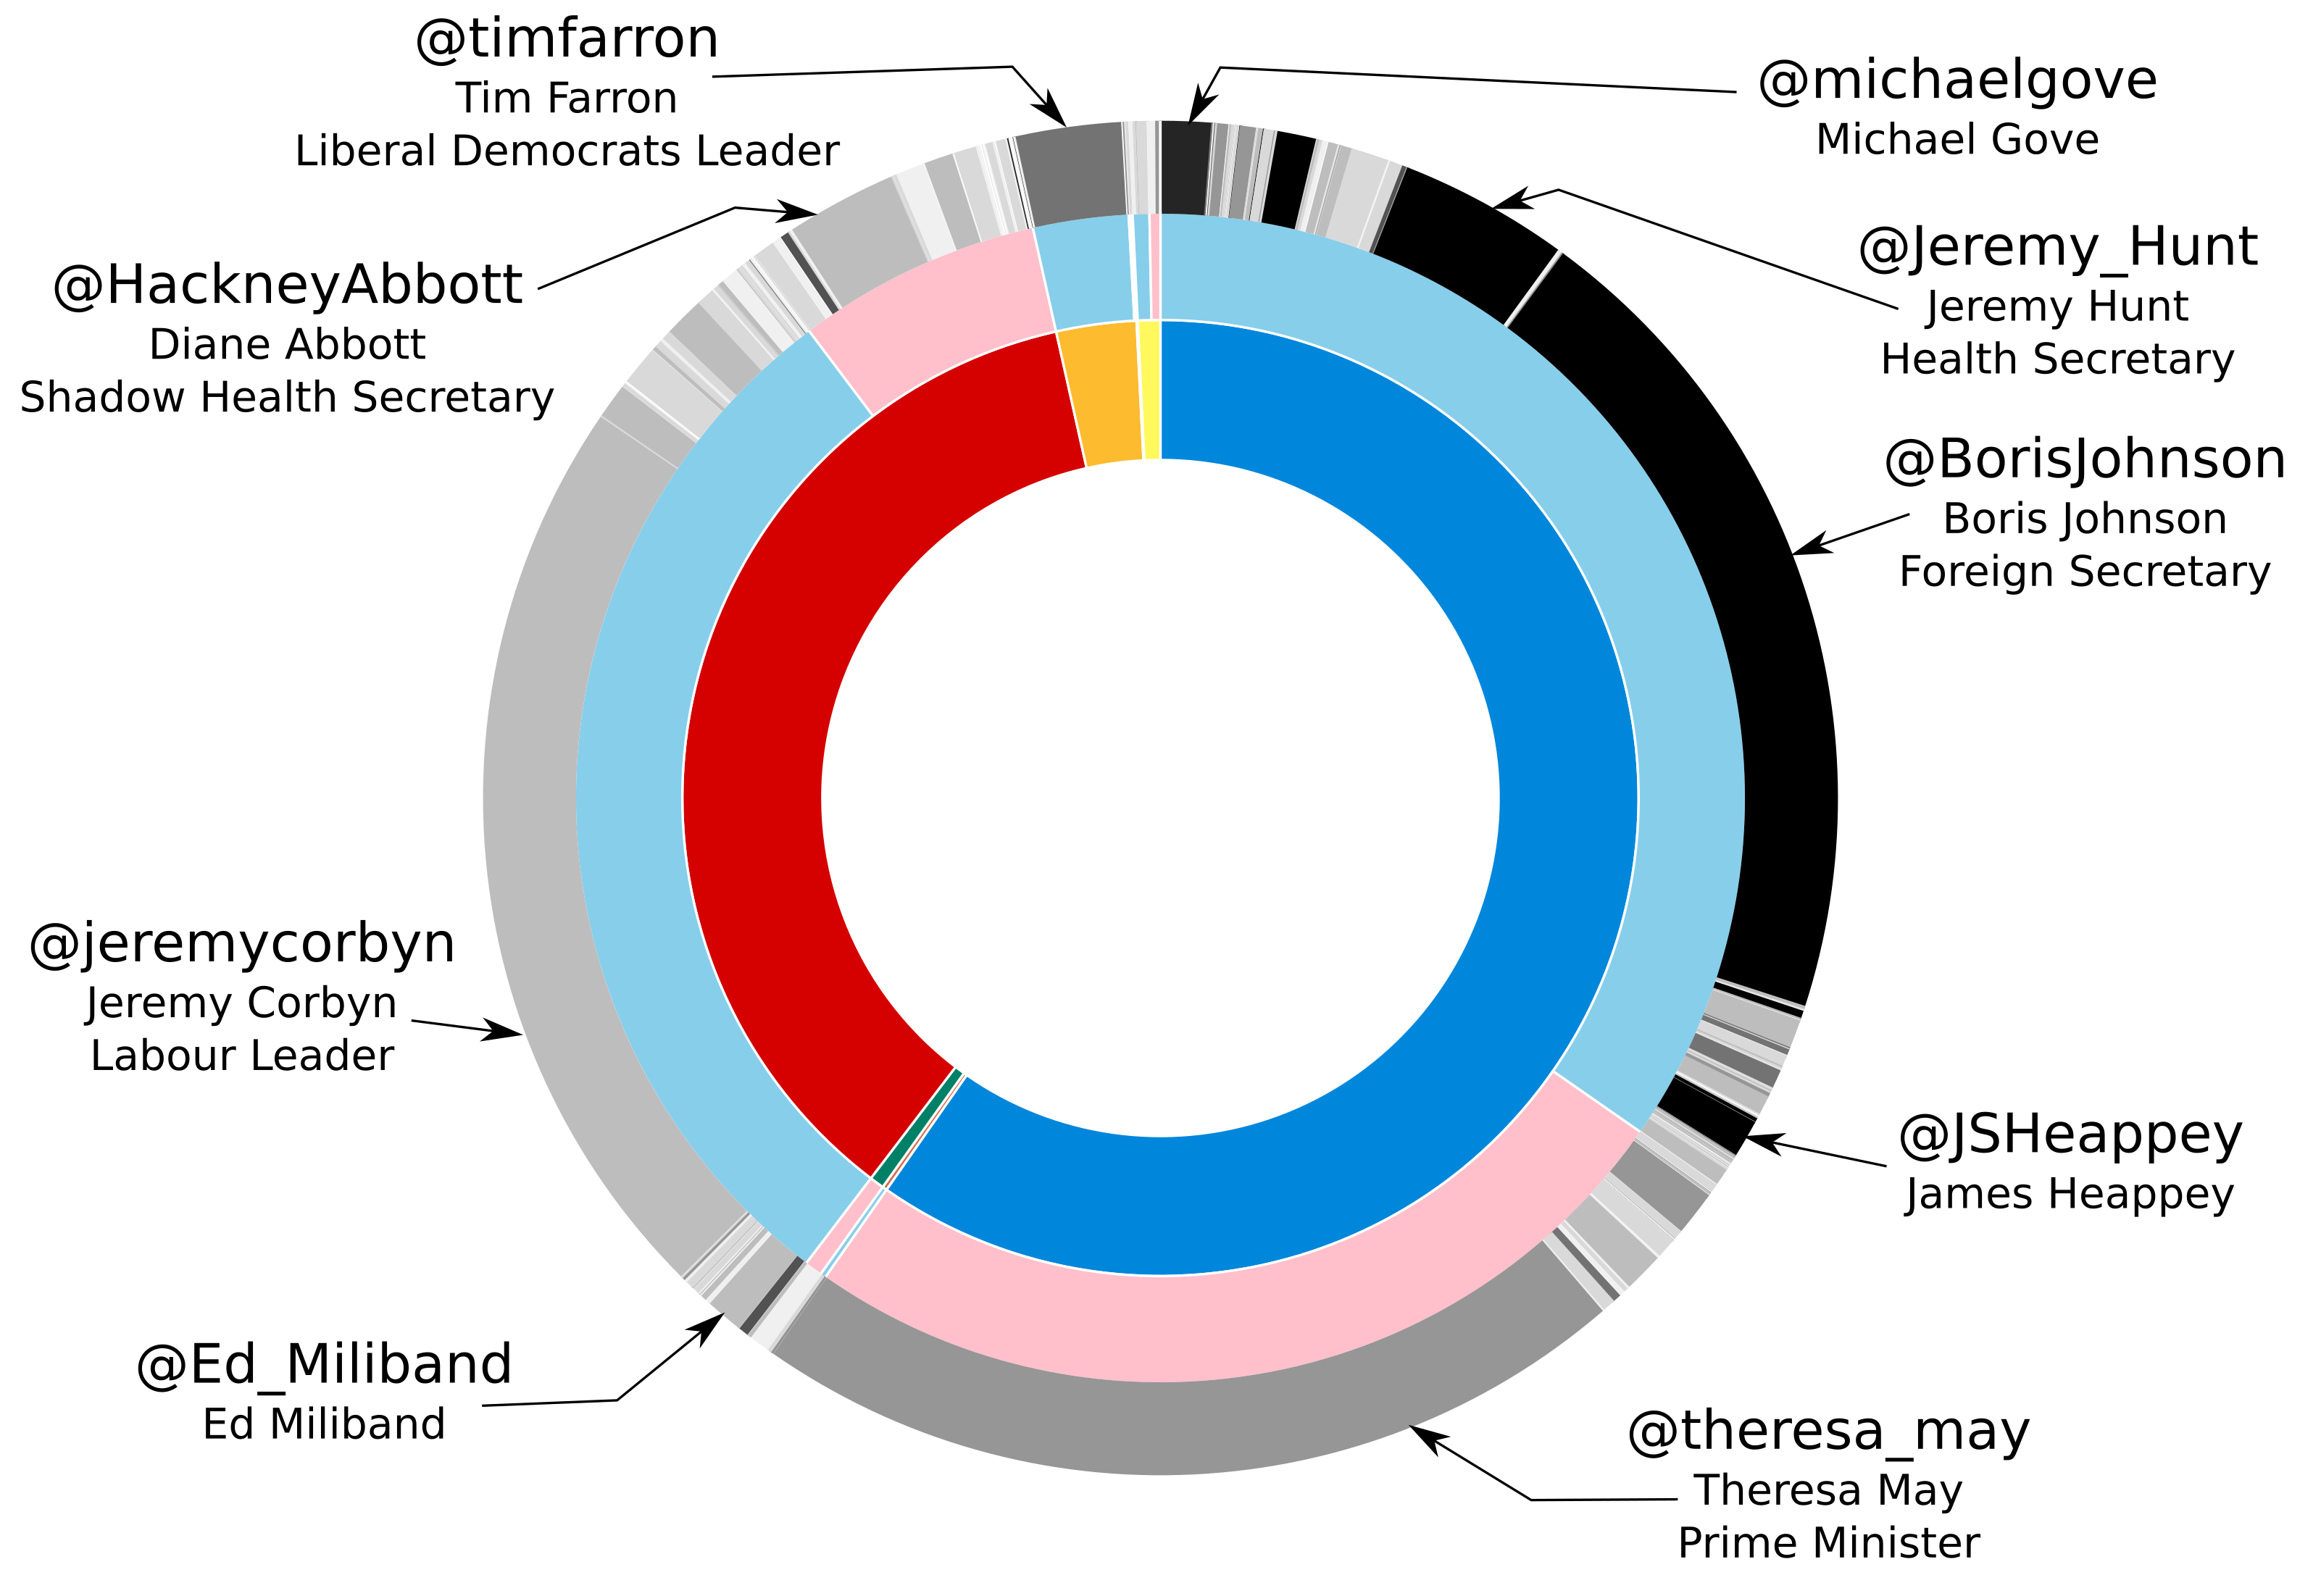
In figures 2 and 3, also available online in interactive form141414http://greenwoodma.servehttp.com/data/buzzfeed/sunburst.html, the outer ring represents MPs, and the size of each outer segment is determined by the number of abusive replies each receives. Working inwards you can then see the MP’s gender (pink for female and blue for male) and party affiliation (blue for Conservative, red for Labour, yellow for the Scottish National Party – see the interactive graph to explore the smaller parties). The darkness of each MP segment denotes the percentage of the replies they receive which are abusive. This ranges from white, which represents up to 1%, through to black, which represents 8% and above. It is clear that some MPs receive substantially more abusive replies than others. These visualizations highlight that prominence seems to be a bigger indicator of the quantity of abusive replies an MP receives than party or gender. In 2015 the majority of the abusive replies were sent to the leaders of the two main political parties (David Cameron and Ed Miliband). In 2017 the people receiving the most abuse has changed, but again the leaders of the two main parties (Jeremy Corbyn and Theresa May) receive a large proportion of the abuse, followed by other prominent members of the two parties. Unlike in 2015 though, in 2017 there are other MPs who receive a large proportion of the abuse; most notably Boris Johnson, who rose to national prominence as one of the main proponents of the Leave campaign during the UK European Union membership referendum and with his subsequent promotion to Foreign Secretary. Conversely, Ed Miliband has seen the volume of abuse he receives reduce dramatically with his return to the back benches after quitting as leader of the Labour Party after the 2015 election.
Whilst this view is useful in understanding the amount of abuse politicians receive in absolute terms, it is less valuable in illustrating the different responses the parties and genders receive, because individual effects dominate the picture. Therefore it is important to also see the results per-MP. The online version of these graphs includes a “count” view in which each segment of the outer ring represents a single MP. It is evident at a glance that replies to male Conservative MPs are proportionally more abusive, with female Conservative MPs not far behind, an impression that will be further explored statistically below.
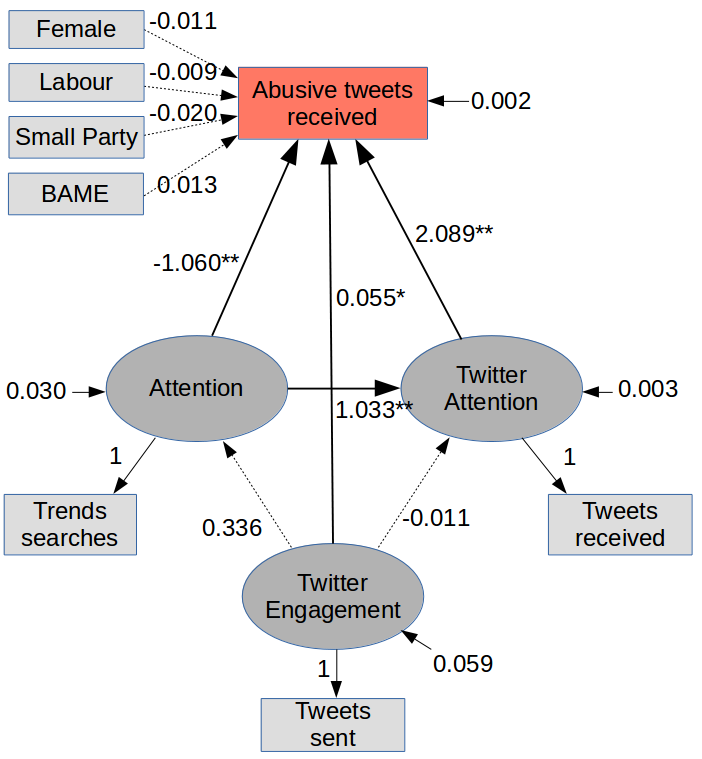
Structural equation modeling (see Hox and Bechger (?) for an introduction) was used to broadly relate three main factors with the amount of abuse received: prominence, Twitter prominence (which we hypothesise differs from prominence generally) and Twitter engagement. We obtained Google Trends data for the 50 most abused politicians in each of the time periods, and used this variable as a measure of how high-profile that individual is in the minds of the public at the time in question. Search counts for the month running up to each election were totalled to provide a figure. We used number of tweets sent by that politician as a measure of their Twitter engagement, and tweets received as a measure of how high-profile that person is on Twitter. The model in figure 4, in addition to proposing that the amount of abuse received follows from these three main factors, also hypothesises that the amount of attention a person receives on Twitter is related to their prominence more generally, and that their engagement with Twitter might get them more attention, both on Twitter and beyond it. It is unavoidably only a partial attempt to describe why a person receives the abuse they do, since it is hard to capture factors specific to that person, such as any recent allegations concerning them, in a measure. The model was fitted using Lavaan,151515http://lavaan.ugent.be/ resulting in a chi-square with a p-value of 0.403 (considered satisfactory, see Hox and Bechger (?)), and shows a number of significant findings (indicated with a bold line and asterisks against the regression figure). A strong pathway to receiving more abuse on Twitter is simply that if a person is well-known, they receive a lot of tweets, and if they receive a lot of tweets, they receive a lot of abusive tweets, in absolute terms. However, an additional pathway shows that having removed this numbers effect from consideration, being very well known (if Google searches can be taken as a measure of that) leads to a person being less likely to receive abuse on Twitter. Perhaps to certain senders of abuse, a large target is a less attractive one. A further pathway positively relates Twitter engagement to abuse received, supporting Theocharis et al’s (?) findings. In this case, perhaps it is what the person said that provides an attractive target for abuse. The suggestion is that there may be different types of abuse going on.
The effects that aren’t significant are also interesting. For example, engaging more with Twitter doesn’t correlate with getting more attention on Twitter. The impact of gender, party and ethnicity is, though somewhat telling, uncompelling in this model, so these are explored separately. In the model, being female and being a Labour politician emerge as factors tending to reduce abuse received, relative to being a male or a Conservative; being a member of any other party even more so. Being an ethnic minority may tend to increase it. Note however that the ethnicity data is sparse, so unlikely to reveal a significant result.
In the full set of 2017 politicians, male MPs received around 2 abusive tweets in every 100 responses (), compared with women MPs’ 1.3 (). (Note that these numbers appear low compared with the overall corpus statistics because of the long tail of MPs with little abuse.) An independent samples t-test finds the difference significant (). In order to test the possibility that the effect arises from a small number of dominant individuals, we removed those politicians receiving in excess of 10,000 tweets in the sample period, namely Angela Rayner, Boris Johnson, Diane Abbott, Jeremy Hunt, Jeremy Corbyn, Tim Farron and Theresa May. The difference remains significant () even after the removal of these outliers. This result is also found in the 2015 data (), remaining significant though weaker even after the removal of, in the case of 2015, three male outliers; David Cameron, Ed Milliband and Nick Clegg. In 2015, as discussed above, the level of abuse was lower, with men receiving around 1.3 abusive tweets in every 100 () to women’s 1 (). Black, Asian and ethnic minority (BAME) MPs received marginally less abuse than non-BAME MPs in the 2017 sample (1.4% as opposed to 1.7%; data not available for 2015), but the result was not significant, and contradicts the finding above, suggesting that other factors may account for it. Recall also that the BAME sample size is small.
Differences in the proportion of abusive tweets received across parties are also apparent. In an independent samples t-test, Conservative MPs received significantly more abusive tweets than Labour () in the time frame studied, with an average of 2.3 percent () as opposed to 1.3 percent (). This result is unaltered by the removal of the above outliers; Conservatives received 2.2 abusive tweets per hundred as opposed to 1.2 by Labour MPs, and the significance of the result remains the same. Conservatives also receive more abuse in 2015; however, in 2015 the result is not significant, perhaps suggesting a greater dependence on the prevailing political circumstances. It would certainly be interesting to review whether this result changes should the Conservatives stop being the governing party.
Who is sending the abuse?
Having established which politicians tend to be targeted by abusive messages, now let us examine the accounts behind these posts. For this analysis we focused on the 2506 Twitter accounts in our 2017 dataset who have sent at least three abuse-containing tweets. A random sample of 2500 tweeters for whom we found no abusive tweets were then selected to form a contrast group.
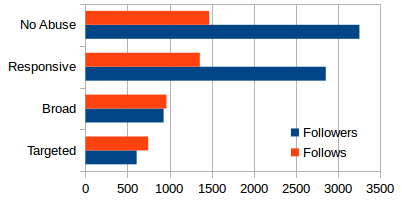
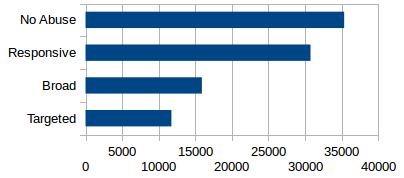
Independent samples t-tests revealed that those who tweeted abusively have more recent Twitter accounts by a few months (1533 days on average vs 1608, ), smaller numbers of favourited tweets (7379 vs 14596, ), fewer followers (1085 vs 3260, ), follow fewer accounts (923 vs 1472, ), are featured in fewer lists (23 vs 67, ) and have fewer posts (16445 vs 25258, ). After partialing out account age, number of abusive tweets still correlated significantly with number of favourites (), number of followed accounts (), number of times listed () and number of posts (), demonstrating that with the exception of follower number, these relationships cannot be explained by account age. One explanation for these findings would be that a certain number of accounts are being created for the purpose of sending anonymous abuse.
To investigate in more detail the abuse-sending behaviour of these 2,506 accounts, we define a new metric, “targetedness”, in order to differentiate between those users who send strongly worded tweets to a wide number of politicians (perhaps because their strength of feeling pertains to an issue rather than a particular person to whom they tweet) and those users that target a particular individual or a small number of politicians. The metric is given in equation 1. It divides the total number of abuse-containing tweets found in our sample authored by that Twitter user, , by the number of separate recipients to whom they were directed, . Multiplying the divisor by two and subtracting one (a conservative choice that yet achieves the objective) provides a simple way to deflate the score for those with more recipients, compared with those achieving the same ratio with a smaller number of tweets to a smaller number of people. In this way, for example, sending five abuse-containing tweets to five different politicians results in a lower targetedness score than sending one abuse-containing tweet to one politician. The metric has the advantage (compared with for example Gini coefficient or entropy) of appropriately positioning the “long tail” of accounts with little abuse in the middle ground.
| (1) |
This metric was used to split the group into three parts: those with a score higher than one (), whose abuse pattern we refer to as “targeted”; those with a score lower than one (), described below as “broad”; and those scoring one (), which we dub “responsive”. These three groups show distinct behavioural patterns. For example, those that target one or two individuals for repeated abusive tweets (“targeted”) include one Twitter user who addressed Jeremy Hunt with a single word epithet 28 times in our sample, and one account, now deleted, who made MP James Heappey the focus of their exclusive uncivil attention to the tune of 34 tweets. James Heappey made an unpopular comment to a schoolchild shortly before the 2017 general election, which might have been a contributing factor in the attention he received. Those that send a large number of abuse-containing tweets thinly spread among a large number of politicians (“broad”) tend to be ideologically driven; for example, one user addresses ten different individuals and focuses consistently on class war.
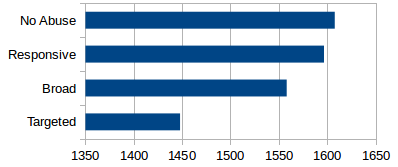
Both targeted and broad users show indicators that differentiate them to a greater extent from tweeters who were not found to have sent any abusive tweets; namely, the former have fewer posts, fewer favourites, newer accounts, fewer followers and fewer followees, as well as appearing on fewer lists, with the “targeted“ group more pronounced in these effects than the “broad” group. There are also abuse-sending tweeters in the middle ground – the “responsive”. These address a medium number of people with a medium amount of abuse and have account statistics that are closer to normal (though note that the inclusion of the long tail of accounts with little abuse in the “responsive” category may contribute to this). Figures 5, 6 and 7 illustrate these findings, showing average account age, average number of followed accounts, average number of followers and average number of posts respectively.
Only in the group showing targeted abuse behaviour do we see a significant difference in account age compared with the control group (1448 days on av. vs 1606 with a higher standard deviation; 1208 days vs 1023, ). The other two types of abuse profile do not show a significant effect with account age, perhaps indicating that throwaway accounts are more likely to be occurring in the former group. All other indicators for all abuse types remain significantly different from the control group for whom no abuse was found, other than follower number.
In order to establish that number of abusive tweets alone does not explain the effect, a sample was selected of tweeters with 3 to 9 abusive tweets inclusive. This resulted in a lower average number of abusive tweets from the “targeted” group () compared with the “broad” group (). Even within this sample, the “targeted” group had substantially younger Twitter accounts, fewer favourites, fewer followers, followed fewer accounts, were listed less often and had posted less.
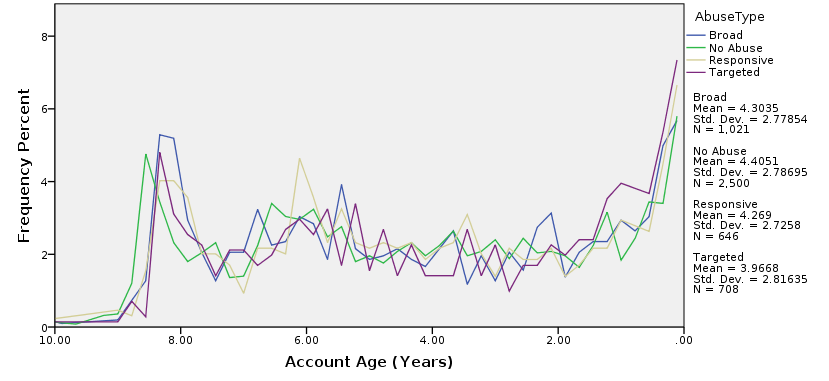
In Figure 8 we plot the account age in years against the percentage of accounts from each category with that age, allowing us to explore the differences in account age between the different abuse types in more detail. Amongst all 8 to 10 year old accounts, those inclined to send abuse were created later compared with those that did not. In other words, the oldest of all non-abuse accounts are a little older than the oldest of the accounts that send abuse. Secondly, in the most recent 1.5 years, many Twitter accounts have been created, including a prominent spike even for the control group. This indicates a fairly high rate of account creation, but this effect is more pronounced for those that send abuse, particularly targeted abuse, perhaps suggesting that the intention to abuse is a prominent reason, though not the only one, for creating a throwaway account.
A similar analysis of accounts that sent abusive tweets in the leadup to the 2015 general election revealed some differences compared with 2017. Firstly, whilst abuse-posting accounts were again younger, in 2015 they posted more (12732 statuses on average vs 8752, ) and favourited more (2499 vs 1517, ). Reviewing the data reveals that in 2015 more abuse was sent by a smaller number of individuals, including a substantial number of what might be termed serial offenders, who perhaps explicitly seek attention by posting and favouriting. The greater quantity of abuse found in the 2017 data is more thinly spread across a larger number of lesser offenders. Twitter’s commitment to reviewing and potentially blocking abusive users might account for the difference in the two years. It is striking that despite evident progress in that regard, the amount of abuse has still increased. Manual review of the data shows no evidence of “bots” (automated accounts) in the sample. Though bot activity is common in Twitter political contexts (?), we suggest that bots are unlikely to use abusive language.
In both the 2015 dataset and the 2017 one we found that significantly more accounts had been closed from the group that sent abusive tweets; 16% rather than 6% () in 2015 and 8% rather than 2% () in 2017 (Fisher’s exact test).
Topics Triggering Abusive Replies
To explore what motivates people to send abusive tweets, we begin by analysing what topics are mentioned by them in their abusive responses to candidates. Abusive tweets were compared against the set of predetermined topics described earlier. Words relating to these topics were then used to determine the level of interest in these topics among the abusive tweets, in order to gain an idea of what the abusive tweeters were concerned about. So for example, the following 2017 tweet is counted as one for “borders and immigration” and one for “schools”: “Mass immigration is ruining schools, you dick. We can’t afford the interpretation bill.”
The topic titles shown in figures 9, 10, 11, 12 are generally self-explanatory, but a few require clarification. “Community and society” refers to issues pertaining to minorities and inclusion, and includes religious groups and different sexual identities. “Democracy” includes references to the workings of political power, such as “eurocrats”. “National security” mainly refers to terrorism, where “crime and policing” does not include terrorism. The topic of “public health” in the UK is dominated by the National Health Service (NHS). “Welfare” is about entitlement to financial relief such as disability allowance and unemployment cover.
In particular, figure 9 gives mention counts for these topics in abuse-containing tweets posted in response to politicans’ tweets in the month leading up to the 2017 general election, and respectively, figure 11 does so for 2015. As a comparison, figure 10 shows the topics mentioned in all tweets in the same month for 2017, and figure 12 – those for 2015.
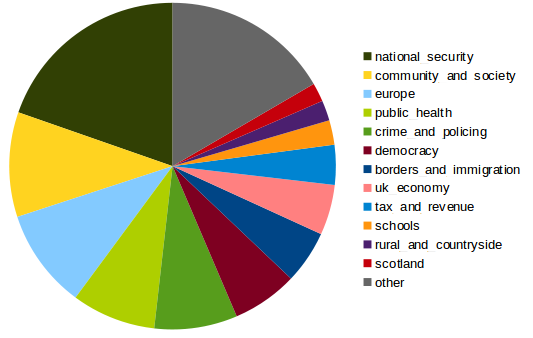
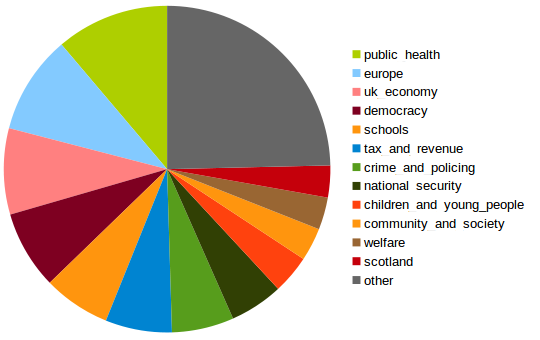
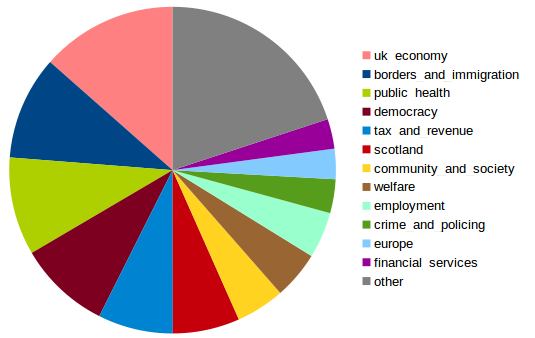
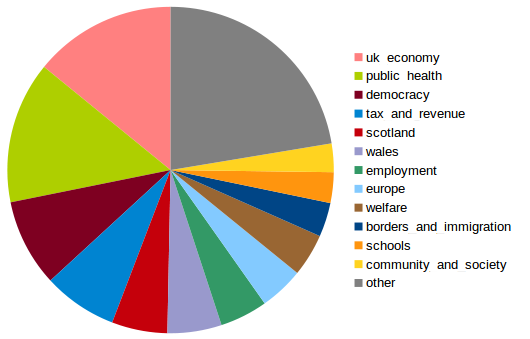
It is notable that in 2017 national security comes to the fore in abuse-containing tweets, whilst only being the eighth most prominent topic in the whole set of tweets. Similarly, community and society is more frequent in abuse-containing tweets than in tweets in general. In the month preceding the 2017 election, the UK witnessed its two deadliest terrorist attacks of the decade so far, both attributed to ISIS. In 2015, both for the abuse-containing tweets and the general set, the economy is the most prominent topic. National security was not an important topic in 2015. However, borders and immigration appears more prominently in the abuse-containing tweets. This may reflect the fact that EU membership was a key topic in 2015, whereas by the time of the 2017 election, the 2016 referendum had largely settled the question.
The absolute numbers above are not large, because abuse-containing tweets often do not contain an explicit reference to a topic. Therefore we also analysed the amount of abuse that appeared in responses to tweets on particular topics. In terms of number of abusive replies per topic mention, the topic drawing the most abuse in 2017 was national security, at a rate of 0.026 abusive replies per mention, significantly higher than the mean of 0.014 (, chi-square test with Yates correction). Other topics particularly drawing abuse, considering only those with at least 50 abusive replies, are employment (0.019), tax and revenue (0.019), Scotland (0.019), the UK economy (0.018) and crime and policing (0.018). Note that the topic replied to and the topic replied about may be quite different. For example, a person might reply to a tweet about the NHS with a contribution on the subject of immigration.
Finally, we analyzed the topics mentioned across all tweets by tweeters that sent abuse. We present results for the 2017 time period only. We collected up to 3,000 posts for each of the 2,506 accounts that posted at least three abuse-containing messages. Each of these accounts was then vectorialized on the basis of topic mentions, one dimension per topic, and then clustered using k-means. Since the purpose is exploratory, and the aim is to produce clusters that group the accounts in a way that facilitates understanding, a k of 8 was selected, since it makes for a readable result. The following clusters emerged, described here in terms of their cosine with each topic axis, giving an indicator of topic satellites that might be used to profile those that send abuse:
-
•
The Economy (409 accounts): Economy (0.48), Europe (0.36), public health (0.33), tax (0.24), democracy (0.20)
-
•
Europe and Trade (387 accounts): Europe (0.85), economy (0.20)
-
•
The NHS (337 accounts): Public health (0.63), economy (0.28), Europe (0.25), democracy (0.21), crime (0.21)
-
•
Borders (284 accounts): Europe (0.61), immigration (0.35), community (0.29), national security (0.22), crime (0.22)
-
•
Crime (258 accounts): Crime (0.41), national security (0.38), public health (0.26), economy (0.21)
-
•
Changing Society (208 accounts): Community (0.63), immigration (0.36), national security (0.31), crime (0.26), Europe (0.25)
-
•
Scotland (145 accounts): Scotland (0.71), Europe (0.36), economy (0.23)
-
•
Schools (104 accounts): Schools (0.20)
The clusters have intuitively covered a range of viewpoints that might indicate a strength of opinion. Only cluster 7, “schools”, is a weak cluster, and may simply have become a catch-all for accounts with no strong profile. It shows that despite national security accounting for the most abuse in 2017, in fact more of those sending abuse are concerned with issues such as the economy, Europe and the national health service. National security seems to be the purview of a vocal minority of those sending abuse.
Discussion and Future Work
This work provides an empirical contribution to the current debate around abuse of politicians online, challenging some assumptions whilst providing a quantified corroboration for others. In particular, we contribute a detailed investigation into the behaviour and concerns of those who send abuse to MPs and electoral candidates. Our main findings are itemized below.
-
•
Abuse received correlates reliably with attention received. However, within that, there is a tendency for the more prominent politicians to receive proportionally less abuse, and for those that engage with Twitter to receive more. Male MPs and Conservatives were the target of more abuse in the data studied.
-
•
Abusive behaviour falls into different types. Users who target their abuse at a small number of individuals show more evidence of using throwaway accounts.
-
•
The topics eliciting abusive tweets differ from those discussed by general users. In 2015, borders were a greater topic of concern among those sending abuse, whereas in 2017, terrorism was.
-
•
Abuse increased significantly between the 2015 and 2017 general elections.
Our finding regarding the gender of targeted politicians is in keeping with the result for the general population reported by Pew Internet Research.161616http://www.pewinternet.org/2014/10/22/online-harassment/ They note that whilst men receive more abuse, women are more likely to be subject to stalking and sexual harrassment and are more likely to feel upset by it. We did not separate out these types of abuse in the current study, although it is planned for future work.
Regarding the finding that Conservatives receive more harrassment, correctly contextualising this might involve contrasting the case where the Conservatives are not currently in power. Bartlett171717http://www.telegraph.co.uk/technology/twitter/11400594/Which-party-leader-gets-the-most-abuse-on-Twitter.html found the Conservatives were also receiving a more negative response than Labour Party politicians in February 2015, corroborating our findings. He further notes, as do Theocharis et al (?), that interactivity, in the sense of sending fewer broadcast-style tweets and more conversational tweets, tends to improve the way a politician is perceived. Note that we didn’t differentiate between broadcast and interactive styles of tweeting in our work. It would be interesting to contextualize our finding regarding politicians with greater Twitter engagement drawing more abuse by contrasting the two engagement styles.
The work presented here raises a number of questions about how abuse is defined and measured, and what it says about the perpetrator. Wulczyn el al (?) note that less than half of the abuse in Wikipedia talk pages comes from anonymous users, which is in keeping with our finding that abuse is not something that necessarily emerges from clearly defined abberant individuals. It also depends on circumstances, and is part of a broader social picture. Furthermore, language needs to be contextualised to be meaningful. A slight on someone’s intelligence can be hate speech in one context and relatively harmless in another. Awan and Zempi (?) discuss the particular harm done by hate speech. Quantitative work agglomerates a number of effects; whilst our work found no strong evidence of increased abuse towards BAME politicians, a tendency to show courtesy to minorities generally could mask a strain of abuse that makes them a particular target.
In future work, we will experiment with more specific classification of hate speech such as that described by Waseem and Hovy (?). This would allow for further work focusing specifically on the more severe issue of hate and intimidation, a dimension vital for understanding the real world impact of online abuse. It is possible that future work might be able to quantify the impact that receiving abuse has on a politician; however, such work would need to be carefully designed, since it would need to control for the natural rise and fall of a politician’s prominence, and with it the amount of abuse they receive.
Acknowledgments
This work was partially supported by the European Union under grant agreements No. 610829 DecarboNet and 654024 SoBigData, the UK Engineering and Physical Sciences Research Council (grant EP/I004327/1), and by the Nesta-funded Political Futures Tracker project.181818http://www.nesta.org.uk/news/political-futures-tracker
References
- [2017] Awan, I., and Zempi, I. 2017. ‘I will Blow your face OFF’ -—Virtual and Physical World Anti-Muslim Hate Crime. The British Journal of Criminology 57(2):362–380.
- [2017] Bartlett, J.; Reffin, J.; Rumball, N.; and Williamson, S. 2017. Anti-social media. Technical report, Demos.
- [2015] Burnap, P., and Williams, M. L. 2015. Cyber hate speech on twitter: An application of machine classification and statistical modeling for policy and decision making. Policy & Internet 7(2):223–242.
- [2016] Burnap, P., and Williams, M. L. 2016. Us and them: identifying cyber hate on twitter across multiple protected characteristics. EPJ Data Science 5(1):11.
- [2012] Chen, Y.; Zhou, Y.; Zhu, S.; and Xu, H. 2012. Detecting offensive language in social media to protect adolescent online safety. In Privacy, Security, Risk and Trust (PASSAT), 2012 International Conference on and 2012 International Confernece on Social Computing (SocialCom), 71–80. IEEE.
- [2015] Cheng, J.; Danescu-Niculescu-Mizil, C.; and Leskovec, J. 2015. Antisocial behavior in online discussion communities. In ICWSM, 61–70.
- [2014] Coe, K.; Kenski, K.; and Rains, S. A. 2014. Online and uncivil? patterns and determinants of incivility in newspaper website comments. Journal of Communication 64(4):658–679.
- [2014] Colleoni, E.; Rozza, A.; and Arvidsson, A. 2014. Echo chamber or public sphere? predicting political orientation and measuring political homophily in twitter using big data. Journal of Communication 64(2):317–332.
- [2011] Conover, M.; Ratkiewicz, J.; Francisco, M. R.; Gonçalves, B.; Menczer, F.; and Flammini, A. 2011. Political polarization on twitter. ICWSM 133:89–96.
- [2013] Dadvar, M.; Trieschnigg, D.; and Jong, F. 2013. Expert knowledge for automatic detection of bullies in social networks. In 25th Benelux Conference on Artificial Intelligence, BNAIC 2013, 57–64. TU Delft.
- [2012] Dinakar, K.; Jones, B.; Havasi, C.; Lieberman, H.; and Picard, R. 2012. Common sense reasoning for detection, prevention, and mitigation of cyberbullying. ACM Transactions on Interactive Intelligent Systems (TiiS) 2(3):18.
- [2015] Gervais, B. T. 2015. Incivility online: Affective and behavioral reactions to uncivil political posts in a web-based experiment. Journal of Information Technology & Politics 12(2):167–185.
- [2010] Gonzalez-Bailon, S.; Banchs, R. E.; and Kaltenbrunner, A. 2010. Emotional reactions and the pulse of public opinion: Measuring the impact of political events on the sentiment of online discussions. arXiv preprint arXiv:1009.4019.
- [2007] Hox, J. J., and Bechger, T. M. 2007. An introduction to structural equation modeling.
- [2008] Hwang, H.; Borah, P.; Namkoong, K.; and Veenstra, A. 2008. Does civility matter in the blogosphere? examining the interaction effects of incivility and disagreement on citizen attitudes. In 58th Annual Conference of the International Communication Association, Montreal, QC, Canada.
- [2013] Kaczmirek, L.; Mayr, P.; Vatrapu, R.; Bleier, A.; Blumenberg, M.; Gummer, T.; Hussain, A.; Kinder-Kurlanda, K.; Manshaei, K.; Thamm, M.; et al. 2013. Social media monitoring of the campaigns for the 2013 german bundestag elections on facebook and twitter. arXiv preprint arXiv:1312.4476.
- [2016] Kollanyi, B.; Howard, P. N.; and Woolley, S. C. 2016. Bots and automation over twitter during the first us presidential debate. Comprop Data Memo.
- [2016] Nobata, C.; Tetreault, J.; Thomas, A.; Mehdad, Y.; and Chang, Y. 2016. Abusive language detection in online user content. In Proceedings of the 25th International Conference on World Wide Web, 145–153. International World Wide Web Conferences Steering Committee.
- [2016] Nulty, P.; Theocharis, Y.; Popa, S. A.; arnet, O.; and Benoit, K. 2016. Social media and political communication in the 2014 elections to the european parliament. Electoral studies 44:429–444.
- [2009] Perry, B., and Olsson, P. 2009. Cyberhate: the globalization of hate. Information & Communications Technology Law 18(2):185–199.
- [2017] Rüsel, J. T. 2017. Bringing civility back to internet-based political discourse on twitter research into the determinants of uncivil behavior during online political discourse. Master’s thesis, University of Twente.
- [2017] Schmidt, A., and Wiegand, M. 2017. A survey on hate speech detection using natural language processing. In Proceedings of the Fifth International Workshop on Natural Language Processing for Social Media. Association for Computational Linguistics, Valencia, Spain, 1–10.
- [2016] Silva, L. A.; Mondal, M.; Correa, D.; Benevenuto, F.; and Weber, I. 2016. Analyzing the targets of hate in online social media. In ICWSM, 687–690.
- [2017] Stambolieva, E. 2017. Methodology: detecting online abuse against women mps on twitter. Technical report, Amnesty International.
- [2016] Theocharis, Y.; Barberá, P.; Fazekas, Z.; Popa, S. A.; and Parnet, O. 2016. A bad workman blames his tweets: the consequences of citizens’ uncivil twitter use when interacting with party candidates. Journal of communication 66(6):1007–1031.
- [2017] Vargo, C. J., and Hopp, T. 2017. Socioeconomic status, social capital, and partisan polarity as predictors of political incivility on twitter: A congressional district-level analysis. Social Science Computer Review 35(1):10–32.
- [2016] Waseem, Z., and Hovy, D. 2016. Hateful symbols or hateful people? predictive features for hate speech detection on twitter. In SRW@ HLT-NAACL, 88–93.
- [2012] Weber, I.; Garimella, V. R. K.; and Borra, E. 2012. Mining web query logs to analyze political issues. In Proceedings of the 4th Annual ACM Web Science Conference, 330–334. ACM.
- [2015] Williams, M. L., and Burnap, P. 2015. Cyberhate on social media in the aftermath of woolwich: A case study in computational criminology and big data. British Journal of Criminology 56(2):211–238.
- [2017] Wulczyn, E.; Thain, N.; and Dixon, L. 2017. Ex machina: Personal attacks seen at scale. In Proceedings of the 26th International Conference on World Wide Web, 1391–1399. International World Wide Web Conferences Steering Committee.