Decoding the ultrafast formation of a Fermi-Dirac distributed electron gas
Abstract
Time- and angle-resolved photoelectron spectroscopy with temporal resolution is used to follow the different stages in the formation of a Fermi-Dirac distributed electron gas in graphite after absorption of an intense laser pulse. Within the first after excitation a sequence of time frames is resolved which are characterized by different energy and momentum exchange processes among the involved photonic, electronic, and phononic degrees of freedom. The results reveal experimentally the complexity of the transition from a nascent non-thermal towards a thermal electron distribution due to the different timescales associated with the involved interaction processes.
pacs:
78.47.J-, 79.60.-i, 63.20.kd, 81.05.ue, 81.05.ufThe extraordinary nonlinearities and optical response times of graphitic materials suggest useful applications in photonics and electronics
including light harvesting Winzer and Malić (2012); Tielrooij et al. (2015), ultrafast photodetection Xia et al. (2009); Gan et al. (2013), THz lasing Ryzhii et al. (2009); Karasawa et al. (2011), and saturable absorption Sun et al. (2009, 2010).
Both characteristics are closely linked to the ultrafast dynamics of photoexcited carriers which for this material class is governed by weakly screened carrier-carrier scattering and carrier-phonon interaction. Fundamental aspects related to these processes were addressed in different time-domain studies in the past Seibert et al. (1990); Strait et al. (2011); Winnerl et al. (2013); Johannsen et al. (2013); Stange et al. (2015). Because of limitations in the time resolution, most of these studies were restricted, however, to the characteristic timescales of electron-lattice equilibration, i.e., timescales ranging from to .
The primary processes directly after photoexcitation
are, in contrast, still largely unexplored and were investigated experimentally only in a few studies so far Breusing et al. (2009); Brida et al. (2013); Gierz et al. (2015a). The dynamics in this strongly non-thermal regime is determined by phenomena such as transient population inversion, carrier multiplication, Auger recombination, but also phonon-mediated carrier redistribution Winzer et al. (2010); Plötzing et al. (2014); Li et al. (2012); Gierz et al. (2015b).
The challenge is to decode the relative importance and temporal sequence of these processes that drive the electronic system from a nascent non-thermal distribution as generated by photoexcitation towards a Fermi-Dirac (FD) distribution within only Breusing et al. (2009); Brida et al. (2013).
It is obvious that such investigations rely on experiments capable of sampling this time window at an adequate time resolution of the order of , as well as high energy and momentum resolution.
This letter reports on the non-thermal carrier dynamics in highly-oriented pyrolytic graphite (HOPG) as probed in a time- and angle-resolved photoemission spectroscopy (trARPES) experiment that is operated near the transform limit at a resolution of (FWHM of the pump-probe cross correlation) Rohde et al. (2016). Over the first , we monitor the different stages in the temporal evolution of an initially non-thermal carrier distribution generated by the absorption of a near-infrared pulse. We are able to dissect the non-thermal to thermal transition into sub-stages that are characterized by different energy and momentum exchange and redistribution processes among the involved photonic, electronic, and phononic degrees of freedom. Specifically, the experimental data reveal that the initiating photo-absorption process is first followed by momentum redistribution of the excited carriers before effective cooling of the non-thermal carrier distribution due to emission of phonons sets in. An internally thermalized hot electron gas is finally formed after which on much longer timescales equilibrates with the lattice Kampfrath et al. (2005); Wang et al. (2010). The results show experimentally that on the extremely short non-thermal time frame of a few carrier thermalization can be a complex multi-step process owing to different timescales and efficiencies associated with momentum and energy relaxation.
Bulk samples of HOPG (Goodfellow Ltd.) were mechanically cleaved under high vacuum () right before the experiments.
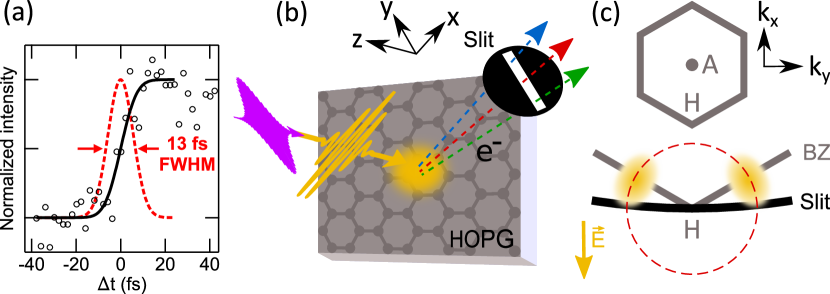
TrARPES was performed under ultra-high vacuum conditions () in a pump-probe configuration [Fig. 1(b)] using white light (WL) pump pulses ( center wavelength, RMS spectral width) and extreme ultraviolet (XUV) probe pulses (), both generated by the output of a 8 kHz Ti:sapphire multipass amplifier. Photoelectron spectra were recorded with a hemispherical electron analyzer at an energy resolution of . The relative orientation of the HOPG sample and analyzer entrance slit chosen for the experiments resulted in a momentum cut centered at the point as indicated by the black line in Fig. 1(c). Experiments were performed at near-normal incidence at two different incident pump fluences of and . The pump pulse polarization was oriented perpendicular to the momentum cut probed in photoemission as illustrated in Fig. 1(c). The FWHM of the cross correlation signal measured at the sample position yields a value of [see Fig. 1(a)] corresponding to a time resolution of () based on a definition introduced in Ref. Gierz et al. (2015a) (Ref. Gierz (2017)). All data were recorded at an equilibrium sample temperature of . Further details of the experimental setup are described in Ref. Rohde et al. (2016).
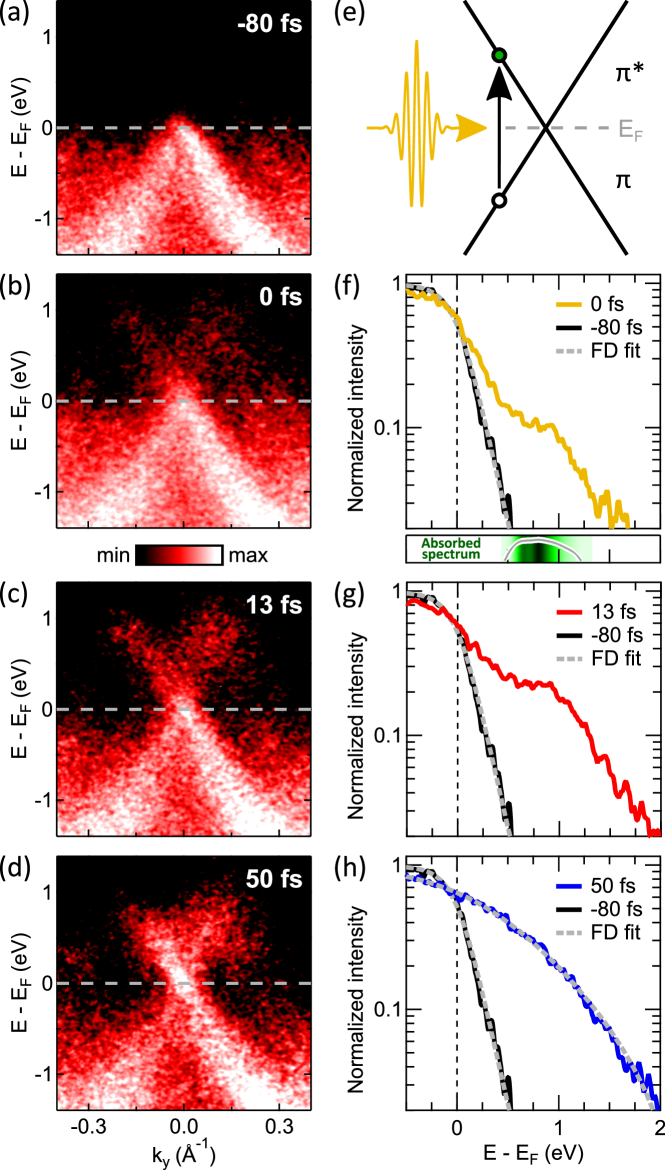
Figure 2(a) shows trARPES data of HOPG in the vicinity of the point and around the Fermi energy with the pump-probe time delay set to , i.e., prior to the excitation by the white light pump pulse. The occupied and downward-dispersing band of HOPG, which at exhibits an almost linear dispersion Zhou et al. (2006); Grüneis et al. (2008), is well resolved. No indications of the upward-dispersing band are visible, as expected for an undoped sample at thermal equilibrium. Figures 2(b)-2(d) show trARPES data recorded at a pump fluence of for selected time delays . Distinct changes in the excited state electron distribution taking place on a sub- timescale are clearly resolved in the experimental data. They become even more evident in a semi-logarithmic energy distribution curve (EDC) representation obtained by momentum integration of the raw data following a data analysis scheme described in Ref. Stange et al. (2015). Figures 2(f)-2(h) display the EDC intensities as a function of energy for the different time delays after excitation in comparison to the equilibrium state distribution at (). The initial equilibrium state EDC as well as the EDC for are well described by a FD distribution (see gray dashed lines). In contrast, the data recorded at time zero and at show clear deviations from a FD distributed population indicating the strong non-thermal character of the electronic system on sub- timescales Fann et al. (1992a).
To evaluate the thermal character of the electron gas at a given time delay two different quantities are separately extracted from each measured EDC: Firstly, we determine the best-fit Fermi-Dirac temperature Fann et al. (1992b) from a fit of a FD distribution to the data. Secondly, we numerically compute the integral
| (1) |
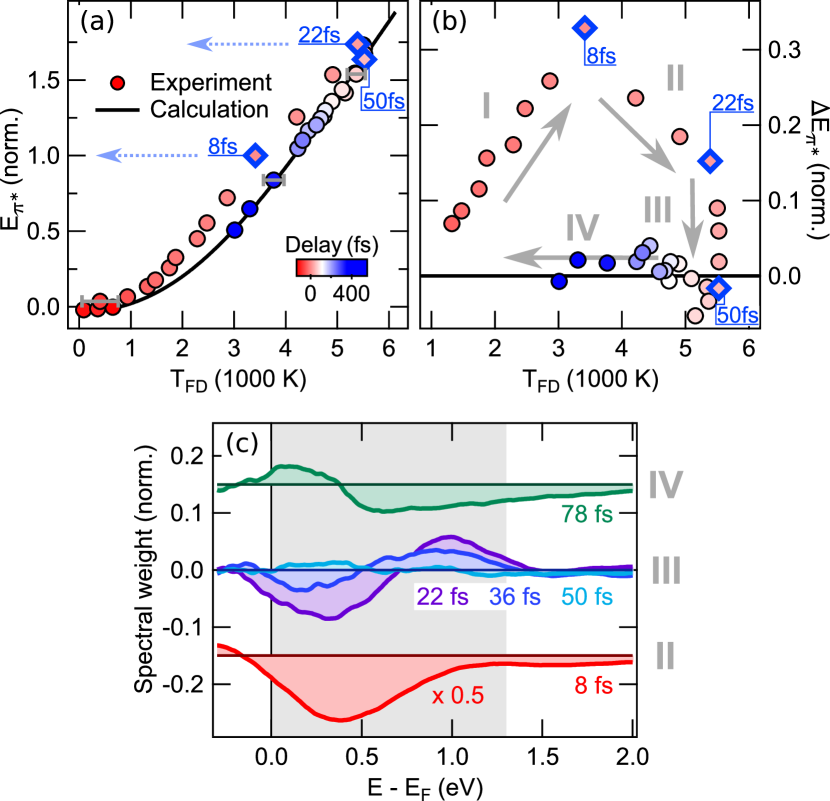
being a measure for the total energy stored in the band along the probed momentum cut. Figure 3(a) depicts the relation between and as it evolves in time in comparison to what is expected for a FD distributed electron gas (solid line). The color coding of the experimental data indicates the time delay of the measurement with red corresponding to small delays and blue corresponding to long delays. We consider the measured electron distribution being internally thermalized if the data points lie on top of the result for a FD distribution. The representation of the experimental data in Fig. 3(a) matches the expectation for the build-up and decay of a non-thermal electron distribution following an intense photoexcitation: In response to the absorption of the pump pulse, starts to increase around time zero and at the same time the data points leave the thermalized regime. Eventually the gain in stops and finally, at an equilibrium temperature of , the experimental data points merge into the thermalized regime again. For longer timescales, the electronic system stays internally thermalized and cools down due to coupling to the lattice. The different stages of the non-thermal to thermal transition become more evident in the representation of the data shown in Fig. 3(b). The graph displays the difference between experimental results and FD distribution as a function of . may be considered as a measure of the non-thermal component of . The distinct changes observable in the slope of vs. suggest the discrimination of four different stages of the thermalization process [labeled I-IV in Fig. 3(b)]. Time markers separating these stages (blue diamonds) are for comparison also added to the data in Fig. 3(a).
The first stage of the probed thermalization process (I) reflects the primary energy input into the electronic system directly resulting from the absorption of the pump pulse. Up to a time delay of we observe a continuous increase of , i.e., a continuous build-up of the non-thermal character of the electron gas. This timescale agrees well with the result of an evaluation for the temporal evolution of the absorbed pump energy under consideration of the experimental parameters: At the experiment probes a state of the electronic system where already of the total pump excitation energy has been absorbed.
The second stage of the thermalization process (II) lasts until and is characterized by a continuous decrease of [see Fig. 3(b)] while as well as still increase [see Fig. 3(a)]. In the following, we will argue how these observations are related to electron-electron and electron-phonon scattering processes, respectively. The overall detected energy input within stage II corresponds to of the energy that has been accumulated during the direct absorption process within the first stage [cf. arrows in Fig. 3(a)]. On these intermediate timescales, the photoexcited electron system itself is the only reservoir which can account for a substantial energy gain in the probed region of energy-momentum space. It is result of a carrier redistribution process that is driven by the primary momentum anisotropy generated in graphite upon photoexcitation with linearly polarized light Grüneis et al. (2003); Malic et al. (2011). For the pump pulse polarization used in the present study the situation is schematically illustrated in Fig. 1(c). Primary population maxima are generated at the intersection of the -cone and Brillouin zone boundary (yellow marked areas) and outside of the momentum cut probed in the experiment Grüneis et al. (2003). The observed secondary gain in results from a net population transfer out of these primary areas by scattering processes involving a finite azimuthal momentum transfer component, i.e., noncollinear scattering processes Mittendorff et al. (2014). On the relevant timescales and for the pump fluences used in the experiment, noncollinear scattering processes are predominantly due to the interaction of the electrons with strongly coupled optical phonons (SCOPs) Malic et al. (2012); Trushin et al. (2015); Aeschlimann et al. (2017). The time frame for the decay of the pump-induced momentum anisotropy as implied by our data matches well findings for graphene: Results of calculations show that for pump fluences in the range an isotropic momentum distribution is formed well within the first after excitation Aeschlimann et al. (2017). Polarization-dependent photoluminescence measurements performed at excitation fluences of hint to a characteristic timescale for this process of Danz et al. (2017).
The continuous decrease of the non-thermal character of the electron gas during the second stage as implied by the decrease of indicates that simultaneously with the phonon-driven decay of the momentum anisotropy the energy distribution of the electrons starts to converge towards a FD distribution. In the pump fluence regime of our experiment, this process is dominated by collinear scattering processes due to Coulomb interaction among the carriers Winzer and Malic (2013). This will further persist during the third stage of the thermalization process and finally results in the formation of a hot FD distribution at .
The signature discriminating the third stage (III) from the other stages is the onset of a net energy drain out of the electron system [decrease of , see Fig. 3(a)], while the electron distribution is still non-thermal (“non-thermal cooling”). It lasts for until at the comparison of the experimental data with the calculated results for a FD distribution indicate that finally the electronic system is internally fully thermalized. The energy drain is caused by electron-lattice interaction which for timescales is dominated by the interaction with SCOPs Kampfrath et al. (2005); Wang et al. (2010). Notably, during this initial energy relaxation stage the energy drain seems to affect only , which we associated with the non-thermal component of the electronic excitation, while stays virtually constant at its maximum value of . Figure 3(c) illustrates how this cooling process acts on the electron distribution. The graph displays difference intensities of experimental EDCs and a FD distribution at for different time delays before (), during (), and after () the non-thermal cooling stage. Whereas the experimental EDCs at ( ) and ( ) show significant deviations from the FD distribution at over the entire excitation energy regime, the deviations for and ( ) are limited to an intermediate energy regime between and . The high energy tails of these two EDCs match in contrast the thermalized behavior extremely well. In this part of the electron spectrum thermal equilibrium conditions corresponding to the maximum electron temperature of are anticipated already before the complete internal thermalization is achieved.
The energy drain by the interaction of the electrons with SCOPs during stage III should affect both, the ‘non-thermal’ as well as the ‘thermal’ part of the electron distribution. The internal thermalization of the electron gas promoted by carrier-carrier interaction results, on the other hand, in a net energy transfer from the ‘non-thermal’ to the ‘thermal’ part of the electron distribution. The observation of a rigid and thermalized high energy tail during the entire non-thermal cooling stage indicates that the latter process effectively compensates for the energy drain out of the thermal part due to interaction with the lattice.
The final stage of the thermalization process that can be discerned in Fig. 3 (IV, ) is characterized by the continuous and simoultaneous decrease of and with the experimental data following the expectations for a FD-distributed electron gas strikingly well. This is indicative for the cool-down of the internally thermalized electron distribution (thermal cooling) due to the interaction with the lattice. This temporal regime was previously studied in detail by various time-domain techniques Seibert et al. (1990); Kampfrath et al. (2005); Strait et al. (2011); Winnerl et al. (2013); Johannsen et al. (2013); Stange et al. (2015).
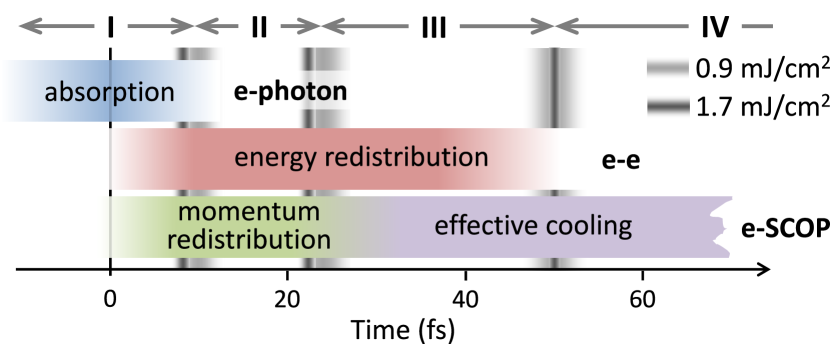
The transition of a photoexcited electron gas in HOPG from a nascent non-thermal towards a thermal distribution is completed within a time period as short as . The scenario involves electron-photon, electron-electron, and electron-phonon interaction affecting the response of the system on different timescales. In analyzing the temporal evolution of the excess energy deposited into the electronic system within , we were able to experimentally identify characteristic signatures of these interaction processes. Owing to the exceptional time resolution of the trARPES experiment used in the study we even succeeded in dissecting the complex thermalization process into different stages. The sequence of these stages and the characteristic timescales of energy and momentum exchange among the involved systems are summarized in Fig. 4. For the two fluences investigated in this work, no significant differences in the characteristic response times could be observed (see Fig. 4 and Supplemental Material Roh ). However, we expect significant changes at substantially lower fluences particularly as carrier-carrier scattering is very sensitive to the excited carrier density Winzer et al. (2013). On the other hand, indirect electronic transitions may become relevant at higher fluences due to saturation effects and Pauli blocking Yang et al. (2017). Moreover, the thermalization of the system can be affected by other experimental parameters such as bandwidth and photon energy of the applied pump pulses König-Otto et al. (2016). Similarly complex multi-step carrier thermalization scenarios are expected also for other materials with reduced screening. The response of these systems to an optical excitation is phenomenologically often described within multi-temperature models Anisimov et al. (1974) which consider the electronic system being internally thermalized for all times and therefore neglect for instance phonon emission during an internal thermalization stage Baranov and Kabanov (2014). The method presented here can provide valuable information on the actual state of the electron gas even on the extremely short ‘non-thermal’ timescales right after excitation.
This work was supported by the German Research Foundation (DFG) through project BA 2177/10-1.
References
- Winzer and Malić (2012) T. Winzer and E. Malić, Phys. Rev. B 85, 241404 (2012).
- Tielrooij et al. (2015) K. J. Tielrooij, L. Piatkowski, M. Massicotte, A. Woessner, Q. Ma, Y. Lee, K. S. Myhro, C. N. Lau, P. Jarillo-Herrero, N. F. van Hulst, and F. H. L. Koppens, Nat. Nanotechnol. 10, 437 (2015).
- Xia et al. (2009) F. Xia, T. Mueller, Y.-M. Lin, A. Valdes-Garcia, and P. Avouris, Nat. Nanotechnol. 4, 839 (2009).
- Gan et al. (2013) X. Gan, R.-J. Shiue, Y. Gao, I. Meric, T. F. Heinz, K. Shepard, J. Hone, S. Assefa, and D. Englund, Nat. Photonics 7, 883 (2013).
- Ryzhii et al. (2009) V. Ryzhii, M. Ryzhii, A. Satou, T. Otsuji, A. A. Dubinov, and V. Y. Aleshkin, J. Appl. Phys. 106, 084507 (2009).
- Karasawa et al. (2011) H. Karasawa, T. Komori, T. Watanabe, A. Satou, H. Fukidome, M. Suemitsu, V. Ryzhii, and T. Otsuji, J. Infrared, Millimeter, Terahertz Waves 32, 655 (2011).
- Sun et al. (2009) Z. Sun, A. G. Rozhin, F. Wang, T. Hasan, D. Popa, W. O’Neill, and A. C. Ferrari, Appl. Phys. Lett. 95, 253102 (2009).
- Sun et al. (2010) Z. Sun, T. Hasan, F. Torrisi, D. Popa, G. Privitera, F. Wang, F. Bonaccorso, D. M. Basko, and A. C. Ferrari, ACS Nano 4, 803 (2010).
- Seibert et al. (1990) K. Seibert, G. C. Cho, W. Kütt, H. Kurz, D. H. Reitze, J. I. Dadap, H. Ahn, M. C. Downer, and A. M. Malvezzi, Phys. Rev. B 42, 2842 (1990).
- Strait et al. (2011) J. H. Strait, H. Wang, S. Shivaraman, V. Shields, M. Spencer, and F. Rana, Nano Lett. 11, 4902 (2011).
- Winnerl et al. (2013) S. Winnerl, F. Göttfert, M. Mittendorff, H. Schneider, M. Helm, T. Winzer, E. Malic, A. Knorr, M. Orlita, M. Potemski, M. Sprinkle, C. Berger, and W. A. de Heer, J. Phys. Condens. Matter 25, 054202 (2013).
- Johannsen et al. (2013) J. C. Johannsen, S. Ulstrup, F. Cilento, A. Crepaldi, M. Zacchigna, C. Cacho, I. C. E. Turcu, E. Springate, F. Fromm, C. Raidel, T. Seyller, F. Parmigiani, M. Grioni, and P. Hofmann, Phys. Rev. Lett. 111, 027403 (2013).
- Stange et al. (2015) A. Stange, C. Sohrt, L. X. Yang, G. Rohde, K. Janssen, P. Hein, L.-P. Oloff, K. Hanff, K. Rossnagel, and M. Bauer, Phys. Rev. B 92, 184303 (2015).
- Breusing et al. (2009) M. Breusing, C. Ropers, and T. Elsaesser, Phys. Rev. Lett. 102, 086809 (2009).
- Brida et al. (2013) D. Brida, A. Tomadin, C. Manzoni, Y. J. Kim, A. Lombardo, S. Milana, R. R. Nair, K. S. Novoselov, A. C. Ferrari, G. Cerullo, and M. Polini, Nat. Commun. 4, 1987 (2013).
- Gierz et al. (2015a) I. Gierz, F. Calegari, S. Aeschlimann, M. Chávez Cervantes, C. Cacho, R. T. Chapman, E. Springate, S. Link, U. Starke, C. R. Ast, and A. Cavalleri, Phys. Rev. Lett. 115, 086803 (2015a).
- Winzer et al. (2010) T. Winzer, A. Knorr, and E. Malic, Nano Lett. 10, 4839 (2010).
- Plötzing et al. (2014) T. Plötzing, T. Winzer, E. Malic, D. Neumaier, A. Knorr, and H. Kurz, Nano Lett. 14, 5371 (2014).
- Li et al. (2012) T. Li, L. Luo, M. Hupalo, J. Zhang, M. C. Tringides, J. Schmalian, and J. Wang, Phys. Rev. Lett. 108, 167401 (2012).
- Gierz et al. (2015b) I. Gierz, M. Mitrano, J. C. Petersen, C. Cacho, I. C. E. Turcu, E. Springate, A. Stöhr, A. Köhler, U. Starke, and A. Cavalleri, J. Phys. Condens. Matter 27, 164204 (2015b).
- Rohde et al. (2016) G. Rohde, A. Hendel, A. Stange, K. Hanff, L.-P. Oloff, L. X. Yang, K. Rossnagel, and M. Bauer, Rev. Sci. Instrum. 87, 103102 (2016).
- Kampfrath et al. (2005) T. Kampfrath, L. Perfetti, F. Schapper, C. Frischkorn, and M. Wolf, Phys. Rev. Lett. 95, 187403 (2005).
- Wang et al. (2010) H. Wang, J. H. Strait, P. A. George, S. Shivaraman, V. B. Shields, M. Chandrashekhar, J. Hwang, F. Rana, M. G. Spencer, C. S. Ruiz-Vargas, and J. Park, Appl. Phys. Lett. 96, 081917 (2010).
- (24) See Supplemental Material for details on the experimental time resolution, further information to Fig. 3, and time-resolved ARPES data for .
- Gierz (2017) I. Gierz, J. Electron Spectros. Relat. Phenomena 219, 53 (2017).
- Zhou et al. (2006) S. Y. Zhou, G.-H. Gweon, J. Graf, A. V. Fedorov, C. D. Spataru, R. D. Diehl, Y. Kopelevich, D.-H. Lee, S. G. Louie, and A. Lanzara, Nat. Phys. 2, 595 (2006).
- Grüneis et al. (2008) A. Grüneis, C. Attaccalite, T. Pichler, V. Zabolotnyy, H. Shiozawa, S. L. Molodtsov, D. Inosov, A. Koitzsch, M. Knupfer, J. Schiessling, R. Follath, R. Weber, P. Rudolf, L. Wirtz, and A. Rubio, Phys. Rev. Lett. 100, 037601 (2008).
- Fann et al. (1992a) W. S. Fann, R. Storz, H. W. K. Tom, and J. Bokor, Phys. Rev. B 46, 13592 (1992a).
- Fann et al. (1992b) W. S. Fann, R. Storz, H. W. K. Tom, and J. Bokor, Physical Review Letters 68, 2834 (1992b).
- Grüneis et al. (2003) A. Grüneis, R. Saito, G. G. Samsonidze, T. Kimura, M. A. Pimenta, A. Jorio, A. G. S. Filho, G. Dresselhaus, and M. S. Dresselhaus, Phys. Rev. B 67, 165402 (2003).
- Malic et al. (2011) E. Malic, T. Winzer, E. Bobkin, and A. Knorr, Phys. Rev. B 84, 205406 (2011).
- Mittendorff et al. (2014) M. Mittendorff, T. Winzer, E. Malic, A. Knorr, C. Berger, W. A. de Heer, H. Schneider, M. Helm, and S. Winnerl, Nano Lett. 14, 1504 (2014).
- Malic et al. (2012) E. Malic, T. Winzer, and A. Knorr, Appl. Phys. Lett. 101, 213110 (2012).
- Trushin et al. (2015) M. Trushin, A. Grupp, G. Soavi, A. Budweg, D. De Fazio, U. Sassi, A. Lombardo, A. C. Ferrari, W. Belzig, A. Leitenstorfer, and D. Brida, Phys. Rev. B 92, 165429 (2015).
- Aeschlimann et al. (2017) S. Aeschlimann, R. Krause, M. Chávez-Cervantes, H. Bromberger, R. Jago, E. Malić, A. Al-Temimy, C. Coletti, A. Cavalleri, and I. Gierz, Phys. Rev. B 96, 020301 (2017).
- Danz et al. (2017) T. Danz, A. Neff, J. H. Gaida, R. Bormann, C. Ropers, and S. Schäfer, Phys. Rev. B 95, 241412 (2017).
- Winzer and Malic (2013) T. Winzer and E. Malic, J. Phys. Condens. Matter 25, 054201 (2013).
- Winzer et al. (2013) T. Winzer, E. Malić, and A. Knorr, Phys. Rev. B 87, 165413 (2013).
- Yang et al. (2017) Y. Yang, G. Kolesov, L. Kocia, and E. J. Heller, Nano Letters 17, 6077 (2017).
- König-Otto et al. (2016) J. C. König-Otto, M. Mittendorff, T. Winzer, F. Kadi, E. Malic, A. Knorr, C. Berger, W. A. de Heer, A. Pashkin, H. Schneider, M. Helm, and S. Winnerl, Phys. Rev. Lett. 117, 087401 (2016).
- Anisimov et al. (1974) S. Anisimov, B. Kapeliovich, and T. Perel’man, J. Exp. Theor. Phys. 66, 375 (1974).
- Baranov and Kabanov (2014) V. V. Baranov and V. V. Kabanov, Phys. Rev. B - Condens. Matter Mater. Phys. 89, 125102 (2014).