11email: alina@iac.es 22institutetext: Universidad de La Laguna (ULL), Dept. Astrofísica, E-38200 La Laguna, Tenerife, Spain 33institutetext: IRFU, CEA, Université Paris-Saclay, F-91191 Gif-sur-Yvette, France 44institutetext: Institut d’Astrophysique Spatiale, Universitè Paris-Sud, CNRS, UMR8617, 91405 Orsay, France 55institutetext: Tartu Observatory, Faculty of Science and Technology, University of Tartu, Observatooriumi 1, 61602, Töravere, Estonia
Characterization of a subsample of the Planck SZ source cluster catalogues using optical SDSS DR12 data
Abstract
Aims. The Planck catalogues of Sunyaev-Zeldovich (SZ) sources, PSZ1 and PSZ2, are the largest catalogues of galaxy clusters selected through their SZ signature in the full sky. In 2013, we started a long-term observational program at Canary Island observatories with the aim of validating 500 unconfirmed SZ sources. In this work we present results of the initial pre-screening of possible cluster counterparts using photometric and spectroscopic data of the Sloan Digital Sky Survey DR12. Our main aim is to identify previously unconfirmed PSZ2 cluster candidates and to contribute in determination of the actual purity and completeness of Planck SZ source sample.
Methods. Using the latest version of the PSZ2 catalogue, we select all sources overlapping with the SDSS DR12 footprint and without redshift information. We validate these cluster fields following optical criteria (mainly distance with respect to the Planck pointing, magnitude of the brightest cluster galaxy and cluster richness) and combining them with the profiles of the Planck Compton -maps. Together, this procedure allows for a more robust identification of optical counterparts compared to simply cross-matching with existing SDSS cluster catalogues that have been constructed from earlier SDSS Data Releases.
Results. The sample contains new redshifts for 37 Planck galaxy clusters that were not included in the original release of PSZ2 Planck catalogue . We detect three cases as possible multiple counterparts. We show that a combination of all available information (optical images and profile of SZ signal) can provide correct associations between the observed Planck SZ source and the optically identified cluster. We also show that Planck SZ detection is very sensitive even to high-z ( 0.5) clusters. In addition, we also present updated spectroscopic information for 34 Planck PSZ1 sources (33 previously photometrically confirmed and 1 new identification).
Key Words.:
large-scale structure of Universe – Galaxies: clusters: general – Catalogs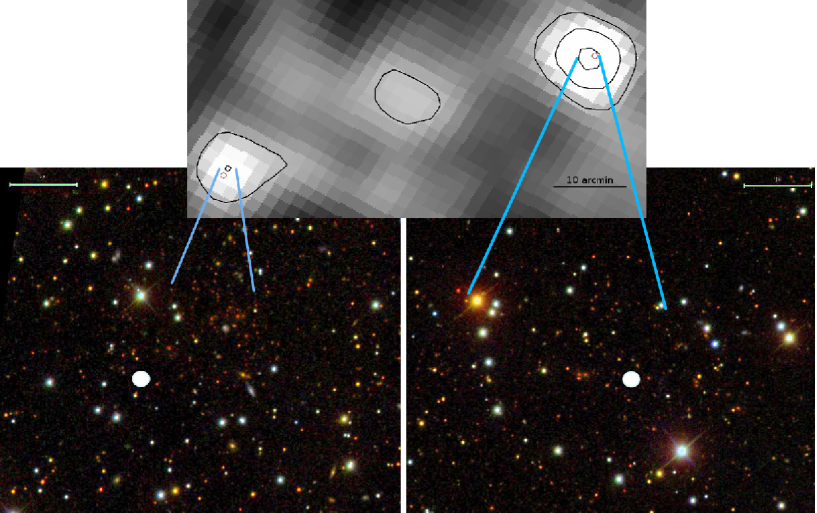
1 Introduction
Massive galaxy clusters are an excellent tool to test cosmological models and to constrain cosmological parameters, e.g., dark matter or dark energy densities (e.g., Vikhlinin et al. 2009; Planck Collaboration XX 2014). In the last decade, the Sunyaev-Zeldovich (SZ) effect (Sunyaev & Zeldovich 1972) is being used as a powerful technique to detect galaxy clusters. This effect produces a spectral distortion of the cosmic microwave background (CMB) generated by the inverse Compton interaction between the CMB photons and the hot intracluster gas of electrons. Using this technique, the Planck111Planck http://www.esa.int/Planck is a project of the European Space Agency (ESA) with instruments provided by two scientific consortia funded by ESA member states and led by Principal Investigators from France and Italy, telescope reflectors provided through a collaboration between ESA and a scientific consortium led and funded by Denmark, and additional contributions from NASA (USA). satellite provided for the first time the possibility of detecting galaxy clusters via the SZ effect in a full sky survey (Planck Collaboration XXIX 2014; Planck Collaboration XXVII 2015).
The early SZ (ESZ) catalogue presented 189 clusters detected from the first 10 months of survey data (Planck Collaboration VIII 2011). In 2013, the Planck Collaboration released the first official version of the SZ catalogue, the PSZ1, which included 1227 sources detected during the first 15.5 months of observations (Planck Collaboration XXIX 2014). Finally, in 2015, the second catalogue PSZ2 (Planck Collaboration XXVII 2015) presented a complete list from the full-mission survey of 29 months. It contains 1653 sources (716 of them are unique for PSZ2). Even today, the PSZ2 catalogue is the largest SZ-selected sample of galaxy clusters with full-sky coverage.
The SZ surface brightness is independent of the redshift, but no information on the source’s redshift can be obtained from the signal. Yet, the abundance of clusters at high-z are very sensitive to the cosmology (Borgani & Guzzo 2001), so the identification of the counterparts of SZ clusters at other wavelengths are absolutely mandatory to make these catalogues scientifically useful. In this context, a few extensive follow-up programmes of the Planck Collaboration have been dedicated to confirm SZ sources using on-earth and space facilities (Planck Collaboration Int. IV 2013; Planck Collaboration XXXVI 2016; Planck Collaboration Int. XXVI 2015).
Telescopes at Canary Islands Observatories are actively participating in the validation and characterization efforts of the ESZ and PSZ1 catalogues through the International Time Programme222ITP: http://www.iac.es/eno.php?op1=5&op2=13&lang=en (ITP12-2 and ITP13-08) (e.g., Planck Collaboration XXXVI 2016; Barrena et al. 2018). Since 2015, we started the second 2-year long-term follow-up programme (LP15) at the Observatorio del Roque de los Muchachos to confirm new PSZ2 Planck cluster candidates and to measure their redshifts and other physical properties. The current paper is a first publication from the serie of articles decicated to this follow-up campaign. In this paper, we present the results of the initial pre-screening of possible targets for this follow-up using the SDSS DR12 photometric and spectroscopic data available for PSZ2 targets. If a cluster counterpart is confirmed in the SDSS data, new imaging observations were not required in our LP15 programme and the cluster was directly considered for spectroscopy, with the aim of obtaining its mean redshift, velocity dispersion and dynamical mass. Whenever SDSS spectra were also available for several cluster members, we provide the spectroscopic redshift of the cluster based on those SDSS data and we considered it for a more detailed dynamical analysis. If the cluster were not confirmed through SDSS images, we included the cluster in our list of targets to retrieve deep imaging information in order to check the presence or absence of high-z counterparts.
This paper is organized as follows. Sections 2 and 3 describe the Planck PSZ2 catalogue and SDSS data, respectively. Section 4 describes our methodology used for new cluster identification. In Section 5, we discuss the results of the PSZ2 characterization here exposed. Section 6 provides updated spectroscopic information for PSZ1 sources. Conclusions are presented in Section 7.
2 The Planck PSZ2 cluster sample
The SZ detection algorithms applied to make the PSZ2 catalogue are extended and refined versions of those used to construct the PSZ1 (Planck Collaboration XXIX 2014). As in the case of PSZ1 sources, the PSZ2 cluster candidates are blindly selected using three different detection methods: two multifrequency methods based on the matched filter (MMF1 and MMF3) and the PowellSnakes (PwS) procedure, which is based on a fast Bayesian approach to discrete object detection. The main PSZ2 catalogue contains all objects found by at least one of these three methods with a S/N4.5. The PSZ2 catalogue and the techniques used to construct it are described in detail in Planck Collaboration XXVII (2015). Some additional restrictions were imposed in order to avoid the spurious detections from the PwS algorithm and to remove detections that were confirmed to be spurious by the PSZ1 follow-up. In summary, the PSZ2 catalogue contains 1653 detections (937 sources are common to PSZ1, while 716 are new; 291 of the PSZ1 catalogue are not in PSZ2). 1203 of these objects are confirmed clusters and 1094 have redshift estimates. Confirmation and redshift were obtained from PSZ1, cross-correlation with other catalogues (e.g. MCXC, ACT, SPT, RedMapper) and from the recent specific follow-up campaigns of different international teams (for detailed description see Sec.7 in Planck Collaboration XXVII 2015). The main difference in the optical identification of the PSZ1 and PSZ2 sources in the SDSS region is the use of redMaPPer information (Rykoff et al. 2014; Rozo & Rykoff 2014). 374 sources were cross-identified with a cluster in the v5.10 redMaPPer catalog, while further search of counterpart in SDSS data with the redMaPPer algorithm confirmed 17 additional sources (see Section 3).
3 Previous SZ follow-up using SDSS data
The SDSS data covers most of the northern extragalactic sky and provides optical images and spectra between 3800-9200 Å. Several cluster catalogues have been constructed using different data releases and detection algorithms (Hao et al. 2010; Wen et al. 2012). The optical validation of SZ sources in the PSZ1 catalogue has been done mainly through the cross-correlation with the cluster catalogue by Wen et al. (2012), which used the DR8 version of the SDSS data (Aihara et al. 2011). However, the redMaPPer cluster catalogue (Rykoff et al. 2014), using the DR8 release as well, contains many more clusters and has proven to be very efficient at optically identifying PSZ1, and latter PSZ2 clusters.
The method based on the redMaPPer algorithm detects clusters by selecting spatial overdensities of galaxies belonging to the red-sequence of the cluster candidate. This procedure is performed in a matching radius and imposing some constraints relative to the richness and the angular separation between sources. The algorithm provides photometric redshift information and richness estimates for all detected clusters. The newly released SDSS-based redMaPPer catalogue (v5.10) produced 374 high-quality matches where the counterparts are consistent with Planck mass and position information. More than half of these clusters are common for other catalogues, like WHL SDSS sources (Wen et al. 2012) or RXC X-ray sources (Piffaretti et al. 2011). However, for 95 new PSZ2 Planck sources, the redMaPPer catalogue provided the most robust external confirmation (redshift and position of the optical cluster).
Although the redMaPPer algorithm is proven to be very efficient, as all automatic methods, it has its own limitations. For example, low richness systems, in particular nearby clusters (0.05z0.2) are missed due to the high thresholds for richness estimates. Additionally, distant clusters (0.5) could be missed due to problems with photometric errors of the faint galaxies. In fact, the PSZ2 catalogue includes 17 confirmed clusters for which the automated redMaPPer search fails, but individual case-by-case inspection yields real counterparts.
For all these reasons, before starting the observational programme to optically validate unknown PSZ2 sources at Canary Islands observatories, an initial pre-screening of the target list in the SDSS database searching for new optical counterparts is absolutely necessary. We present in this work the results of this pre-screening with the advantage that, nowadays, using the DR12333http://www.sdss.org/dr12/ data release we manage a larger sky coverage and many more galaxy spectra than in previous releases. Therefore, the new information here presented includes two well defined parts. First, an optical validation of unconfirmed PSZ2 sources, and second, an update of the redshift information (going from photometric estimates to spectroscopic measurements) for the PSZ1 clusters.


4 Methodology for the validation and characterization of PSZ2 sources
The cross-correlation between positions of unconfirmed PSZ2 sources and the SDSS survey yields 114 SZ cluster candidates covered in the DR12 footprint. In order to validate these clusters, we design a four step criterium detailed in the following subsections.
4.1 Visual inspection on an individual basis
Using the SDSS DR12 Navigate tool444skyserver.sdss.org/dr12/en/tools/chart/naviinfo.aspx we retrieve a image centred at the nominal location of the Planck SZ source. We visually inspect the image looking for possible galaxy overdensities and the presence of a bright cluster galaxy (BCG). An image with a field of view of is large enough to cover the expected uncertainty in the Planck detection, which is a FWHM of (see Fig. 3 in Planck Collaboration XXXVI 2016). Clusters and rich groups at 0.10.4 can be easily identified in the SDSS RGB images as a concentration of galaxies of the same colour. This first step, the visual inspection, is particularly important in the detection of clusters with . The SDSS photometric survey is 95% complete at a magnitude limit of ’=22.2. This means that only BCGs and a few additional galaxy members will be visible in clusters at . In addition, faint galaxies present larger photometric errors and thus redshift uncertainties. Therefore, distant clusters can be easily missed by automatic algorithms, but the “inspection by eye” can easily detect these systems.
Some SDSS images show problems with the presence of very bright stars, which make the automatic detection of sources almost impossible. In some cases, the SDSS database does not supply photometric information, mainly because the field is located in the edge of the surveys. Due to these facts, we removed 10 sources from the initial list of 114 cluster candidates. These cluster fields are considered to be observed by our follow-up program (LP15) with the Canary Islands telescopes.
4.2 Inspection of Compton y-maps
The full-sky Compton parameter maps (-map) obtained by the Planck Collaboration using the NILC and MILCA procedures (Planck Collaboration XXI 2014) are publicly available since 2015 (Planck Collaboration XXII 2015). These maps, constructed from linear combinations of the individual Planck frequency charts, preserve the SZ signal and cancel the influence of the CMB. These maps have been widely exploited in the literature. For example, they are used to obtain an accurate measurement of the SZ power spectrum at intermediate and large angular scales (Planck Collaboration XXII 2015), or to study the SZ effect using higher order statistical estimators, such as the skewness and the bispectrum. The -map is also used to extract the SZ signal on regions centred at cluster positions and, in particular, to perform stacking analyses (Planck Collaboration XXII 2015). These -maps also reveal the diffuse emission at the outskirts of clusters and in bridges between merging systems (Planck Collaboration Int. VIII 2013). Moreover, -maps show SZ signatures even for poor galaxy clusters and they help in the confirmation of cluster candidates from PSZ1 catalogue (Planck Collaboration XXXVI 2016; Barrena et al. 2018).

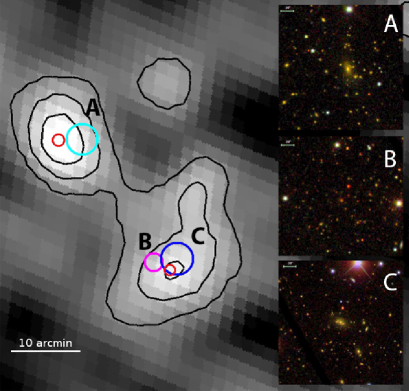
In Fig. 1 we present two typical examples of coincidences between the observed SZ profile and optical images for rich optical clusters. The -map shows two clear peaks well above the noise level corresponding to two real optical clusters located at angular distance of . One is the already-confirmed cluster PSZ2 G066.4127.03 (WHL J269.219+40.13, Planck Collaboration Int. XXVI 2015). After exploration of the SDSS images we could confirm the second source, PSZ2 G066.3426.14.
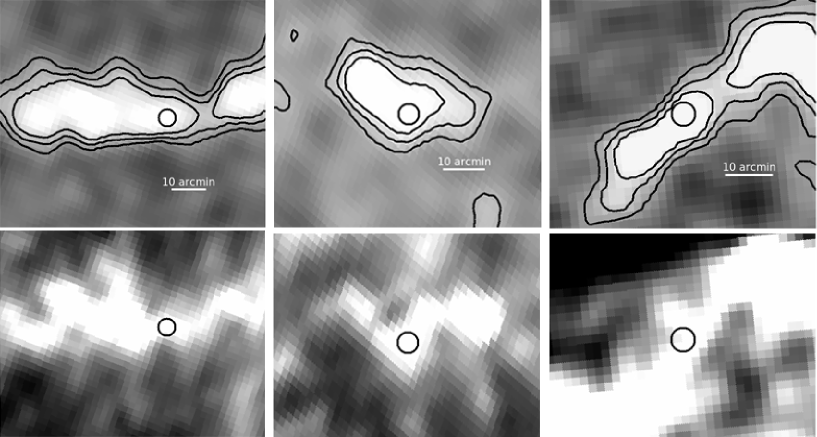
Although -maps are a valuable source of information for validation works, they must be used with care. It is known that the SZ reconstruction might be influenced by the Galactic dust radio emission. In some cases, dust emission may enhance the SZ signal, creating spurious detections. Such situations can be partially controlled by the measurements of Galactic extinction in the considered area, and by visual examination of the optical (mainly band) images and -map shapes. In case of strong contamination by Galactic dust, the distribution of the signal in the -maps is not compact and shows elongated profiles without a clear peak around the nominal position of the Planck SZ source. In many cases, the elongation of the -map contours agrees well with the direction of Galactic dust structures visible in the band image. Barrena et al. (2018), Planck Collaboration XXXVI (2016) and van der Burg et al. (2016) confirmed this fact by classifying a large amount of PSZ1 targets as ”non-detections”, most of them located at low Galactic latitudes and showing high SZ significance, even S/N in some cases (for example PSZ1 G071.6442.76). Fig. 2 present three examples of -maps for the PSZ2 targets where no optical counterparts have been identified. The possibility of counterparts associated with high redshift clusters is not excluded, but only deeper optical images would confirm or reject this fact. However, the irregular contour profiles observed in -maps and its morphological coincidence with the structure observed at 857 GHz (thermal dust emission) suggest that the most probable scenario is a false SZ detection.
Taking into account all facts outlined above, we have inspected the -map (obtained through the MILCA algorithm) of each PSZ2 source paying special attention to the profile shape, SZ signal and intensity above the noise level (310-6 in units of the corresponding -map).
4.3 Cluster red sequence
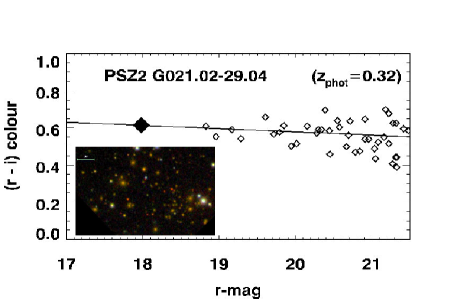
We retrieve SDSS DR12 photometry for each field and the photometric redshift information of galaxies using SQL Search555skyserver.sdss.org/dr12/en/tools/search/sql.aspx. We inspect colour-magnitude diagrams (see Fig.3) (,) and (,) looking for the cluster-red sequence (CRS) (e.g., Gladders & Yee 2000). We fit the red sequence considering all galaxies with colours in the range respect the colour of the BCG. This allows us to derive the photometric redshift of the galaxy overdensities following prescriptions detailed in Planck Collaboration XXXVI (2016), Sec. 4.2. After identifying the galaxy clumps and deriving their , we evaluate the richness of these systems in order to validate the galaxy overdensities as actual SZ counterparts. We detail this process in the following subsection.
4.4 Richness
The SZ clusters of the Planck catalogue are massive structures (see e.g. Fig. 28, 29 in Planck Collaboration XXIX 2014). Assuming that cluster ”richness” can be understood as ”optical mass tracer” (e.g., Rozo et al. 2009b), galaxy clusters associated with Planck SZ emission should also present rich galaxy cluster populations. So, in order to validate our SZ detection, we can estimate the richness of the galaxy population in our optical cluster sample.
Rozo et al. (2009a, b) propose a robust richness estimators from optical catalogues assuming a matched filter model for the density profile of galaxies. This method is part of the redMaPPer algorithm and proposed to be applied in photometric catalogues which sample the galaxy population of the systems. However, our sample includes clusters at intermediate redshift, where only the brightest galaxies are visible, making it very difficult to find confidence models to the galaxy density profiles. In addition, we consider SDSS photometry, which is not a very deep photometric survey.
A simple prescription to estimate the richness of a cluster is to compute the actual number of cluster galaxies in a magnitude range within the virialized region. For a given cluster with a photometric redshift , we count likely cluster members (assumed as galaxies within ) of the of the cluster showing - magnitudes in the range within the 0.5 Mpc from the cluster centre. For this task we consider as a BCG the most luminous galaxy inside the identified likely cluster members. In order to obtain the background subtracted richness and decontaminate from the galaxy field contribution, we compute galaxy counts in a degrees region (centred at RA=10:28:00, DEC=55:20:00) where SDSS DR12 photometric sample presents an homogeneous total coverage. We apply the same procedure as for the cluster region (assuming the same and - magnitudes ranges), thereby creating a ”field galaxy sample” or ”local background” for each cluster. This field sample was scaled to the 0.5 Mpc area and subtracted from the cluster counts to obtain a statistical estimate of the number of galaxies for each cluster.
However, one of the main problems to estimate the richness in clusters at medium-high redshift () is the magnitude limit of the photometric sample. Given that SDSS DR12 sample is 95% complete666http://www.sdss.org/dr12/scope/ down to ’=22.2, we restrict this study to . Beyond this redshift the magnitude is higher than the magnitude limit =22.2. Another source of underestimation of richness is the faintness of the galaxy clusters at medium-high redshift. Possible errors in estimates of faint galaxies may introduce large uncertainties in the cluster counts, and therefore making a robust richness estimate very difficult. Nonetheless, we consider the richness an indicative parameter in order to distinguish between the real and false counterparts at .
The mass-redshift distribution of the Planck SZ sources is described in Planck Collaboration XXXII (2015), which provides the detectable mass of SZ sources in the PSZ1 catalogue. Following this relation, no poor systems could be considered actual counterparts even if they are well aligned with the Planck pointing. However, the Planck CMB and -maps contain noise, making it possible that a significant fraction of low-mass haloes scatter over the SZ detection threshold. This effect is known as Eddington bias (Eddington 1913). van der Burg et al. (2016) analyze this effect and confirm 19 SZ clusters at 0.5 with M M. Moreover, nearby () galaxy systems may also be detected in the Planck SZ maps even if they have masses M M. Clusters with lower masses are not expected to be actual SZ counterparts.
In order to find an appropriate threshold to separate real from false counterparts, we study the richness (as mass tracer) of two poor galaxy clusters. These are Abell 725 and Abell 796, at 0.092 and 0.157, which present global velocity dispersions of km s-1 and km s-1, respectively (Boschin et al. 2008). The mass estimates of these systems show MM, so they are low mass clusters. By calculating the richness, as defined above, we find that Abell 725 presents 8 cluster members within a region of 0.5 Mpc radius in the magnitude range . In the same way, Abell 796 presents a richness of 5 galaxies. Therefore, taking into account these numbers, we can conclude that clusters can be considered actual SZ counterparts if they present a richness at least of 5 galaxies, according to our richness definition.
In order to make our sample selection uniform and taking into account the large photometric errors for faint distant sources, we assumed this richness cut for high-z clusters as well. However, we noticed that most of our high-z clusters ( 0.4) have R higher than 5, following the expected trend.
4.5 Spectroscopic data
In addition to the photometric information, we also use the SDSS DR12 spectroscopic information available around the Planck PSZ2 source positions. We also use the SDSS-III photometric cluster catalogue by Wen et al. (2012), the group galaxy catalogue constructed by Tempel et al. (2014) of low-redshift candidates, and the DR12 BOSS-CMASS galaxy list for the high redshift clusters. We complement this information with some spectroscopic results obtained with the validation programs (Planck Collaboration XXXVI 2016). Given that PSZ2 counterparts show a few galaxy members with spectroscopic redshifts, the spectroscopic information was only used to determine the exact redshift of the cluster.
5 Results for the PSZ2 catalogue
Our validation and characterization procedure is based on the simultaneous use of optical images and Compton -maps. By analyzing already-confirmed PSZ1 and PSZ2 sources, we find that, in most cases, there is a strong dependence between the location of the optical counterpart and the intensity, shape and size of the SZ signal in the -maps especially for high SNR clusters. This dependence could be extrapolated to still unconfirmed sources, and could help to confirm less rich and less concentrated clusters.
Using this combined approach, we were able to identify optical counterparts for 54 new Planck PSZ2 cluster candidates.
In Fig. 4 (left plot) we present the apparent -band magnitudes of the Bright Central Galaxies (BCGs) versus redshift of the complete sample of 54 sources studied in this work. Following Menanteau & Hugues (2009), the dashed curve corresponds to the simple prescription , and assuming passive evolution with redshift. The values for are taken from Blanton et al. (2003), and the effective wavelengths for each SDSS filter are taken from Table 1 in Blanton & Roweis (2007). As expected, all the identified BCGs identified show magnitudes brighter than , which represents a necessary condition for a correct cluster identification.
In addition, in order to obtain a robust confirmation of optical counterpart, we take into account the distance between optical centre and the nominal Planck SZ coordinates. The position error predicted for SZ detections in the Planck SZ maps is about for targets in the PSZ1 sample (Planck Collaboration XXIX 2014; Barrena et al. 2018). Therefore, optical counterparts are not expected to be found beyond 2.5 times the beam FWHM, which means that the cluster associated with the SZ effect should be closer than from the SZ PSZ1 source coordinates. However, when the clusters are nearby systems () their apparent radius may fill a large region, and in these cases their centre offsets relative to their SZ position may be larger. Fig. 4 (right panel) shows the distance of the 51 cluster optical centres to the nominal PSZ2 coordinates. No optical counterparts, except PSZ2 G231.41+77.48 and PSZ2 G084.69-58.60, are found beyond from Planck nominal pointing at . We include these clusters as true counterparts due to its specific shape seen in -map (see Fig. 8 and discussion below). Fig. 5 shows the final offset distribution of cluster optical centre relative to their Planck SZ position. We find that 68% of the 37 confirmed cluster sample are enclosed within , which is consistent with what is expected for SZ Planck target selection (Planck Collaboration XXIX 2014; Barrena et al. 2018).
In Table 1 we summarize our results for the first subgroup of 37 sources (distance or/and inside 1 Mpc and richness 5), providing the official ID number, taken from the PSZ2 catalogue, the Planck Name, optical counterpart coordinates (assumed to be the BCG position or, in the absence of BCG, as approximate geometrical centre of the likely members), redshift (photometric and, if available, spectroscopic) and number of spectroscopically confirmed galaxy members. We also provide spectroscopic information for 10 sources: 8 have spectroscopic coverage from the SDSS DR12 survey and, for two cases we quote the spectroscopic redshift from our long-slit observations using ACAM spectrograph installed at the William Herschel Telescope (for a full description of the used instruments set-up see Planck Collaboration XXXVI 2016). Multiple optical counterparts are identified for three SZ sources. We also provide richness information for each cluster. Most of our optical counterparts are clusters included in the catalogue of Wen et al. (2012). However, we update the position (attending to the BCG identifications) and redshift information. All clusters have signal-to-noise ratio (SNR) of the SZ signal (using the MMF1, MMF3 or PwS detection pipelines) between 4.5 and 5.8 except PSZ2 G237.68+57.83 (SNR=7.4) and PSZ2 G153.56+36.82 (SNR=15.9).
The second subgroup of 17 clusters does not fit the conditions of minimal distance and richness imposed to be considered actual optical counterparts linked to the SZ emission. This means that this group of clusters are beyond from the nominal Planck SZ centre or are not rich enough systems. However, due to the fact that some of the Planck clusters from the PSZ1 catalogue were already detected at larger distances by the previous teams (see Planck Collaboration XXXVI 2016; Barrena et al. 2018) and that these objects correspond to actual clusters in SDSS DR12 images, we decided to keep these sources for further detailed investigation. So, we quote them as ”possible counterparts” and present them in Table 2.
In the rest of the cases, the cluster identification performed on SDSS DR12 imaging data was not conclusive. Those SZ targets may be associated to areas with strong dust contamination (so producing false SZ detections in the Planck maps), or the corresponding cluster counterparts are high redshift clusters, so not visible in the SDSS images due to their low depth. We will re-observe these fields during our follow-up in order to obtain deep images and confirm either the distant cluster or false SZ detection.
In the following, we describe, as example, results for a few clusters at different redshifts.
PSZ2 G069.3515.58
This is a low redshift system at 0.09 (see Fig. 7). We obtain R = 25 for this cluster, which is one of the richness of the clusters studied in this work. We have acquired spectroscopic redshifts for two cluster members using ACAM/WHT long-slit spectroscopy under an International Time Program (ITP13) of the ORM, obtaining a mean of 0.095.
PSZ2 G086.2874.76
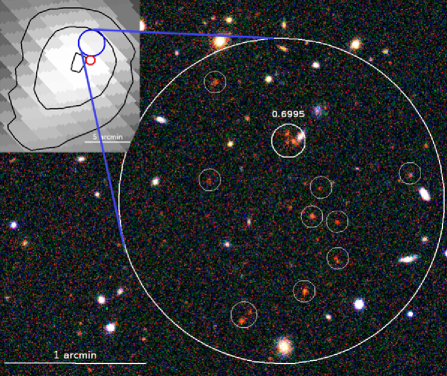
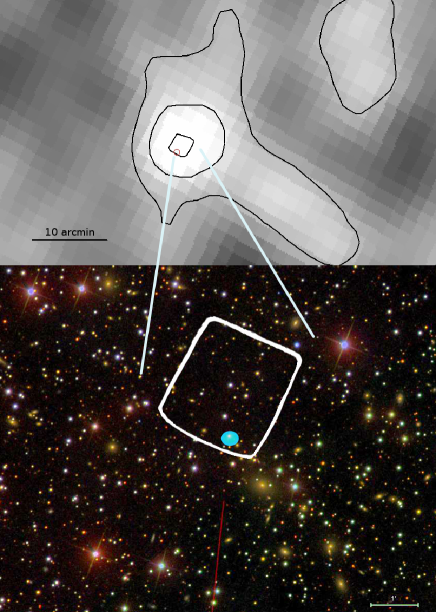
The importance of visual inspection of RGB images is clearly shown with this example (see Fig. 6, left panel). This is a distant cluster at 0.6995. Due to this high redshift, the cluster galaxy population is very faint. The BCG has an apparent magnitude of ’=21.63, so the SDSS catalogues only include photometry for a few cluster members, thus the red sequence is completely missing in the corresponding colour-magnitude diagrams. For this reason, the richness cannot be estimated. However, by ”eye inspection” we are able to identify 12 likely cluster members with colours in agreement with a 0.75. Moreover, the brightest galaxy (probably the BCG of this cluster) has a 0.6995 in the SDSS DR12 spectroscopic catalogue.
PSZ2 G231.41+77.48
Even though this cluster is slightly beyond the limit of our accepted 5 radius search (5.7), the MILCA contours confirm that this cluster is our optical counterpart to the SZ signal (Fig. 8). We found 2 spectra (including the BCG) at 0.346. A similar situation appears with PSZ2 G084.69-58.6, which shows a similar shift between the peak of the SZ signal (-map) and the nominal Planck position.
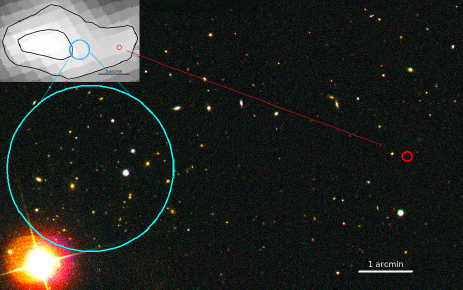
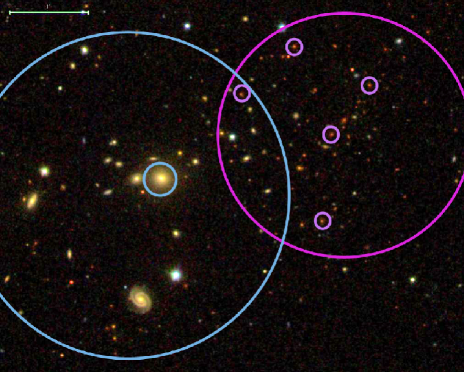
PSZ2 G270.7836.83 and PSZ2 G270.8837.23
These two PSZ2 sources are separated by a distance of 25 (see Fig. 6, right panel). The optical counterpart of PSZ2 G270.88+37.23 is a rich cluster (R=15) at 0.23 catalogued by Wen et al. (2012) as WHL J110504.6-185639. However, PSZ2 G270.78+36.83 seems to be a multiple detection, potentially associated with two clusters at different redshifts along the line of sight and almost overlapping in the sky plane. One of these two clusters is a system at 0.22, while the second clump is a system at 0.52. Probably both clusters are contributing to the SZ emission, although their separate contribution requires further investigation. In total, we find three cases like this, where multiple counterparts are associated with a single SZ source. We mark these sources with a special symbol in the Table 1.
6 Results for the Planck PSZ1 catalogue
We also inspect SDSS DR12 data in order to update the spectroscopic redshift information of PSZ1 clusters that were already confirmed photometricaly (Planck Collaboration XXXII 2015). We find 71 cluster fields in the SDSS footprint, but only 48 of them have also spectroscopic coverage. We have been able to retrieve spectroscopic information for 33 clusters, namely cases where likely members were spectroscopically observed. Almost half of the clusters have only one or two galaxy members with spectra. However, in five cases we find more than 10 members. In all 33 identifications, spectroscopic redshifts were in good agreement with the previous photometric data. No significant discrepancy was detected. The main reason for this is that an important fraction of these previous identifications belong to clusters retrieved through the cross-correlation of the original PSZ1 catalogue with the SDSS-III photometric cluster catalogue by Wen et al. (2012).
Additionally, we inspect a few still unconfirmed PSZ1 clusters inside the SDSS DR12 data and we have been able to identify the optical counterparts for the Planck SZ source PSZ1 G213.95+68.28. There are two possible identifications for this target, both of which are spectroscopically confirmed (see Fig. 9). This is a new case of multiple detection with two clear clusters at different redshifts along the line of sight. The low-z cluster is at 0.10, showing about 50 likely members, 10 of them being spectroscopically confirmed. This low-z cluster coincides with a compact cluster in the background, at 0.601. In fact, PSZ1 G213.95+68.28 is a rich structure with five cluster members at 0.5950.603 and 12 likely members showing a 0.6. However, both systems are inside the peak of the Planck SZ detection in the -maps and thus probably both are contributing to the SZ emission.
The identification of the BCG in clusters at low redhisft is straightforward. However, in clusters at the BGC is not so clear. In general, clusters at high redshift are young and not so evolved structures, and have less luminous and smaller BCGs than clusters at lower (Ascaso et al. 2011). In such cases, several galaxies are typically found with very similar magnitudes in the core of the clusters. Therefore, for these high redshift clusters we provide the coordinates of the average position of all spectroscopically confirmed members.
Our new spectroscopic redshifts for the PSZ1 sources are presented in Table 3.
7 Conclusions
We carried out a detailed study of Planck PSZ2 targets using optical information from SDSS DR12. The technique presented here also combines the information from the Compton -maps. We implement restrictions concerning the optical richness and distance from the nominal Planck pointing in order to validate the cluster counterparts. Together, this procedure allows for a more robust identification of optical counterparts compared to simply cross-matching with existing SDSS cluster catalogues that have been constructed from earlier SDSS Data Releases.
Using this method we confirm 37 new Planck PSZ2 clusters. We also identified 17 clusters more in the SDSS images potentially associated with the corresponding SZ emission. However, this cluster sample does not follow completely the distance/richness requirements. These clusters could contribute somehow to the corresponding SZ emission but further investigations (mainly multiobject spectroscopy to obtain dynamical masses) are needed.
For 11 of the 37 new clusters we present spectroscopic redshifts (for 9 clusters from SDSS DR12 database, and 2 clusters from our long-slit observations using ACAM/WHT). Three SZ sources present multiple optical counterparts. For these cases, we find several clusters along the line of sight of the SZ signal.
Finally, we present updated spectroscopic information for 34 Planck PSZ1 sources, 33 of them being previously confirmed photometrically. Additionally, we validate the cluster PSZ1 G213.95+68.28. This is a PSZ1 source showing two clusters along the line-of-sight at and .
The work presented here is part of a more general programme to optically validate Planck SZ sources trying to determine the purity and efficiency of cluster detections in Planck SZ maps.
Acknowledgements.
We thank Monique Arnaud for helpful comments. This research has made use of the following databases: the SZ-Cluster Database operated by the Integrated Data and Operation Center (IDOC) at the IAS under contract with CNES and CNRS; and the SDSS. Funding for the Sloan Digital Sky Survey (SDSS) has been provided by the Alfred P. Sloan Foundation, the Participating Institutions, the National Aeronautics and Space Administration, the National Science Foundation, the U.S. Department of Energy, the Japanese Monbukagakusho, and the Max Planck Society. This research has been carried out with telescope time awarded by the CCI International Time Programme at the Canary Islands observatories (program ITP13-8). The article is based on observations carried out at the William Herschel Telescope operated on the island of La Palma by the ISAAC Newton Group of Telescopes in the Spanish ORM of the IAC. This work has been partially funded by the Spanish Ministry of Economy and Competitiveness (MINECO) under the projects ESP2013-48362-C2-1-P and AYA2014-60438-P. AS and RB acknowledge financial support from the Spanish Ministry of Economy and Competitiveness (MINECO) under the 2011 Severo Ochoa Program MINECO SEV-2011-0187. HL was supported by Estonian Research Council (ETAg) projects PUT1627, IUT26-2 and IUT40-2, and by the Centre of Excellence ”Dark side of the Universe” (TK133) financed by the European Union through the European Regional Development Fund. RFJvdB acknowledges support from the European Research Council under FP7 grant number 340519.References
- Aihara et al. (2011) Aihara, H., Allende Prieto, C., An, D., et al. 2011, ApJS, 193, 29
- Ascaso et al. (2011) Ascaso, B., Aguerri, J. A. L., Varela, J., et al. 2011, ApJ, 726, 69
- Barrena et al. (2018) Barrena, R., Streblyanska, A., Ferragamo, A. et al. 2018, A&A, submitted
- Blanton et al. (2003) Blanton, M., et al. 2003, ApJ, 592, 819B
- Blanton & Roweis (2007) Blanton, M., & Roweis, S., 2007, AJ, 133, 734B
- Borgani & Guzzo (2001) Borgani, S., & Guzzo, L. 2001, Nature, 409, 39
- Boschin et al. (2008) Boschin, W., Barrena, R., Girardi, M., & Spolaor, M. 2008, A&A, 487, 33
- Buddendiek et al. (2015) Buddendiek, A., Schrabback, T., Greer, C. H., et al. 2015, MNRAS, 450, 4248
- Eddington (1913) Eddington, A. S. 1913, MNRAS, 73, 359
- Gladders & Yee (2000) Gladders, M. D., & Yee, H. K. C. 2000, AJ, 120, 2148
- Hao et al. (2010) Hao, J., McKay, T. A., Koester, B. P., et al. 2010, ApJS, 191, 254
- Menanteau & Hugues (2009) Menanteau, F., & Hugue, J. P. 2009, ApJ, 694, 136
- Piffaretti et al. (2011) Piffaretti, R. et al. 2011, A&A, 534, A109
- Planck Collaboration VIII (2011) Planck Collaboration VIII. 2011, A&A, 536, A8
- Planck Collaboration Int. IV (2013) Planck Collaboration Int. IV. 2013, A&A, 550, A130
- Planck Collaboration Int. VIII (2013) Planck Collaboration Int. VIII. 2013, A&A, 550, A134
- Planck Collaboration XX (2014) Planck Collaboration XX. 2014, A&A, 571, A20
- Planck Collaboration XXI (2014) Planck Collaboration XXI. 2014, A&A, 571, A21
- Planck Collaboration XXIX (2014) Planck Collaboration XXIX. 2014, A&A, 571, A29
- Planck Collaboration XXXII (2015) Planck Collaboration XXXII. 2015, A&A, 581, A14
- Planck Collaboration Int. XXVI (2015) Planck Collaboration Int. XXVI. 2015, A&A, 582, A29
- Planck Collaboration XXVII (2015) Planck Collaboration XXVII. 2015, A&A, 594, A27
- Planck Collaboration XXXVI (2016) Planck Collaboration XXXVI. 2016, A&A, 586, A139
- Planck Collaboration XXII (2015) Planck 2015 results. XXII. 2016, A&A, 594, A22
- Rozo et al. (2009a) Rozo, E., Rykoff, E. S., Koester, B. P., et al. 2009, ApJ, 703, 601
- Rozo et al. (2009b) Rozo, E., Rykoff, E. S., Evrard, A., et al. 2009, ApJ, 699, 768
- Rozo & Rykoff (2014) Rozo, E., & Rykoff, E. S. 2014, ApJ, 783, 80
- Rykoff et al. (2014) Rykoff, E. S., Rozo, E., Busha, M. T., et al. 2014, ApJ, 785, 104
- Sunyaev & Zeldovich (1972) Sunyaev, R. A. & Zeldovich, Y. B. 1972, Comments on Astrophysics and Space Physics, 4, 173
- Tempel et al. (2014) Tempel, E., Tamm, A., Gramann, M., et al. 2014, A&A, 566, A1
- van der Burg et al. (2016) van der Burg, R. F. J., Aussel, H., Pratt, G. W., et al. 2016, A&A, 587, A23
- Vikhlinin et al. (2009) Vikhlinin, A., Kravtsov, A. V., Burenin, R. A., et al. 2009, ApJ, 692, 1060
- Wen et al. (2012) Wen, Z. L., Han, J. L., & Liu, F. S. 2012, ApJS, 199, 34
| ID | Planck Name | R. A. | Decl. | Cen. | Nspec | R | comments | ||||
|---|---|---|---|---|---|---|---|---|---|---|---|
| 34 | PSZ2 G009.04+31.09 | 16:18:26.70 | -04:11:11.06 | 1 | 0.25 | 0 | 0 | 0 | 17.42 | 31 5.5 | WHL J161826.7-041111 |
| 68 | PSZ2 G021.02-29.04 | 20:20:28.21 | -22:25:14.92 | 1 | 0.32 | 0.305a | 0 | 2a | 17.74 | 15 3.8 | WHL J202028.2-222515 |
| 115 | PSZ2 G032.31+66.07 | 14:37:24.97 | +24:23:54.96 | 2 | 0.62 | 0.609 | -1 | 6 | - | WHL J143725.0+242355 | |
| 161 | PSZ2 G044.21+52.13 | 15:42:50.44 | +27:49:52.90 | 1 | 0.39 | 0.378 | 0.3775 | 2 | 18.91 | 12 3.4 | WHL J154250.4+274953 |
| 176 | PSZ2 G045.96-26.94 | 20:50:01.00 | -01:35:24.30 | 1 | 0.20 | 0 | 0 | 0 | 17.25 | 10 3.1 | |
| 277 | PSZ2 G066.34+26.14 | 18:01:06.52 | +39:52:06.73 | 1 | 0.63 | 0 | 0 | 0 | 19.96 | 10 3.1 | WHL J180111.8+395138 |
| 279 | PSZ2 G066.59-58.51 | 23:07:11.30 | -07:31:43.15 | 1 | 0.36 | 0 | 0 | 0 | 18.88 | 7 2.6 | WHL J230711.3-073143 |
| 284 | PSZ2 G067.21-20.49 | 21:13:28.88 | +18:03:27.47 | 1 | 0.31 | 0 | 0 | 0 | 17.45 | 5 2.2 | WHL J211328.9+180327 |
| 293 | PSZ2 G069.35-15.58 | 21:02:41.68 | +22:43:13.63 | 1 | 0.09 | 0.094a | 0.0958a | 2a | 14.87 | 25 5 | |
| 294 | PSZ2 G069.39+68.05 | 14:21:38.35 | +38:21:17.78 | 2 | 0.71 | 0.762 | 0.762 | 1 | 21.23 | ClG-J142138.3+382118b | |
| 295 | PSZ2 G069.47-29.06 | 21:46:02.16 | +14:01:25.90 | 1 | 0.36 | 0 | 0 | 0 | 19.49 | 11 3.3 | |
| 330 | PSZ2 G077.67+30.59 | 17:46:50.85 | +50:31:11.88 | 1 | 0.23 | 0 | 0 | 0 | 18.07 | 6 2.4 | WHL J174650.9+503112 |
| 371 | PSZ2 G084.69-58.60 | 23:36:37.52 | -01:27:52.34 | 1 | 0.19 | 0.185 | 0 | 2 | 16.25 | 7 2.6 | WHL J233637.5-012752 |
| 381 | PSZ2 G086.28+74.76 | 13:37:53.87 | +38:54:06.82 | 1 | 0.8 | 0.699 | 0.6995 | 1 | 21.63 | ||
| 394 | PSZ2 G087.39-34.58 | 22:49:09.53 | +19:44:30.50 | 2 | 0.7 | 0.76 | -1 | 1 | - | ||
| 424 | PSZ2 G093.41-16.26 | 22:24:07.25 | +37:58:30.46 | 1 | 0.26 | 0 | 0 | 0 | 17.37 | 7 2.6 | WHL J222407.2+375831 |
| 432 | PSZ2 G094.31-11.31 | 22:12:58.51 | +42:35:02.26 | 1 | 0.24 | 0 | 0 | 0 | 16.62 | 13 3.6 | |
| 483 | PSZ2 G100.22+33.81 | 17:13:45.53 | +69:21:48.07 | 2 | 0.62 | 0 | -1 | 0 | - | ||
| 620 | PSZ2 G125.84-18.72 | 01:06:55.84 | +44:06:05.81 | 2 | 0.19 | 0 | -1 | 0 | - | 16 4 | WHL J010709.2+440918. |
| 624 | PSZ2 G126.36-19.11 | 01:09:19.54 | +43:37:40.78 | 1 | 0.22 | 0 | 0 | 0 | 16.37 | 10 3.1 | WHL J010919.5+433741 |
| 628 | PSZ2 G126.72-21.03 | 01:10:25.02 | +41:41:18.81 | 1 | 0.22 | 0 | 0 | 0 | 15.83 | 5 2.2 | WHL J011025.0+414119 |
| 644c | PSZ2 G130.64+37.16 | 10:47:45.54 | +77:59:56.67 | 1 | 0.44 | 0 | 0 | 0 | 19.98 | 6 2.4 | WHL J104745.5+775957 |
| 644c | PSZ2 G130.64+37.16 | 10:46:29.31 | +78:07:44.06 | 1 | 0.24 | 0 | 0 | 0 | 17.10 | 7 2.6 | WHL J104629.2+780744 |
| 646 | PSZ2 G131.15-14.72 | 01:38:42.22 | +47:22:35.27 | 2 | 0.24 | 0 | -1 | 0 | - | 31 5.5 | WHL J013846.1+472236. |
| 681 | PSZ2 G139.00+50.92 | 11:20:16.97 | +63:14:59.87 | 2 | 0.6 | 0 | -1 | 0 | - | ||
| 732 | PSZ2 G150.64-14.21 | 03:17:04.20 | +40:41:33.22 | 1 | 0.22 | 0 | 0 | 0 | 16.86 | 10 3.1 | WHL J031704.2+404133 |
| 810 | PSZ2 G171.08-80.38 | 01:21:53.35 | -20:33:26.69 | 1 | 0.33 | 0 | 0 | 0 | 17.36 | 6 2.4 | WHL J012153.4-203327 |
| 831 | PSZ2 G177.03+32.64 | 08:13:20.93 | +43:12:36.83 | 1 | 0.16 | 0.1428 | 0.143 | 6 | 16.85 | 20 4.4 | WHL J081320.9+431237 |
| 836 | PSZ2 G179.45-43.92 | 03:19:18.34 | +02:05:35.43 | 1 | 0.34 | 0 | 0 | 0 | 16.91 | 5 2.2 | WHL J031918.3+020535 |
| 863 | PSZ2 G186.50-13.45 | 05:11:52.85 | +16:13:36.29 | 1 | 0.25 | 0 | 0 | 0 | 16.6 | 9 3 | WHL J051152.9+161336 |
| 1049 | PSZ2 G231.41+77.48 | 12:00:26.54 | +22:34:19.55 | 1 | 0.35 | 0.346 | 0.3469 | 2 | 18.55 | 10 3.1 | WHL J120026.5+223420 |
| 1074 | PSZ2 G237.68+57.83 | 10:53:17.80 | +10:52:37.13 | 1 | 0.7 | 0 | -1 | 0 | - | ||
| 1244 | PSZ2 G269.02+46.30 | 11:19:07.43 | -10:22:57.81 | 2 | 0.12 | 0 | -1 | 0 | - | 8 2.8 | |
| 1254c | PSZ2 G270.78+36.83 | 11:04:06.99 | -19:13:47.88 | 1 | 0.22 | 0 | 0 | 0 | 16.88 | 12 3.4 | WHL J110407.0-191348 |
| 1254c | PSZ2 G270.78+36.83 | 11:04:21.03 | -19:14:18.12 | 1 | 0.52 | 0 | 0 | 0 | 19.59 | 18 4.2 | WHL 110417.9-191409 |
| 1255 | PSZ2 G270.88+37.23 | 11:05:04.58 | -18:56:38.66 | 1 | 0.23 | 0 | 0 | 0 | 16.62 | 15 3.8 | WHL J110504.6-185639 |
| 1262c | PSZ2 G271.53+36.41 | 11:05:25.72 | -19:54:19.84 | 1 | 0.48 | 0 | 0 | 0 | 17.84 | 5 2.2 | WHL J110525.7-195420 |
| 1262c | PSZ2 G271.53+36.41 | 11:05:19.71 | -19:59:15.61 | 2 | 0.50 | 0 | -1 | 0 | - | 6 2.4 | WHL J110519.6-195852 |
| 1465 | PSZ2 G310.81+83.91 | 12:55:18.02 | +21:02:31.22 | 1 | 0.44 | 0.429 | 0.4288 | 2 | 19.54 | 5 2.4 | PSZ1 G311.76+83.91 |
| 1548 | PSZ2 G328.96+71.97 | 13:23:27.81 | +10:46:43.71 | 2 | 0.09 | 0.092 | -1 | 10 | - | 10 3.1 |
a Spectroscopic redshift obtained from optical follow-up observations with the WHT telescope. No spectroscopic SDSS data available.
b additional analysis presented in Buddendiek et al. (2015)
c Multiple optical detection.
| ID | Planck Name | R. A. | Decl. | Cen. | Nspec | comments | ||||
|---|---|---|---|---|---|---|---|---|---|---|
| 126 | PSZ2 G036.36+16.01 | 17:59:42.69 | +10:07:43.70 | 1 | 0.13 | 0.128a | 0.1278a | 3a | 16.21 | |
| 327 | PSZ2 G076.55+60.29 | 14:52:00.51 | +44:31:21.31 | 2 | 0.29 | 0.287 | -1 | 4 | 0 | WHL J145206.4+443235 |
| 389 | PSZ2 G086.85-81.39 | 00:30:15.21 | -20:06:24.93 | 1 | 0.25 | 0 | 0 | 0 | 17.28 | WHL J003015.2-200625 |
| 421 | PSZ2 G092.69+59.92 | 14:26:08.53 | +51:14:14.15 | 2 | 0.50 | 0.461 | -1 | 3 | 0 | |
| 465 | PSZ2 G098.62+51.76 | 14:50:05.70 | +59:19:51.91 | 1 | 0.31 | 0.298 | 0.2985 | 1 | 18.16 | WHL J145005.7+591952 |
| 546 | PSZ2 G112.69+33.37 | 16:19:49.38 | +79:06:23.53 | 1 | 0.51 | 0 | 0 | 0 | 19.12 | WHL J161949.3+790624 |
| 667 | PSZ2 G136.02-47.15 | 01:28:23.61 | +14:41:13.60 | 1 | 0.50 | 0.465 | 0.4649 | 1 | 19.00 | WHL J012823.6+144114 |
| 673 | PSZ2 G137.24+53.93 | 11:40:59.55 | +61:07:07.04 | 1 | 0.48 | 0.473 | 0.4769 | 2 | 18.98 | WHL J114059.5+610707 |
| 690 | PSZ2 G141.98+69.31 | 12:12:40.63 | +46:21:23.07 | 1 | 0.70 | 0.714 | 0.7132 | 2 | 21.10 | WHL J121240.6+462123 |
| 714 | PSZ2 G146.16-48.92 | 01:52:40.99 | +11:14:30.90 | 2 | 0.49 | 0.491 | -1 | 9 | 0 | |
| 739 | PSZ2 G152.40+75.00 | 12:13:19.22 | +39:46:26.91 | 1 | 0.42 | 0.453 | 0.4513 | 6 | 19.16 | WHL J121319.2+394627 |
| 744 | PSZ2 G153.56+36.82 | 08:44:21.57 | +62:17:48.40 | 2 | 0.12 | 0.122 | -1 | 10 | - | |
| 812 | PSZ2 G171.48+16.17 | 06:37:43.56 | +43:48:59.12 | 1 | 0.28 | 0 | 0 | 0 | 17.15 | WHL J063743.6+434859 |
| 916 | PSZ2 G202.61-26.26 | 04:59:50.17 | -03:16:47.52 | 1 | 0.23 | 0 | 0 | 0 | 17.12 | WHL J045950.2-031647 |
| 917 | PSZ2 G202.66+66.98 | 11:07:30.89 | +28:51:01.10 | 1 | 0.48 | 0.483 | 0.4814 | 3 | 19.07 | WHL J110730.9+285101 |
| 920 | PSZ2 G203.32+08.91 | 07:05:56.53 | +12:30:33.66 | 1 | 0.27 | 0 | -1 | 0 | 0 | WHL J070556.5+123034 |
| 1510 | PSZ2 G320.94+83.69 | 13:00:05.73 | +21:01:28.26 | 1 | 0.45 | 0.462 | 0.4612 | 4 | 19.12 | WHL J130005.7+210128 |
a Spectroscopic redshift obtained from optical follow-up observations with the WHT telescope. No spectroscopic SDSS data available.
| ID | Planck Name | R. A. | Decl. | Nspec | |
|---|---|---|---|---|---|
| 52 | PSZ1 G020.8238.03 | 16:15.05.44 | 07:34:55.38 | 0.338 | 4 |
| 97 | PSZ1 G035.5534.15 | 16:50:35.73 | 16:49:31.27 | 0.348 | 3 |
| 142 | PSZ1 G046.9866.62 | 14:37:40.29 | 30:12:00.27 | 0.339 | 3 |
| 143 | PSZ1 G047.4437.39 | 16:50:20.40 | 26:58:21.42 | 0.232 | 1 |
| 257 | PSZ1 G078.3946.13 | 16:09:01.48 | 50:05:11.85 | 0.400 | 1 |
| 260 | PSZ1 G079.6545.60 | 16:10:54.67 | 51:13:35.91 | 0.392 | 2 |
| 299 | PSZ1 G087.3250.92 | 15:26:13.83 | 54:09:16.6 | 0.473 | 4 |
| 307 | PSZ1 G090.6333.50 | 17:27:46.53 | 61:30:27.82 | 0.312 | 1 |
| 312a | PSZ1 G091.8126.97 | 22:45:27.74 | 28:09:00.78 | 0.344 | 15 |
| 321 | PSZ1 G093.1543.20 | 16:05:15.53 | 61:04:42.54 | 0.384 | 3 |
| 357b | PSZ1 G099.8458.45 | 14:14:47.18 | 54:47:03.57 | 0.620 | 2 |
| 392 | PSZ1 G107.6739.80 | 00:01:17.36 | 21:31:22.04 | 0.411 | 18 |
| 404 | PSZ1 G110.0870.23 | 00:33:53.14 | 07:52:10.35 | 0.302 | 3 |
| 410 | PSZ1 G112.3832.88 | 00:10:51.39 | 29:09:40.15 | 0.332 | 19 |
| 418 | PSZ1 G114.3460.16 | 00:34:28.16 | 02:25:22.61 | 0.382 | 3 |
| 427 | PSZ1 G116.4844.47 | 00:32:08.22 | 18:06:25.28 | 0.374 | 11 |
| 441 | PSZ1 G120.1444.43 | 00:42:36.61 | 18:25:33.25 | 0.281 | 3 |
| 448 | PSZ1 G122.9835.52 | 00:51:38.60 | 27:19:59.89 | 0.358 | 6 |
| 461 | PSZ1 G126.0049.62 | 00:59:36.76 | 13:10:20.84 | 0.501 | 8 |
| 487 | PSZ1 G135.2465.43 | 12:19:12.20 | 50:54:35.04 | 0.552 | 7 |
| 505 | PSZ1 G140.4654.27 | 11:30:08.72 | 59:46:32.15 | 0.169 | 6 |
| 576 | PSZ1 G165.9450.48 | 10:01:38.77 | 50:00:53.59 | 0.172 | 2 |
| 579 | PSZ1 G166.6142.12 | 09:09:38.69 | 51:36:15.13 | 0.215 | 3 |
| 660 | PSZ1 G198.5046.01 | 09:30:51.19 | 28:47:00.26 | 0.296 | 7 |
| 696c | PSZ1 G212.5163.18 | 10:52:52.73 | 24:14:00.14 | 0.529 | 5 |
| 699 | PSZ1 G212.8046.65 | 09:44:42.87 | 19:27:59.64 | 0.367 | 1 |
| 701 | PSZ1 G213.2778.35 | 11:59:31.29 | 26:14:38.73 | 0.306 | 3 |
| 705d | PSZ1 G213.9568.28 | 11:14:41.68 | 24:34:50.65 | 0.101 | 10 |
| 705d | PSZ1 G213.9568.28 | 11:14:32.15 | 24:35:24.06 | 0.601 | 5 |
| 719 | PSZ1 G217.3558.14 | 10:34:39.66 | 20:32:04.52 | 0.476 | 2 |
| 743 | PSZ1 G223.8058.50 | 10:41:09.64 | 17:30:35.08 | 0.337 | 2 |
| 760 | PSZ1 G226.6528.43 | 08:56:20.59 | 01:46:49.38 | 0.724 | 1 |
| 795 | PSZ1 G236.8666.33 | 11:21:55.15 | 15:48:05.16 | 0.675 | 1 |
| 1093 | PSZ1 G311.7683.91 | 12:55:18.02 | 21:02:31.22 | 0.429 | 2 |
| 1159 | PSZ1 G332.3072.17 | 13:26:43.58 | 11:17:04.22 | 0.089 | 14 |
a centre of the main group. This system consists of two groups at 0.344 and 0.339
b centre of the main rich cluster. The second nearby cluster has of 0.579
c updated coordinates (centre of concentration)
d double detection