Gaussian Process Uncertainty in Age Estimation as a Measure of Brain Abnormality
Abstract
Multivariate regression models for age estimation are a powerful tool for assessing abnormal brain morphology associated to neuropathology. Age prediction models are built on cohorts of healthy subjects and are built to reflect normal aging patterns. The application of these multivariate models to diseased subjects usually results in high prediction errors, under the hypothesis that neuropathology presents a similar degenerative pattern as that of accelerated aging. In this work, we propose an alternative to the idea that pathology follows a similar trajectory than normal aging. Instead, we propose the use of metrics which measure deviations from the mean aging trajectory. We propose to measure these deviations using two different metrics: uncertainty in a Gaussian process regression model and a newly proposed age weighted uncertainty measure. Consequently, our approach assumes that pathologic brain patterns are different to those of normal aging. We present results for subjects with autism, mild cognitive impairment and Alzheimer’s disease to highlight the versatility of the approach to different diseases and age ranges. We evaluate volume, thickness, and VBM features for quantifying brain morphology. Our evaluations are performed on a large number of images obtained from a variety of publicly available neuroimaging databases. Across all features, our uncertainty based measurements yield a better separation between diseased subjects and healthy individuals than the prediction error. Finally, we illustrate differences in the disease pattern to normal aging, supporting the application of uncertainty as a measure of neuropathology.
keywords:
Age estimation , Uncertainty , Alzheimer’s Disease , Autism1 Introduction
The brain is a complex organ whose morphology varies substantially across the population. The causes of morphological variation have not yet been fully understood, but several studies have reported on potential causal factors including age (Guttmann et al., 1998; Franke et al., 2010; Ziegler et al., 2012; Wachinger et al., 2015), sex (Ingalhalikar et al., 2014), pathologies like dementia (Gaser et al., 2013; Wachinger et al., 2016), and even environmental factors such as education and physical activity (Steffener et al., 2016). Among all these variables, age was shown to be the main factor determining brain morphology (Potvin et al., 2017). Due to the wide impact of aging on brain morphology, multivariate regression methods using features based on brain morphology can in turn be used to estimate a subject’s age. A recent volume of work has focused on modeling the normal aging of healthy individuals to predict a subject’s age. Obtaining a prediction of the age with imaging features was shown to be useful to derive imaging biomarkers, which can potentially be used to predict brain anomaly caused by disease (Cole and Franke, 2017).
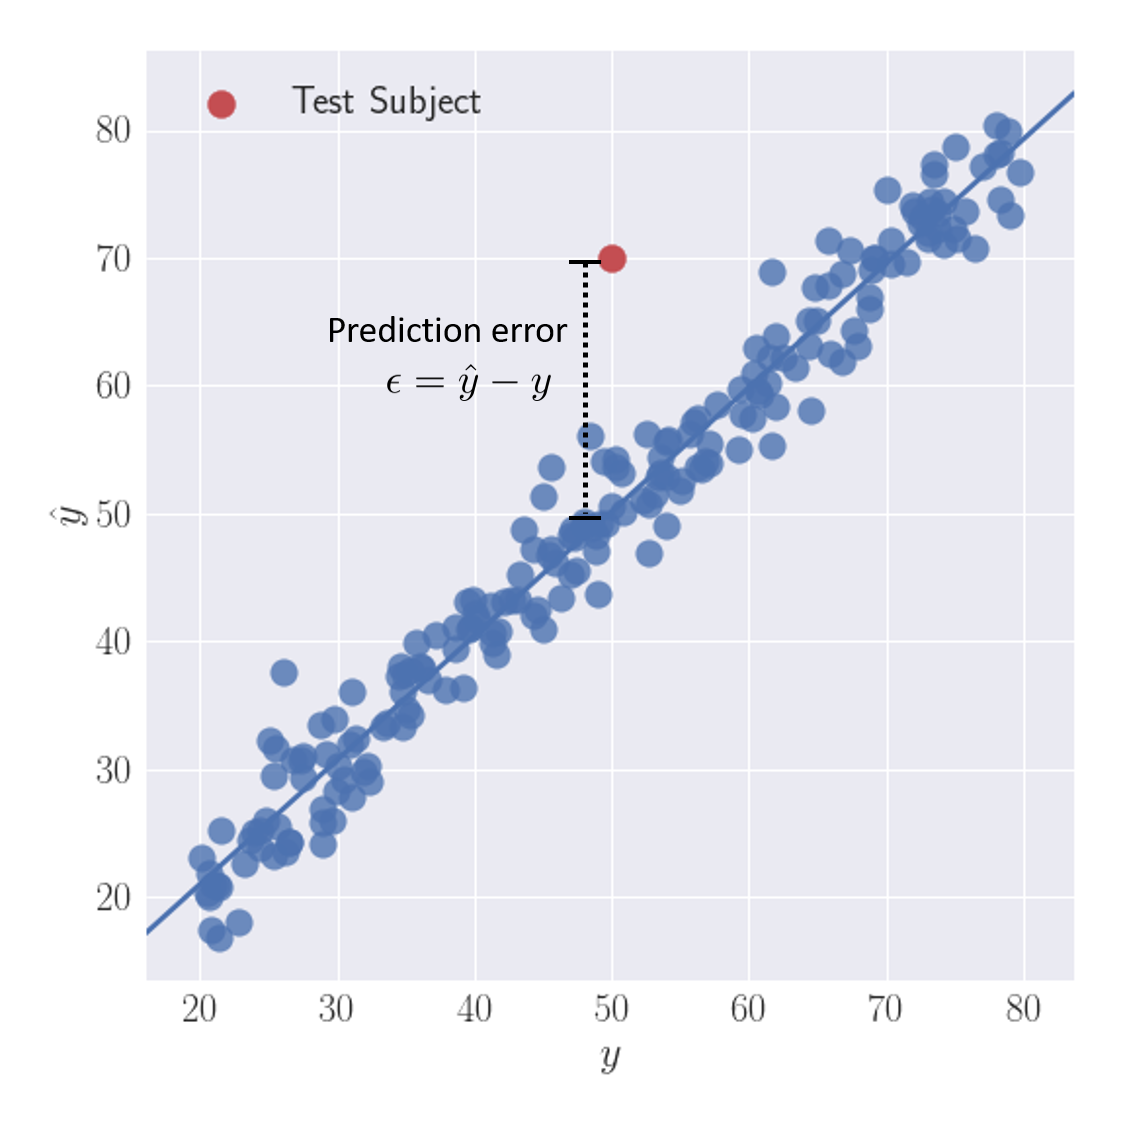
The task of predicting age from brain images has been formulated as multivariate regression, where a predictive model is trained to relate structural information obtained from brain MR images to the chronological age of healthy subjects (Gaser et al., 2013; Wang et al., 2014; Kondo et al., 2015; Valizadeh et al., 2017; Liem et al., 2017). The prediction from these models is interpreted as an estimate of a subject’s biological age, in contrast to a subject’s chronological age. Of particular interest is the prediction error, which is defined as the difference between the biological and chronological age (figure 1). When predicting the age of healthy subjects, the prediction error is assumed to be small, while the prediction on subjects with neuropathology is assumed to result in large positive prediction errors. The error could therefore serve as a personalized marker of pathological processes (Franke et al., 2010; Gaser et al., 2013). The main assumption behind using the prediction error as a measure of pathology is that changes caused by neuropathology are equivalent to an accelerated aging process. Following this hypothesis, Gaser et al. (2013) and Habes et al. (2016) showed that changes related to Alzheimer’s disease (AD) resemble accelerated aging, since differences between biological and chronological age are larger for individuals with AD than for healthy controls. Similar results on age differences have also been reported for individuals diagnosed with schizophrenia (Nenadic et al., 2017) and depression (Koutsouleris et al., 2013). In these studies, the age prediction model is trained using only images from healthy individuals. This means that contrary to their discriminative counterparts, a single age prediction model can be used to assess differences between healthy controls and individuals diagnosed with different conditions.
Although the findings of these studies show the big potential of using models of healthy aging to assess brain abnormality, a potentially limiting factor when quantifying neuropathology through the difference between chronological and predicted age, is the assumption that morphological changes caused by disease follow an accelerated aging process. The assumption that brain anomaly is equivalent to accelerated aging may hold true for specific brain regions that accommodate neural systems with high susceptibility to deleterious factors, which are therefore affected by aging and disease processes. However, the assumption of accelerated aging does likely not extend to the whole brain, given that differences in brain morphology are caused by a variety of neurobiological processes that are complex and non-linear (Fjell et al., 2014; Buckner, 2004; Hedden and Gabrieli, 2004). This is potentially problematic, as current approaches for predicting the brain age are based on multivariate regression models that operate on gray matter maps or morphological features across the entire brain.
In this work, we build on the idea of modeling neuropathology as deviations from the healthy development of the brain. Our main hypothesis is that disease and aging result in brain-wide patterns of change. These patterns are not independent from each other and are essentially similar for several brain regions where disease results in patterns resembling accelerated aging. However, these accelerated aging patterns do not extend to the whole brain, making the assessment of deviations from healthy aging solely through prediction error problematic. We propose instead the use of Gaussian process regression (GPR). GPR can measure how a new subject deviates from previous observations used to construct the model by means of the posterior prediction uncertainty. Different to prediction error, GPR uncertainty is able to measure deviations from the healthy aging model without the implicit assumption of a brain-wide accelerated aging pattern. Particularly for the task of age prediction, we introduce a variation to traditional Gaussian processes regression that takes the known chronological age into account. This modification yields a weighted uncertainty measure. We evaluate our new method on a large collection of images obtained from several public datasets for assessing the variation to normal aging in mild cognitive impairment, Alzheimer’s disease, and autism. Our results support the use of Gaussian process uncertainty and the age weighted uncertainty as tools to measure neuropathological patterns that deviate from healthy aging. Similar to previous age prediction models, our evaluations are done with a single age prediction model which is trained only on healthy controls, showing its versatility across different age ranges and diseases.
2 Materials and Methods
2.1 Method overview
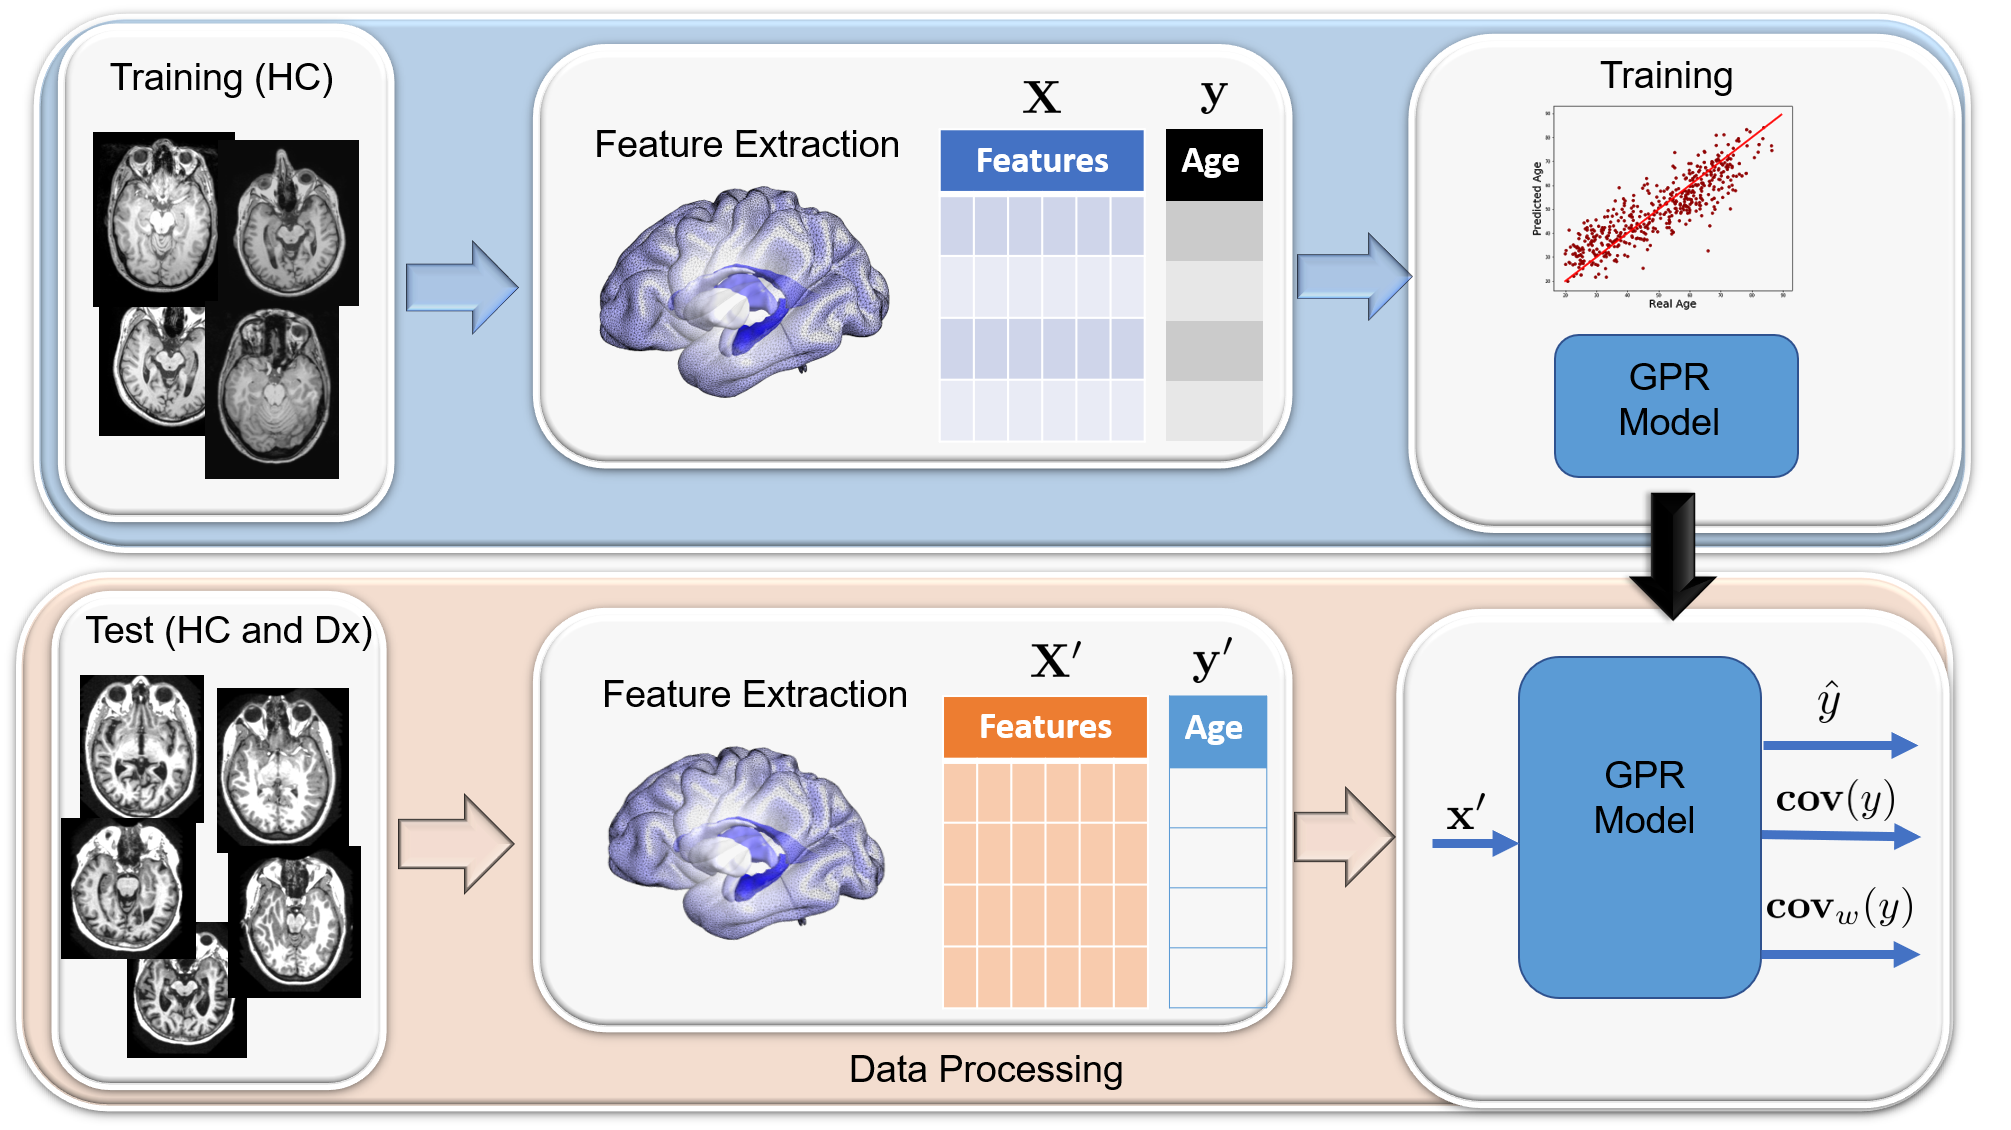
In this section, we describe our method for assessing neuropathology based on GPR uncertainty. Figure 2 presents an overview of our method, which consists of two stages. In the training stage (top section of figure 2), we build a GPR model that estimates the chronological age of healthy subjects. This model is built using a dataset of MRI scans of healthy controls (section 2.2). Images are processed and segmented to extract a set of features describing brain morphology (section 2.3). Finally, a GPR model mapping the extracted features to a predicted age is trained on these features (section 2.4).
In the testing stage (bottom section of figure 2), we use the GPR model trained on healthy subjects to quantify deviations from the normal aging pattern on previously unseen subjects. In this stage, morphological features are extracted from the MR images of the test subjects, and these features are then used to obtain an estimate of the age of the subject using the GPR model. From the GPR model, we obtain the estimated age , an uncertainty measure of the estimation , and a weighted uncertainty measure (see section 2.4.1 for details on these measurements). We will show in our experiments (section 3) that these measurements based on the uncertainty of the GPR model can be used to assess the similarity between subjects in the testing set and the healthy population in the training set.
2.2 Data
Similar to previous work on age prediction, we train an age regression model based on T1-MR images of healthy individuals. The training images for our age regression model are extracted from three different databases: IXI 111http://brain-development.org/ixi-dataset/, ABIDE (Di Martino et al., 2014), and AIBL (Ellis et al., 2009). Details for each training dataset are shown in table 1. We perform evaluation on 3 different test datasets summarized in table 2. The training and testing groups are therefore extracted from different databases and are independent from each other. For the first and second groups, obtained from the OASIS (Marcus et al., 2007) and ADNI (Jack et al., 2008) datasets, we aim at finding differences between Healthy Controls (HC), individuals diagnosed with Mild Cognitive Impairment (MCI), and subjects diagnosed with Alzheimer’s disease (AD). For the third dataset, ABIDE II, we look for differences between HC and individuals diagnosed with autism. In total, 1,543 images were used for training and 4,819 images for testing.
| Training Dataset | No. Images | Female/Male | Age (Min-Max) | Age Quantiles |
|---|---|---|---|---|
| IXI | 581 | 311/270 | 19-87 | 33.7 - 48.6 - 62.2 |
| ABIDE I | 573 | 99/474 | 6-64 | 14.6 - 17.0 - 20.1 |
| AIBL | 409 | 209/200 | 55-92 | 67.0 - 73.0 - 79.0 |
| Testing Dataset | No. Images | Female/Male | Age (Min-Max) | Age Quantiles | Target Dx |
|---|---|---|---|---|---|
| ADNI | 3591 | 1422/2169 | 54-90 | 71.2 - 75.1 -79.7 | MCI - AD |
| OASIS | 196 | 129/67 | 60-82 | 71.0 - 76.0 - 82.0 | MCI - AD |
| ABIDE II | 1032 | 247/785 | 5-64 | 9.5 - 11.4 - 15.2 | Autism |
2.3 Feature Extraction
As mentioned in the overview section of our method, we require to extract features from structural MR images to quantify the brain morphology. Several image based features have previously been used for the age estimation task: Good et al. (2001), Franke et al. (2010) and Gaser et al. (2013) used Voxel Based Morphometry (VBM) features, which identify differences on the composition of brain tissue by registering all structural images to the same space. After segmenting gray and white matter, the voxel values of the gray matter extracted images are used as features. Finally the dimensionality of the feature space is reduced using Principal Component Analysis (PCA) and keeping only the principal modes of variation. Valizadeh et al. (2017) and Wang et al. (2014) use volumetric, thickness and curvature measurements of the brain, derived from the brain segmentation with FreeSurfer (Fischl, 2012). These different sets of features have been presented in separate studies but, to the best of our knowledge, have not yet been directly compared on the same age estimation task. In summary, we use three different types of features in our approach:
-
1.
VBM features (50 Principal Components),
-
2.
Thickness of 70 cortical structures.
-
3.
Volume of 50 brain structures.
Additionally we build a prediction model combining VBM, thickness and volume features together. VBM features were extracted using the CAT12 toolbox 222http://www.neuro.uni-jena.de/cat/ together with the SPM12 toolbox 333http://www.fil.ion.ucl.ac.uk/spm/ for segmentation. The preprocessing of the images, the segmentation of gray matter, and post processing were implemented in line with the pipeline proposed by Franke et al. (2010). Dimensionality reduction was performed using the PCA library included in the scikit-learn toolbox (Pedregosa et al., 2011). The principal component directions were estimated using only the training sample, and the testing data was projected to this estimated lower dimensional space. For all the analyses on thickness and volume features, FreeSurfer version 5.3 was used. The default Deskian/Killiany atlas was used for the parcellation to obtain thickness measurements. We are using all subcortical volume measurements as provided by FreeSurfer and described in the FreeSurfer subcortical segmentation pipeline.
2.4 Uncertainty Estimation with Gaussian Process Regression
Several multivariate regression techniques have been previously used for the task of age prediction from brain MR images. A detailed comparison of the performance of neural networks, random forests, k-nearest neighbors, support vector machines, multiple linear regression and ridge regression was presented by (Valizadeh et al., 2017). In the work by Franke et al. (2010) relevance vector regression was preferred.
In our case, we are interested in modeling the age regression problem with a model that does not only provide estimates of the biological age, but also provides uncertainties of these estimates. Gaussian process regression achieves a comparable accuracy in age regression than standard regression techniques, while offering the advantage of providing an estimate of the uncertainty of each prediction. GPR models have been used successfully before as age prediction models (Cole et al., 2015, 2016), but the potential of using uncertainty based measurements as biomarkers has not been explored yet. In this section, we will briefly introduce GPR models, focusing particularly on the calculation of uncertainty, where we refer the reader to (Rasmussen and Williams, 2005) for a more detailed explanation, and introduce our modification for computing an age-weighted uncertainty.
2.4.1 Gaussian Process
A Gaussian process is defined as a collection of random variables, any finite number of which have a joint Gaussian distribution (Rasmussen and Williams, 2005) with:
-
1.
a mean function ,
-
2.
and a covariance function .
Although not necessary, it is often assumed that the mean function of the GPR is zero. Therefore the design of a GPR is focused on the selection of an appropriate covariance function measuring the similarity between data points. This covariance function is equivalent to a similarity measure between two data points, giving small values for points that are close to each other and large values otherwise. In our case we define the covariance function as a squared exponential function of the form:
| (1) |
where is the noise variance, is the length scale of the -th feature, and is the Kronecker delta function. We can think of the length scale vector as a parameter controlling how close should two data points and should be in order to influence each other. In general, the smaller an element is, the more dependent is to the feature element .
We model the joint distribution of the training and test outputs as:
| (2) |
The elements of the joint distribution in Eq.(2) can be summarized as follows:
-
1.
an intra-covariance matrix of the training set ,
-
2.
an intra-covariance matrix of the testing set ,
-
3.
an inter-covariance matrix between the training and testing set ,
-
4.
a training labels vector , and
-
5.
a testing labels vector ,
where corresponds to the number of training samples and to the number of testing samples. The matrices have the form:
| (3) |
where each element corresponds to a measure of the similarity between two feature vectors and . We are interested in predicting the values for the test labels , which have the following conditional distribution:
| (4) |
Using this conditional distribution we can derive the predictive equations of a GPR:
| (5) |
| (6) |
which correspond to the predicted labels and to the estimated covariance, respectively. The estimated covariance can also be thought as a measure of uncertainty for the predicted values. This uncertainty estimate is usually used in the GPR framework to measure the degree of confidence of a predicted value by measuring the similarity of a new observation with respect to the previous observations in the training set.
When training a GPR model, the parameters have to be tuned in order to fit the training data. This is done by maximizing the marginal likelihood of the model given by:
| (7) |
By finding the parameters that maximize the marginal likelihood, we can obtain a GPR model that best fits the training data.
2.4.2 Age-Weighted Uncertainty
The uncertainty measurement of the GPR is solely defined with respect to the feature vectors . In a common regression scenario this is a natural approach since the real values of the labels are unknown. However, in the case of an age estimation framework, we do possess the real values of the labels, which correspond to the chronological age of the patient.
We can introduce the age information into the GPR framework by creating age-weighted similarity matrices . Similar to the GPR covariance matrices we can construct three different similarity matrices:
-
1.
a weighted intra-similarity matrix for the training samples ,
-
2.
a weighted intra-similarity matrix for the testing samples , and
-
3.
a weighted inter-similarity matrix between the training and test samples .
These similarity matrices are constructed in the same manner as the covariance matrices presented in section 2.4.1. The only difference consists in a modification of the kernel to take into account differences in age. This is achieved by creating an age weighted similarity kernel of the form:
| (8) |
where corresponds to the kernel defined in Eq.(1) and corresponds to an age similarity term defined as:
| (9) |
where corresponds to the age length scale, which is a parameter controlling the effect of the age weighting. By using this updated kernel , we obtain a weighted uncertainty term which takes into account the age of the subjects to define similarities between subjects. This weighted uncertainty is obtained similar to the regular uncertainty presented in Eq. (6):
| (10) |
2.5 Prediction Error, Uncertainty and Age-Weighted Uncertainty
In this work, we compare three age regression based metrics in order to measure their usefulness as a biomarker to distinguish between healthy controls and subjects with different neuropathologies. These metrics are the commonly used prediction error (Franke et al., 2010), the GPR uncertainty , and the GPR age-weighted uncertainty . As discussed in the introduction, the prediction error has previously been used to assess differences between healthy and non-healthy populations. The prediction error is the difference between the predicted and chronological age, as shown in figure 1. A higher prediction error is assumed to indicate an accelerated aging process (Franke et al., 2010; Gaser et al., 2013).
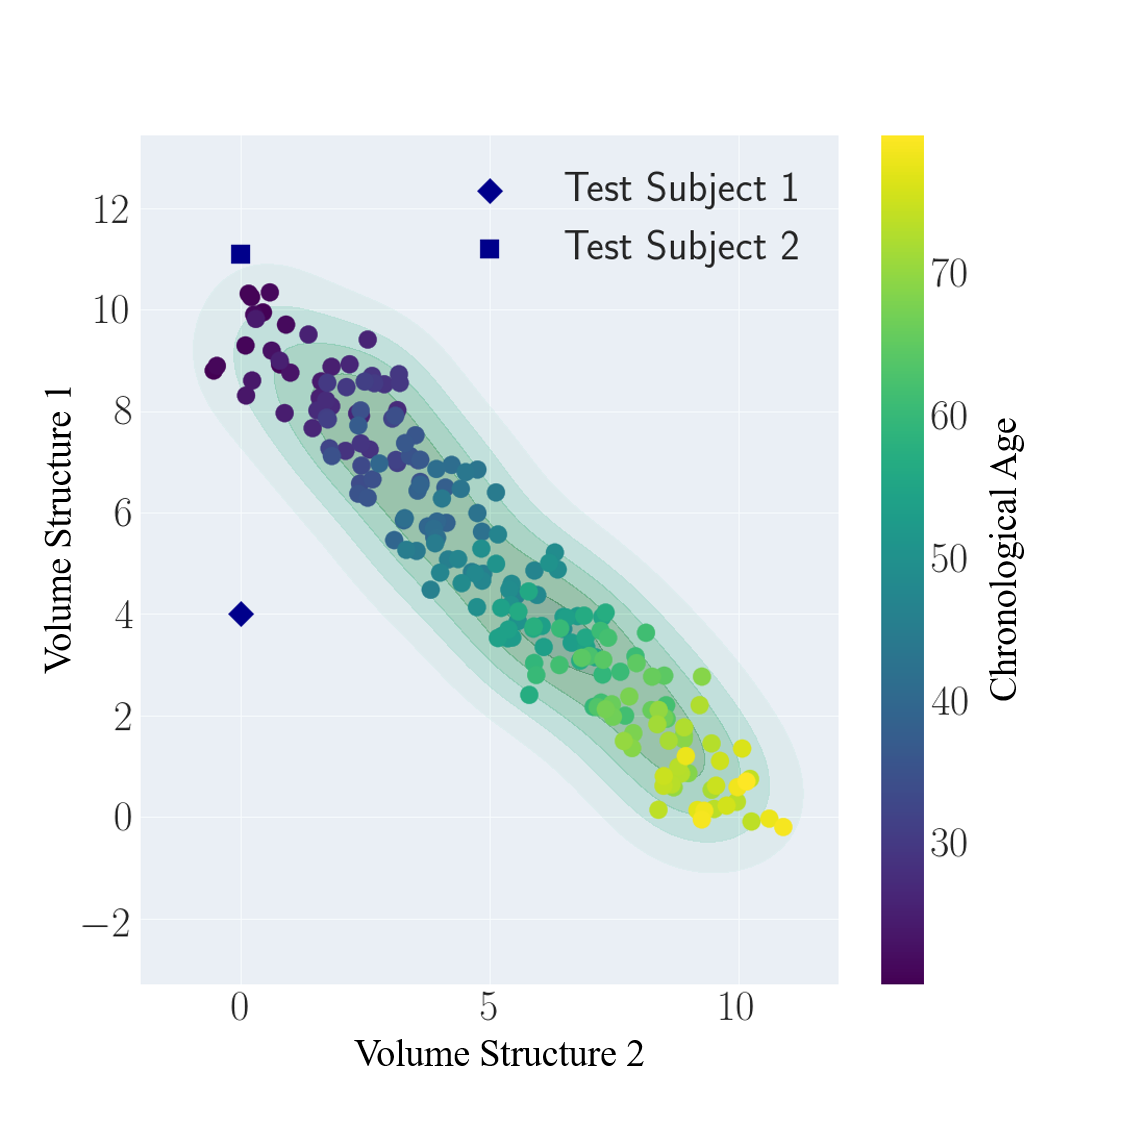
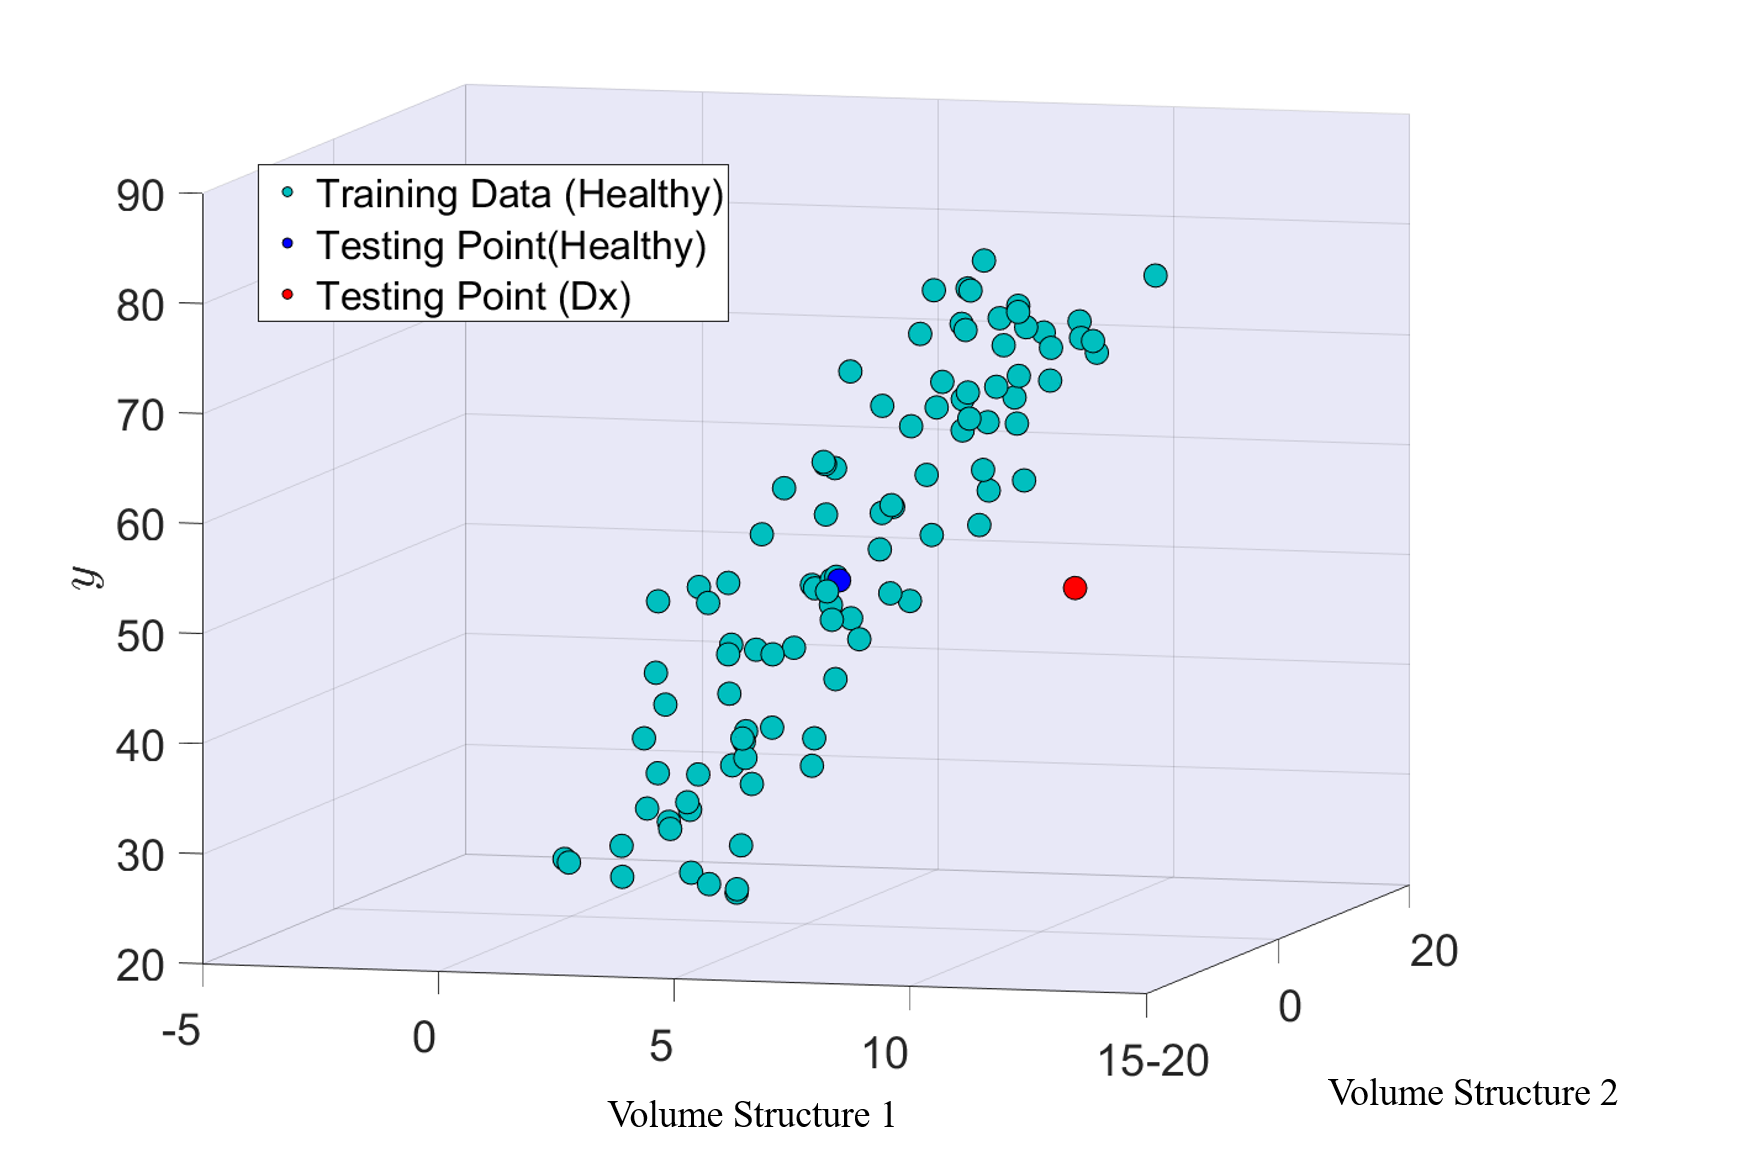
The computation of the GPR uncertainty was presented in section 2.4.1. It can be thought of as a metric on how close a testing point is to all the training points in the feature space, illustrated in figure 1. The scatter plot represents a set of subjects in a 2-dimensional space composed of the volume of two different structures. By training a GPR on a set of training points (represented by circles), we obtain a measure of uncertainty for every point in the 2D-space. This covariance matrix is represented by the shading of the grid, where darker regions correspond to regions where the predictor has higher confidence on its prediction. When performing prediction on previously unseen points (Test Subject 1 and Test Subject 2), we can obtain both a predicted age and its confidence . In figure 1, we observe that even though both test subjects get similar predicted values, the confidence of the prediction for subject two is higher due to its proximity to the training set.
The third metric, the age-weighted uncertainty expands upon the notion of uncertainty by taking into account the subject’s age. Measuring is equivalent to adding a further dimension to the distance measured by the normal GPR uncertainty. The reasoning behind this is to give higher similarity to individuals which have similar morphological features to healthy individuals of similar ages. For example, we see in figure 1 that a healthy testing point (blue) is close to training points with similar features and age; the testing point would therefore have a high value. On the other hand, the Testing Point corresponding to a diseased subject (red point) would have a low value because even though there are individuals in the training set with similar feature values, they correspond to subjects with a different age range. Both proposed metrics are closely related. In fact, is equivalent to for the special case when .
2.6 Aging and Disease Assessment
As discussed in the introduction, several studies have demonstrated that aging is a complex process, which affects different brain structures and regions at different rates of change. It has also been reported that deleterious changes caused by neurodegenerative disease follow a pattern that resembles an accelerated aging process. In order to evaluate how aging and neurodegenerative disease affect different brain regions, we performed an analysis of the volumetric features obtained from our training set. To facilitate this analysis we restricted our analysis to images obtained from the ADNI database. To assess which individual structures are affected either by aging, disease or both factors, a series of simple linear fixed effects model were fitted to our data. In each one of these models, the dependent variable corresponds to the volume of a different brain structure, and the independent variables correspond to age, sex, diagnosis (0 = healthy, 1 = MCI/AD) and an interaction term between diagnosis and age.
3 Results
3.1 Assessing the Effect of Aging and Disease on Brain Development
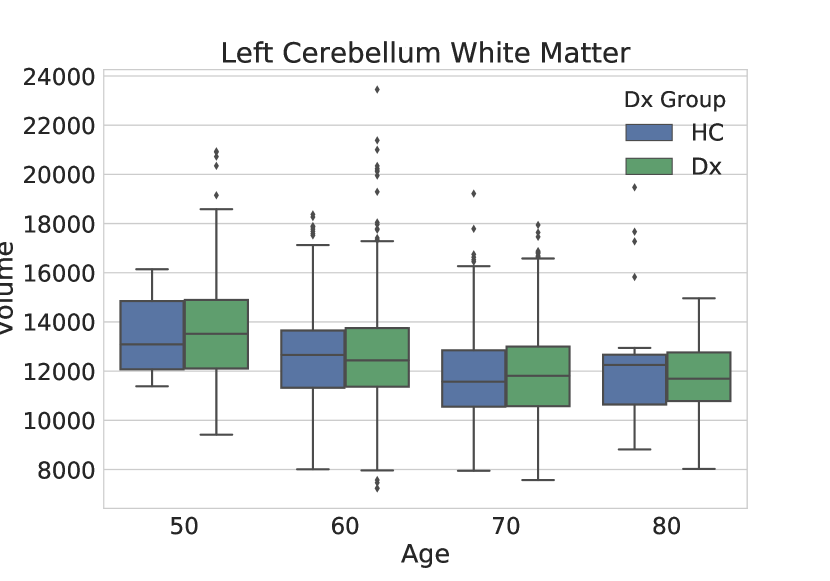
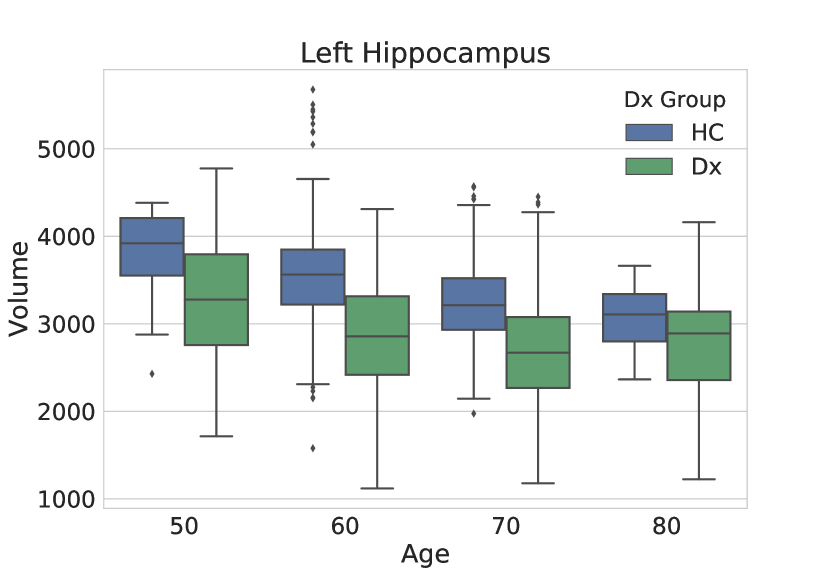
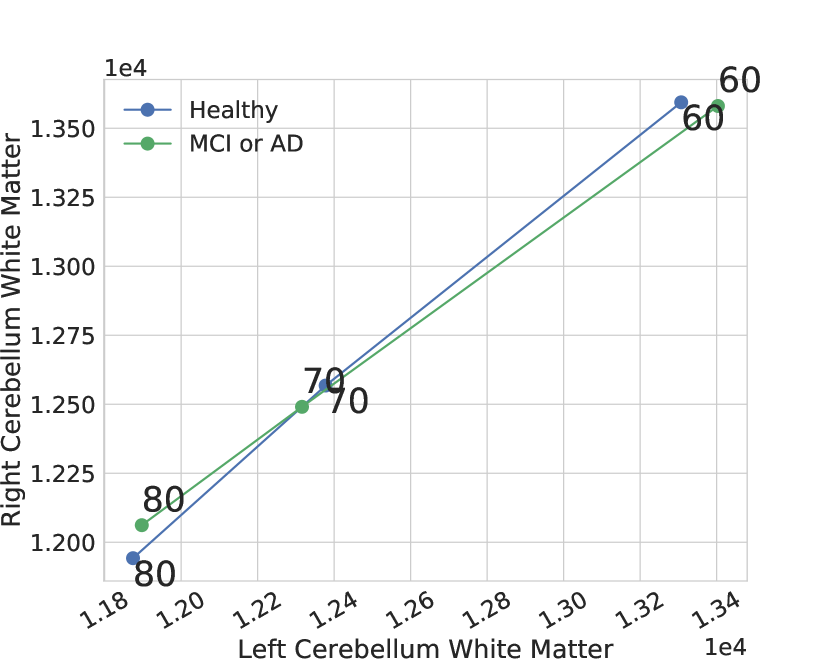
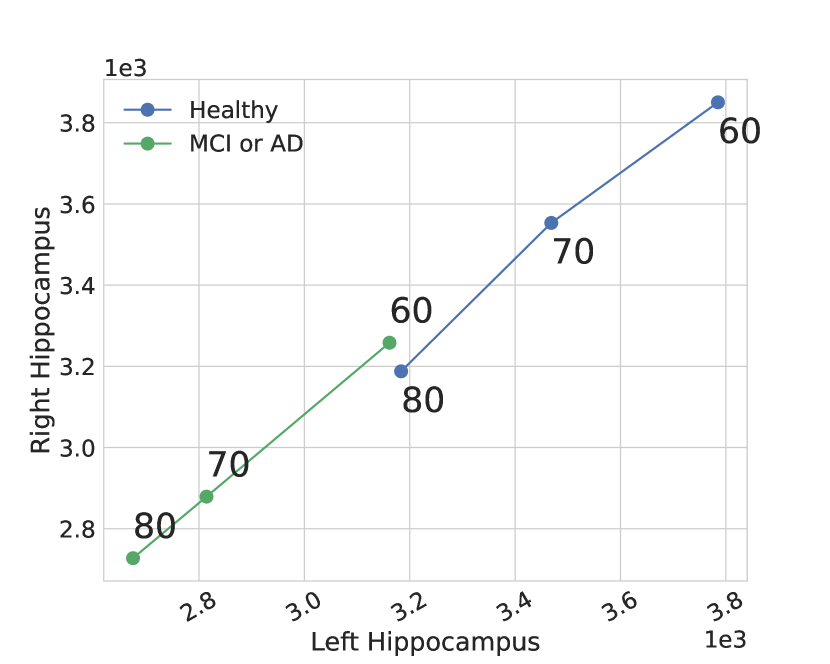
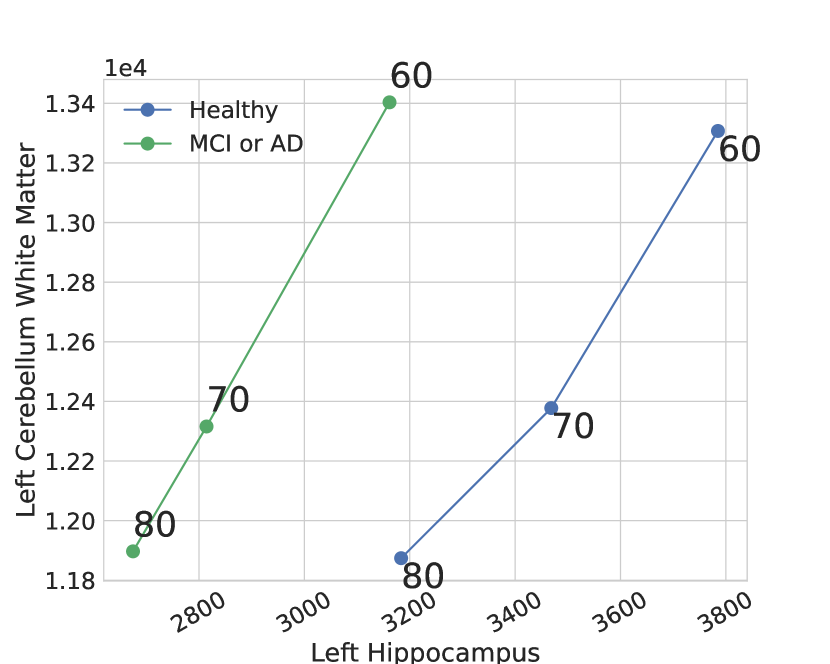
In this section we present the results obtained after fitting the aging and disease model described in section 2.6. In table 3, we present the regression coefficients for age, diagnosis and the age/diagnosis interaction term as well as their corresponding p-values for the linear fixed effects model. The table is sorted by descending p-value for the diagnostic coefficient, which means that the structures at the top of the table are those which present more significant volume alterations caused by disease. Age and volume variables were normalized in order to make the coefficients of different structures comparable. In the case of bilateral structures we only show the values for the left hemisphere in order to simplify our analysis. Plots showing the progress of the hippocampus and cerebellum white matter across different ages for both healthy and individuals with MCI/AD are also presented to illustrate our results in figure 3. The hippocampus was selected since it was the structure which had the most evident effects of age and disease. On the other hand, the cerebellum white matter was selected as a structure which showed significant effects of aging but is apparently not largely affected by Alzheimer’s disease.
There are a couple of relevant observations that can be extracted from table 3. First, the regression coefficients for age and diagnosis always have the same sign for structures with significant associations, and there exist significant interactions between aging and diagnosis for most of the analyzed structures. This supports the hypothesis that disease and aging are overlapping processes that affect the brain structures in the same direction. However, we can also observe in table 3 that there exist some structures that although largely affected by aging do not present significant disease effects (i.e. cerebellum white matter). This can also be observed on the box plots in the top of figure 3, where a clear difference between the HC and Dx groups is evident for all age ranges in the case of the hippocampus, whereas for the cerebellum white matter no significant differences exist between both groups.
To further illustrate the point that aging and disease are processes that affect different regions of the brain at different rates, we show the progress of pairs of features for both the HC and Dx groups (bottom of figure 3). By looking at the central plot, where the volume of left and right hippocampus is shown, we can understand the reasoning behind the accelerated aging hypothesis of previous age estimation works. Indeed, by looking only at these features, we would be tempted to conclude that the brain of a healthy 80 year old is essentially similar to that of a diseased 60 year old. However, this observation contrasts with the left plot, where the left and right cerebellum white matter volumes are shown. By looking at these features alone, we would draw a different conclusion, since it would appear that there are no differences between the brains of healthy and diseased subjects of the same age. By looking at the left hippocampus and left cerebellum white matter simultaneously (right in figure 3), we can observe that disease produce changes in the brain that are essentially different to those of accelerated aging, causing the overall appearance of the brain of an average 60 year old diagnosed with AD to be different to a healthy individual of any age. These observations support our hypothesis that morphological changes associated to AD and MCI are complex and that a model of accelerated aging across the whole brain may be too simplistic to model the specific effects of disease and aging at specific brain structures.
| Structure | Age Coefficient | Dx Coefficient | Age Dx Coefficient | Age p-value | Dx p-value | Age Dx p-value |
|---|---|---|---|---|---|---|
| Left.Hippocampus | -0.30 | -0.53 | 0.03 | |||
| Left.Amygdala | -0.21 | -0.41 | 0.07 | |||
| Left.Inf.Lat.Vent | 0.27 | 0.38 | -0.07 | |||
| Left.Lateral.Ventricle | 0.22 | 0.24 | -0.09 | |||
| CSF | 0.16 | 0.22 | -0.11 | |||
| Left.Accumbens.area | -0.30 | -0.22 | 0.07 | |||
| 3rd.Ventricle | 0.27 | 0.19 | -0.13 | |||
| Left.choroid.plexus | 0.14 | 0.17 | -0.04 | |||
| Left.Putamen | -0.15 | -0.14 | 0.02 | |||
| Left.VentralDC | -0.27 | -0.11 | -0.03 | |||
| Left.Thalamus.Proper | -0.32 | -0.11 | -0.01 | |||
| Left.Cerebellum.Cortex | -0.26 | -0.07 | -0.03 | |||
| Brain.Stem | -0.23 | -0.06 | -0.02 | |||
| Left.Caudate | 0.07 | 0.04 | 0.03 | |||
| Left.Cerebellum.White.Matter | -0.30 | -0.03 | 0.00 | |||
| Left.Pallidum | -0.06 | -0.02 | -0.04 | |||
| 4th.Ventricle | 0.09 | 0.00 | -0.08 | |||
| Left.vessel | 0.12 | 0.00 | -0.02 |
3.2 Training of the Age Prediction Model
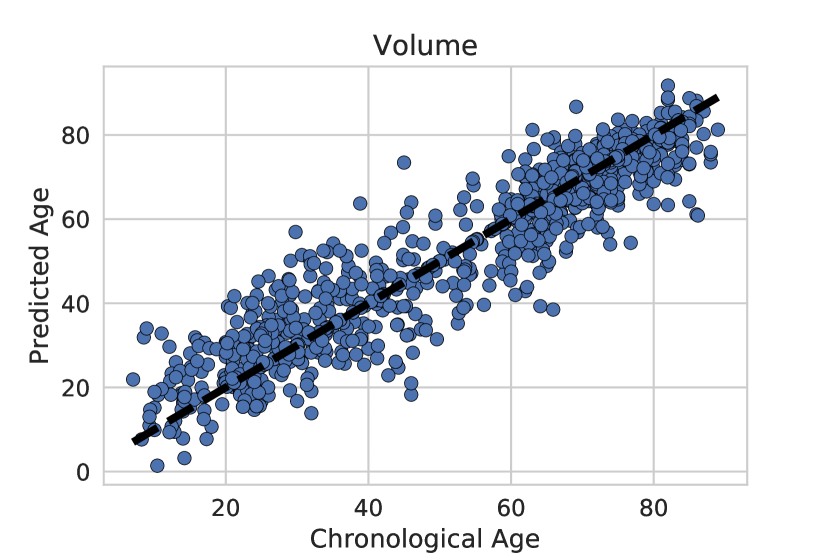
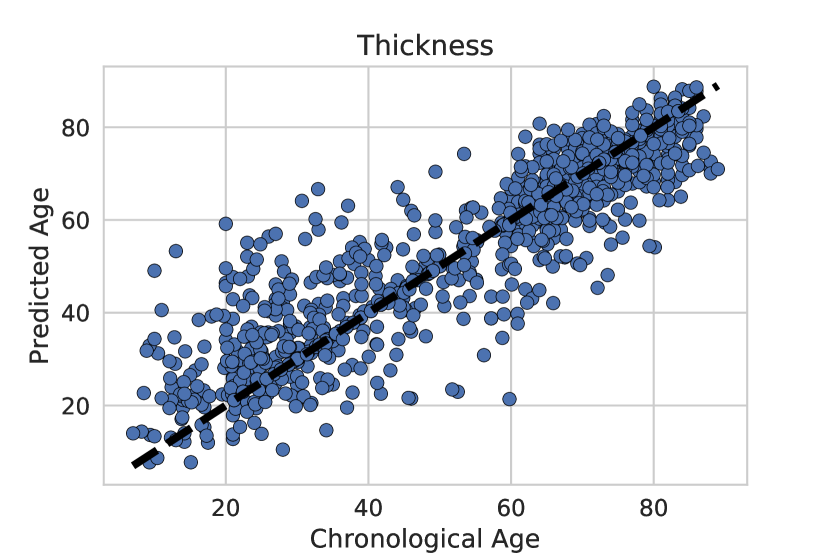
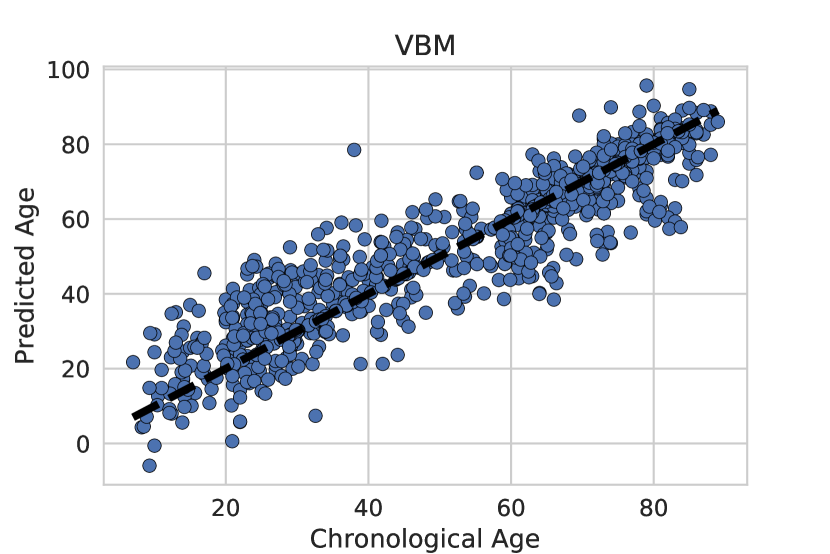
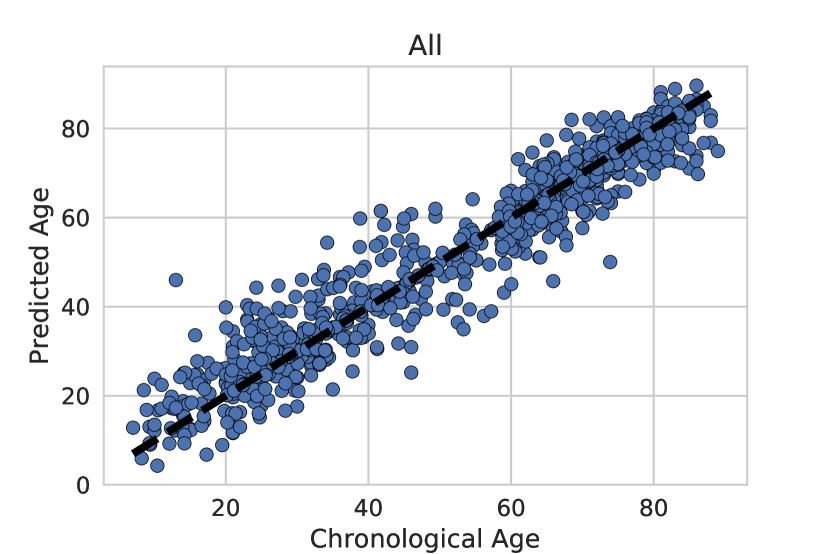
Using the training datasets summarized in table 1, we train 4 different GPR models, each one with a different set of features as described in section 2.3. Each one of the GPR models is trained to estimate the age of healthy subjects based on either volume, thickness, VBM features or a combination of all features. Our models were implemented using python together with the scikit-learn toolbox. In table 4, we show the Mean Absolute Error (MAE) and score for the training set, using a 5-fold cross validation. Our model presents similar MAE and when compared to previous work on age estimation (Valizadeh et al., 2017; Cole et al., 2016). Similar to previously reported results (Valizadeh et al., 2017), we observed higher score and lower MAE for the model trained using an ensemble of all available features. The chronological and predicted age for each subject in the training set are presented in the scatter plots in figure 4.
| Feature Set | MAE | |
|---|---|---|
| Volume | 5.52 | 0.87 |
| Thickness | 6.50 | 0.80 |
| VBM | 5.65 | 0.86 |
| All | 3.86 | 0.93 |
3.3 Evaluation of Gassian Process Uncertainty as a Measure of Brain Abnormality
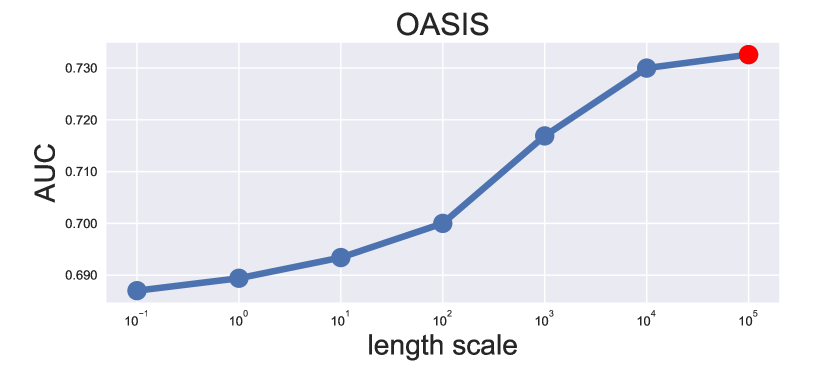
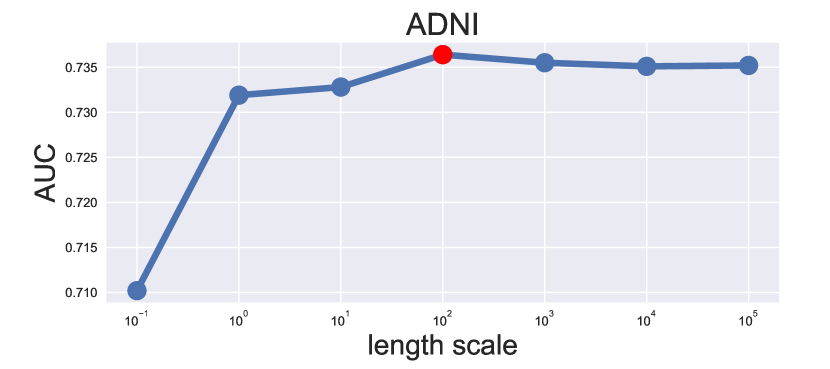
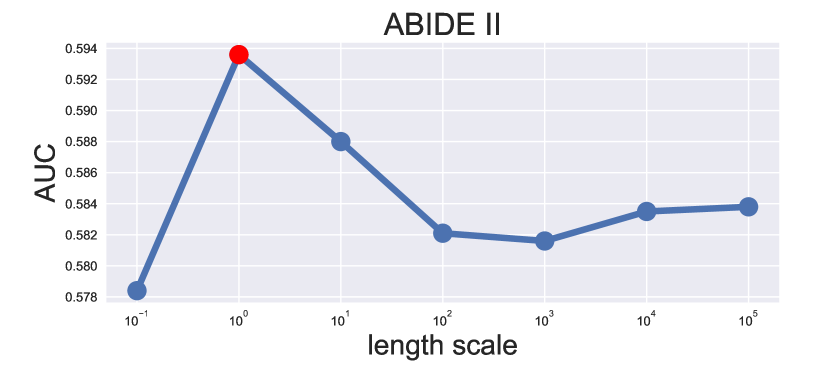
In this section, we present results of our experiments comparing the use of prediction error , uncertainty and age-weighted uncertainty as a biomarker for differentiating between healthy controls and patients with MCI, AD or autism. We performed three different experiments: the first two experiments are targeted at finding differences between HC, MCI and AD groups in both the ADNI and OASIS databases; the third experiment is performed on the ABIDE II database where differences between autism and healthy groups are evaluated. Note that as summarized in tables 1 and 2, the datasets used for testing are different to those used for training. For all experiments we assessed differences between groups both by performing non-parametric Wilcoxon rank-sum tests (Mann and Whitney, 1947) and by measuring the classification performance in a per subject basis by generating Receiver Operating Characteristic (ROC) curves with their corresponding Area Under the Curve (AUC) values. For all experiments, results are shown for four different sets of features: volume, thickness and VBM, as well as for the combination of all three feature sets. Our proposed GPR uncertainty based metrics are compared to the prediction error , obtained in a similar fashion as previous work on age estimation (Franke et al., 2010). An appropriate age length scale parameter for the metric was set independently for each experiment by performing evaluations at different scales an keeping the best performing results (See figure 5).
| HC-MCI | MCI-AD | |||||
|---|---|---|---|---|---|---|
| Volume | ||||||
| Thickness | ||||||
| VBM | ||||||
| All | ||||||
| HC-MCI | MCI-AD | |||||
|---|---|---|---|---|---|---|
| Volume | 0.67 | 0.71 | 0.72 | 0.73 | 0.76 | 0.77 |
| Thickness | 0.66 | 0.71 | 0.71 | 0.69 | 0.80 | 0.80 |
| VBM | 0.60 | 0.71 | 0.72 | 0.64 | 0.77 | 0.77 |
| All | 0.59 | 0.74 | 0.74 | 0.64 | 0.81 | 0.81 |
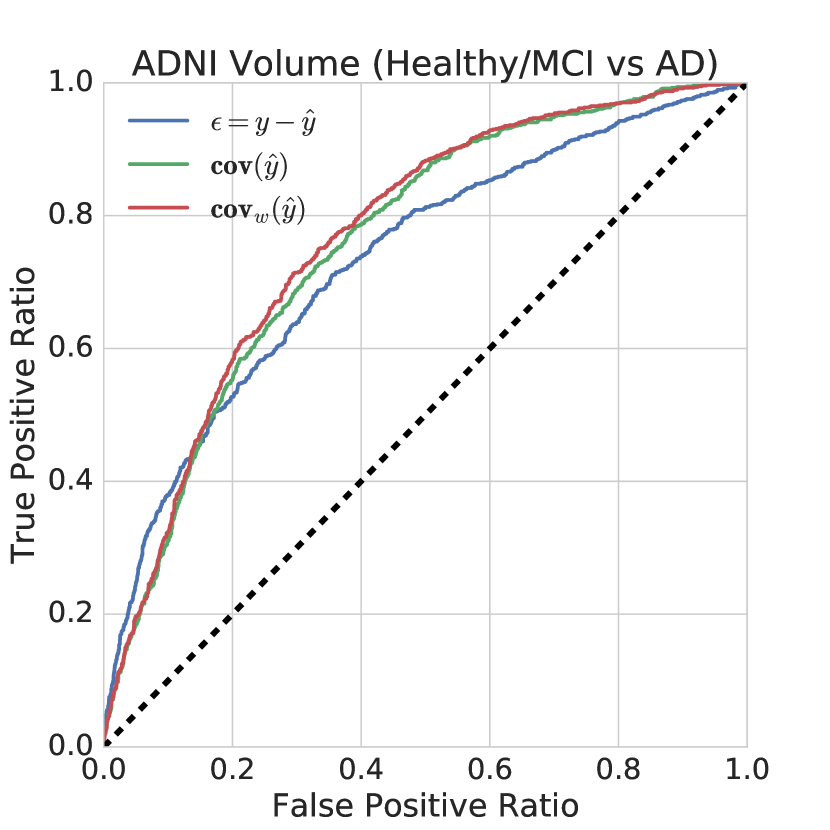
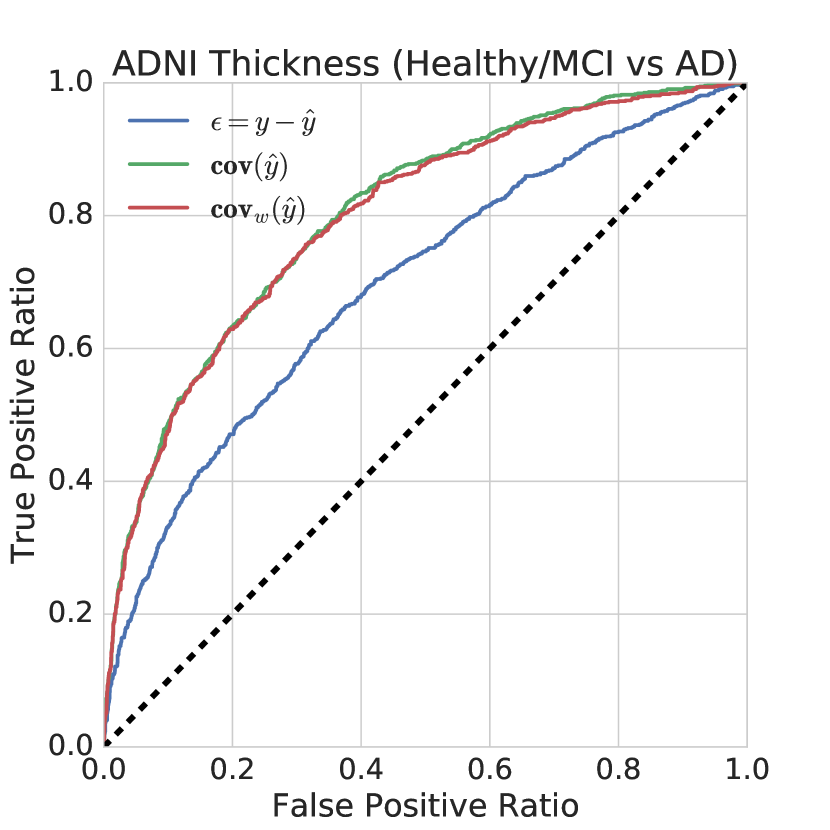
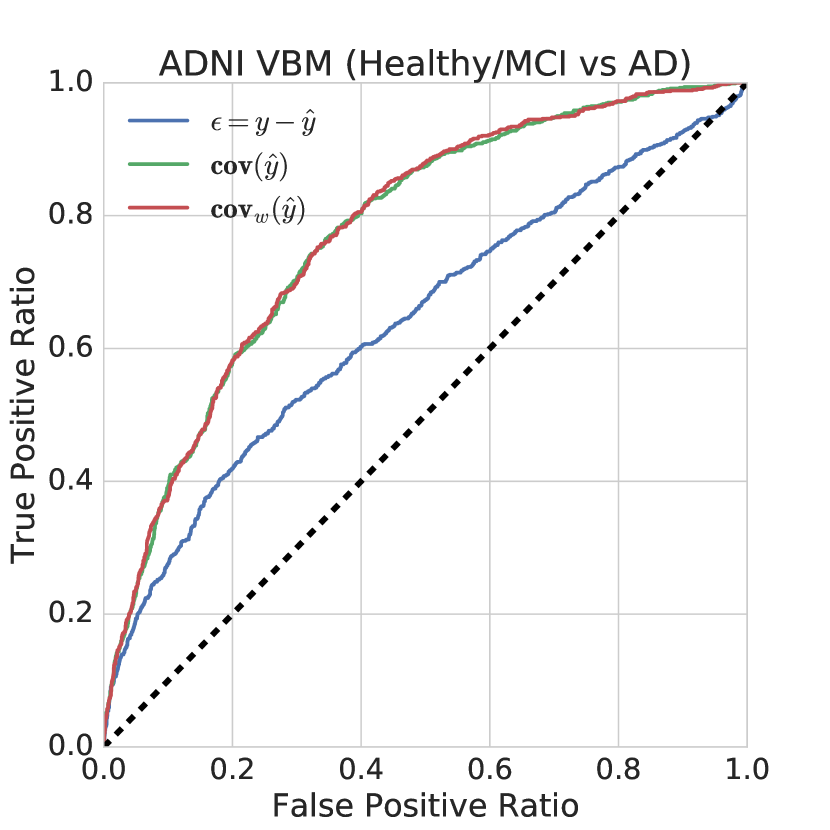
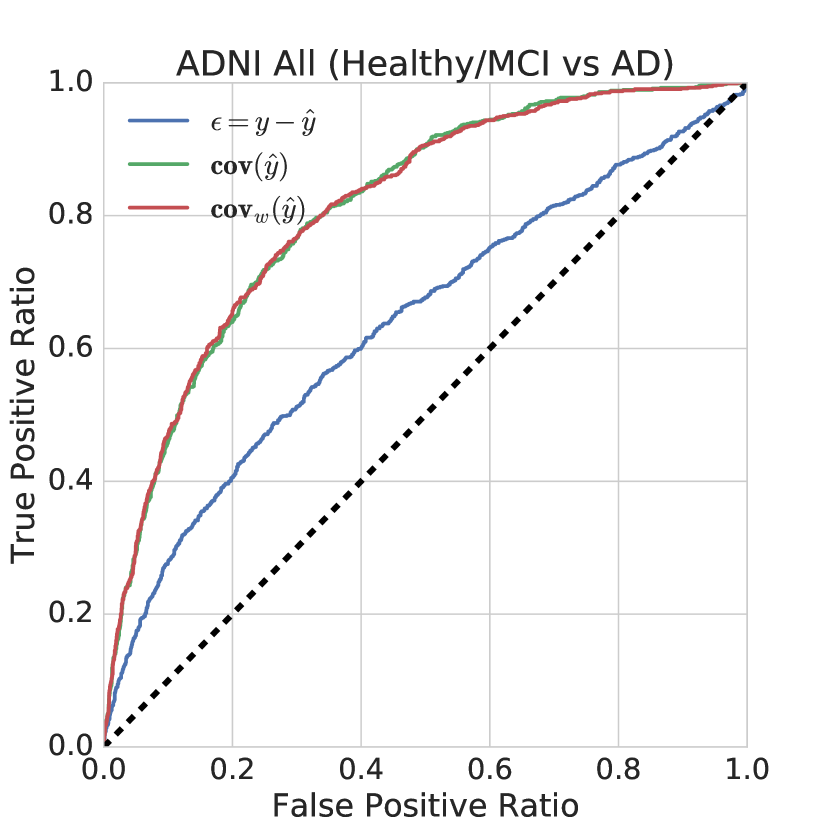
3.3.1 Experiment 1: ADNI Dataset
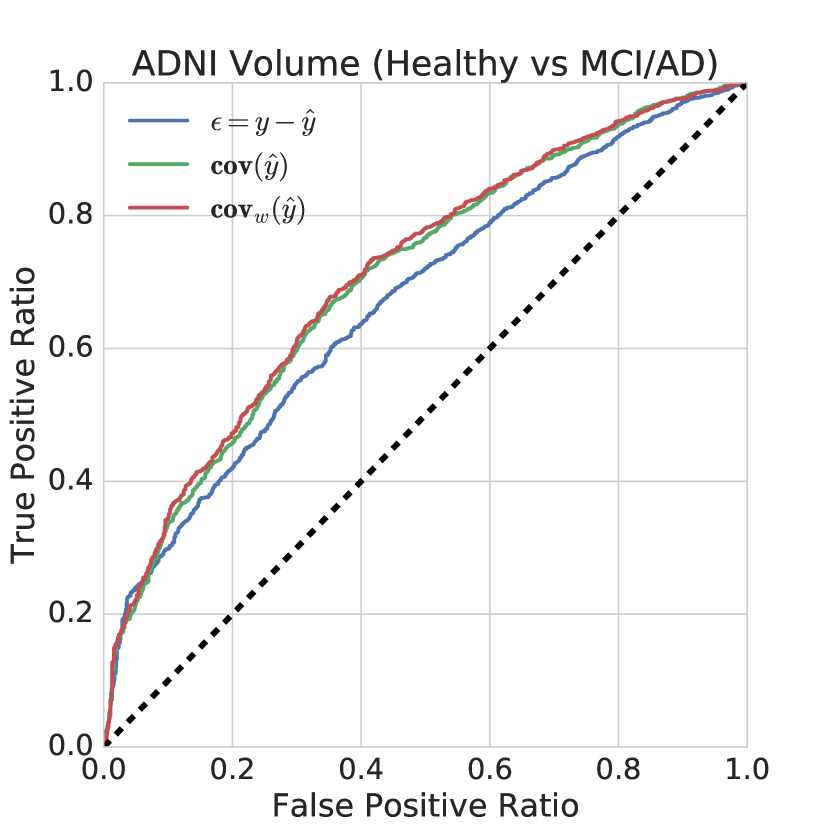
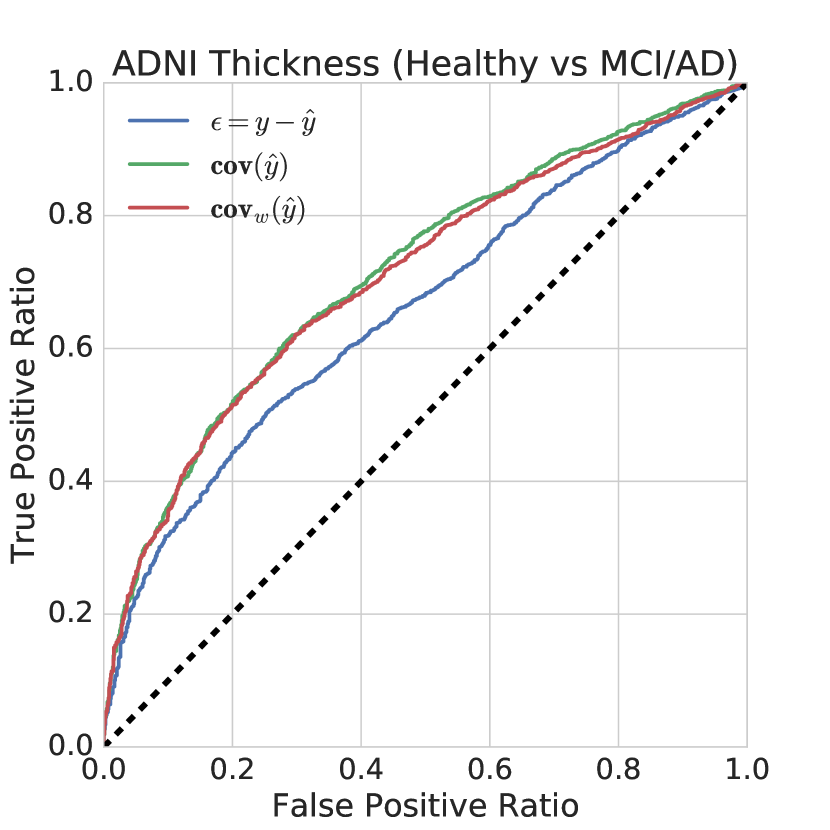
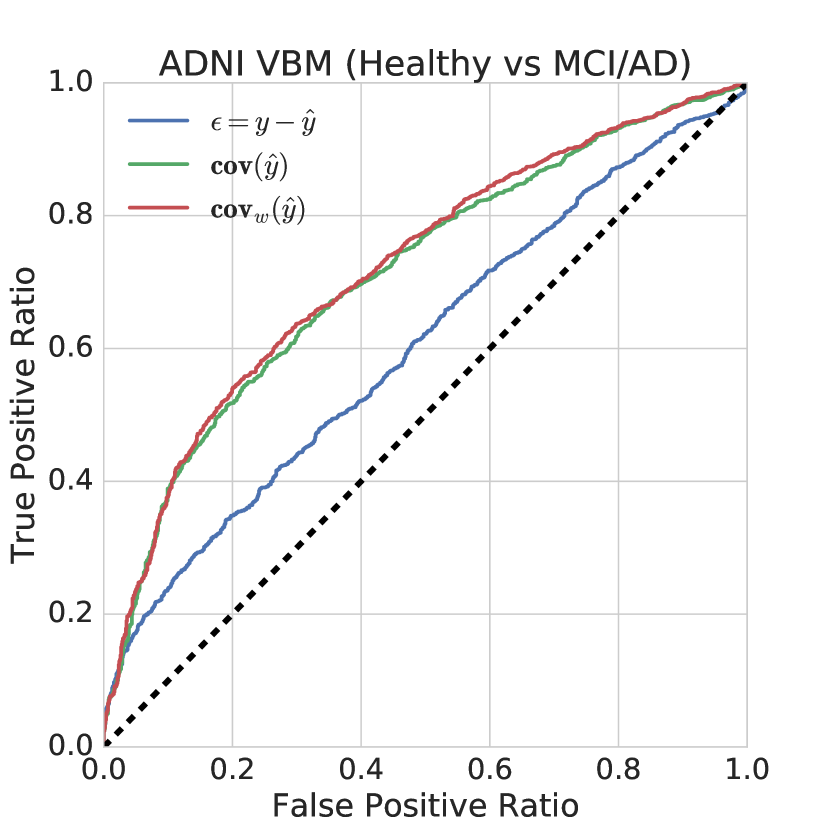
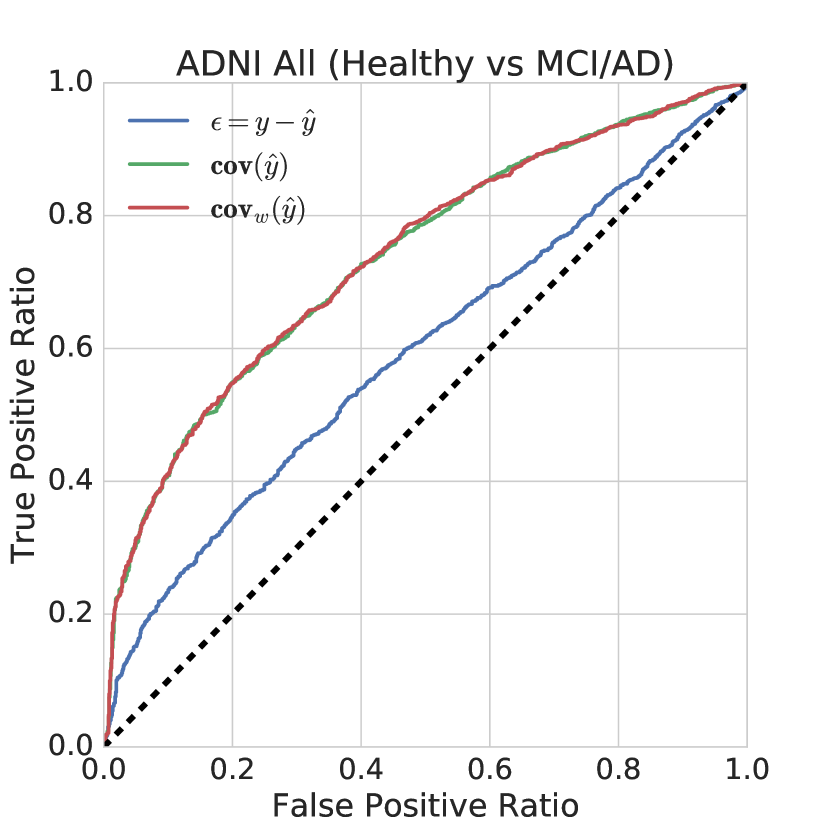
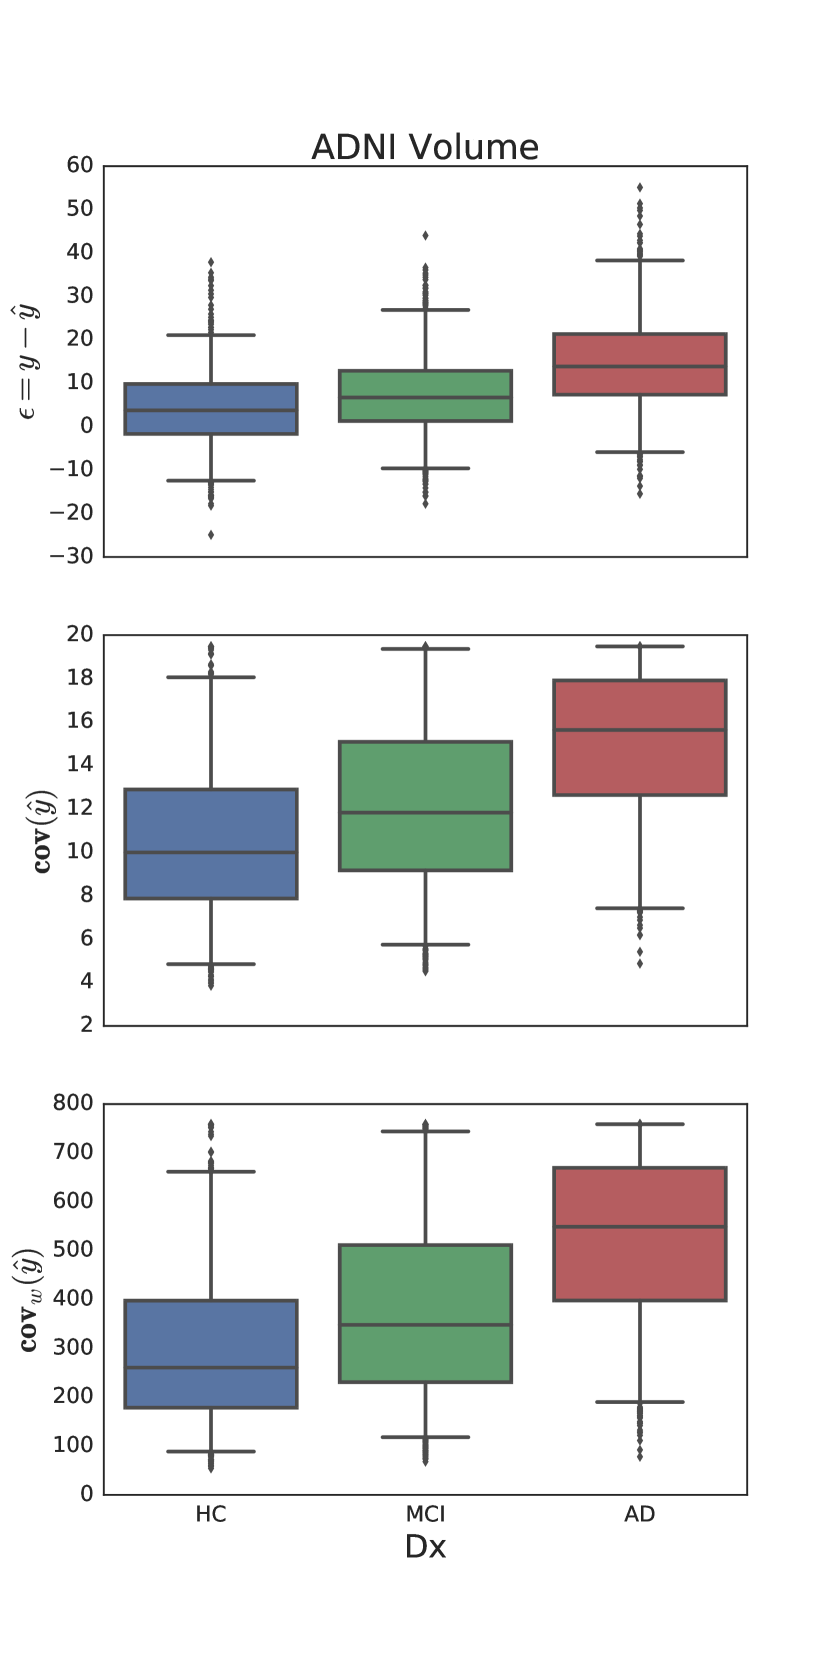
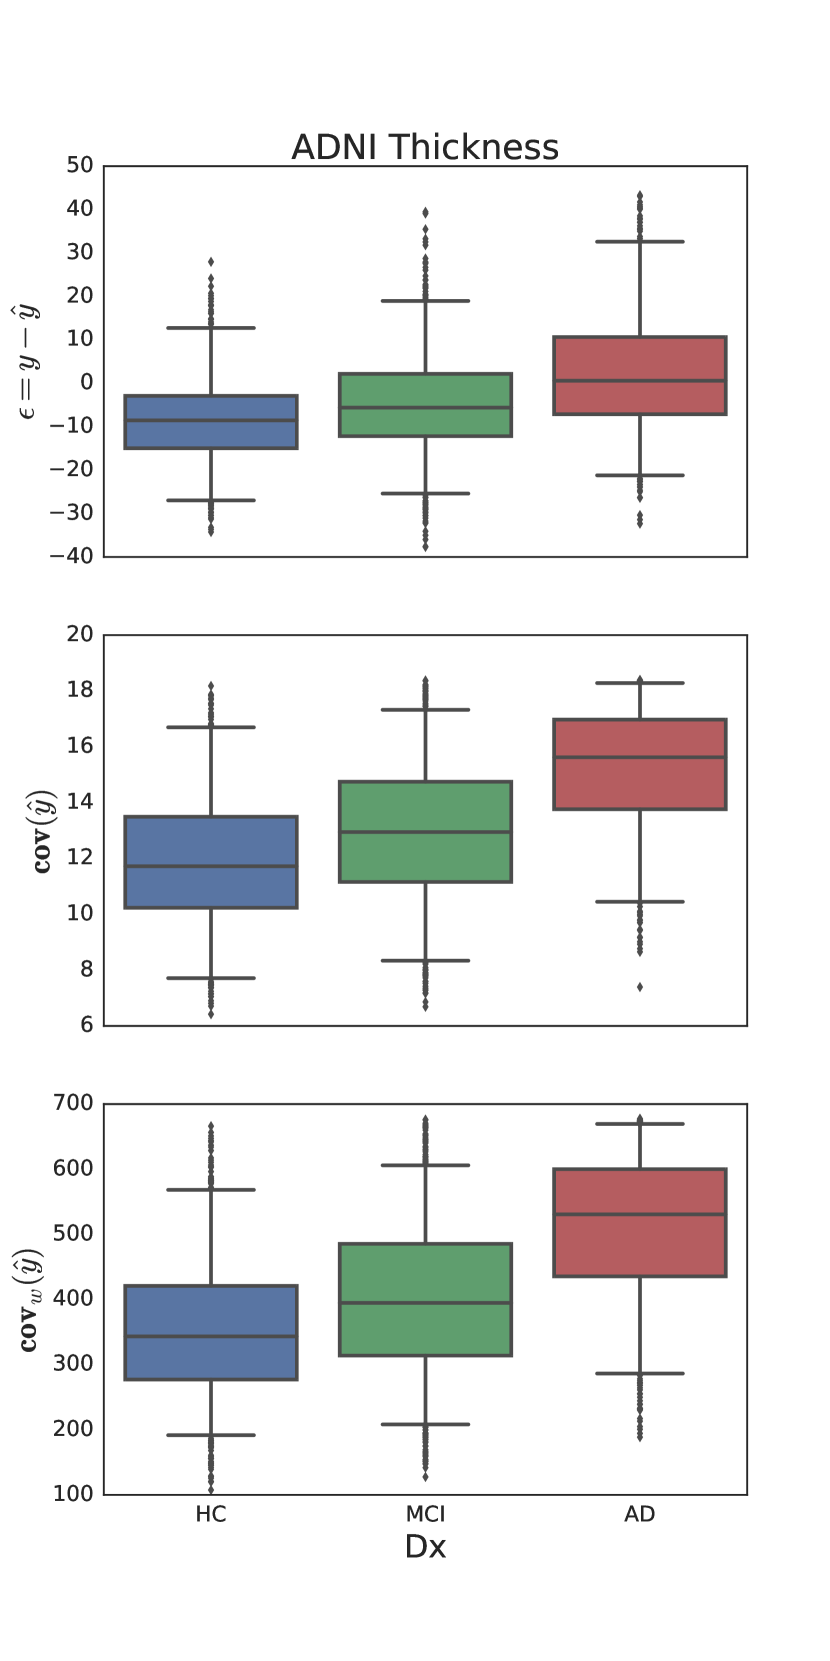
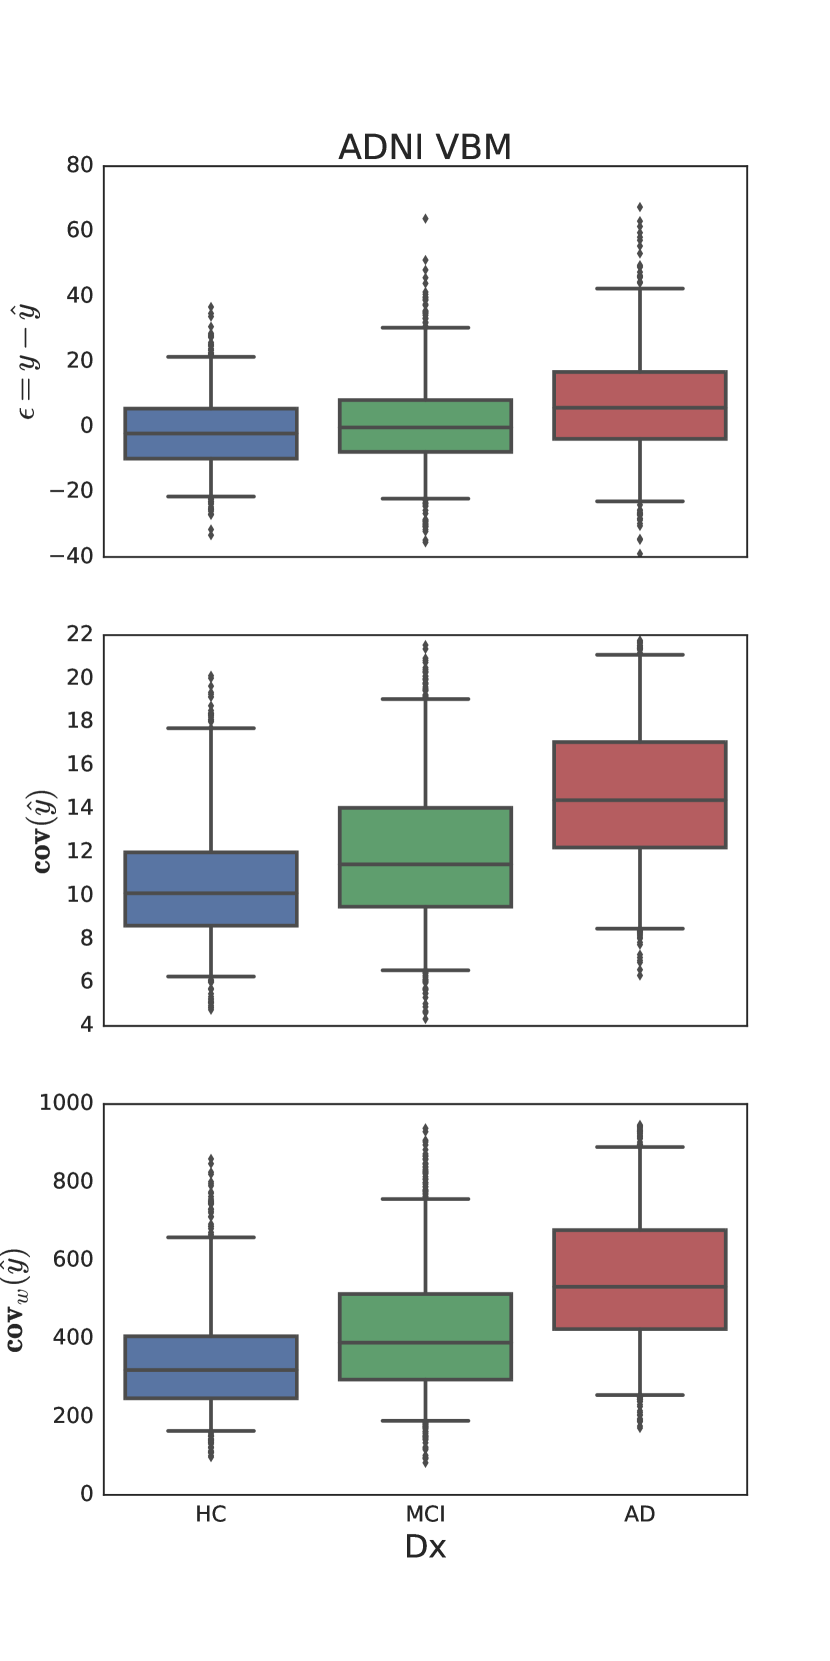
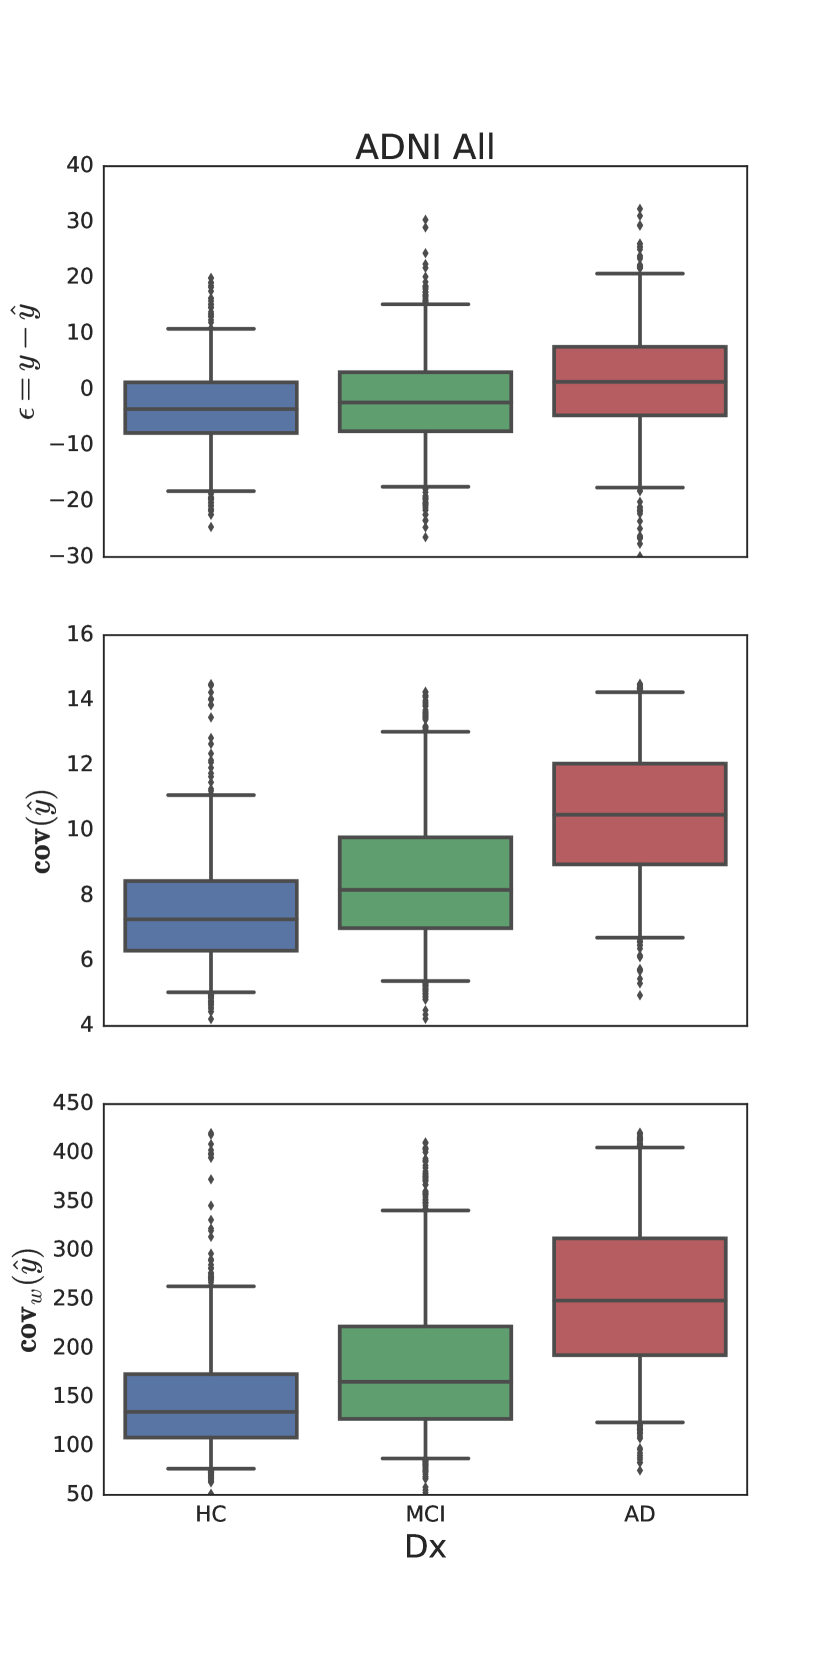
For our first experiment we measure the separation between HC, MCI and AD groups for images obtained from the ADNI database. Due to the very large dataset size of this testing scenario, all the p-values reported in table 5 are statistically significant (p-value < ). The reported AUC values in table 6 and the ROC curves in figure 6 show consistently a better performance of the uncertainty based metrics and with respect to . In general and presented similar performance, but adding the age term resulted in larger AUC values for the experiments on volume and VBM features. Box plots for each feature set and each diagnostic group are also shown in figure 7. The results using uncertainty based measures and were strongly correlated (R =0.95). In contrast, correlations of 0.35 and 0.37 were obtained between - and -, respectively.
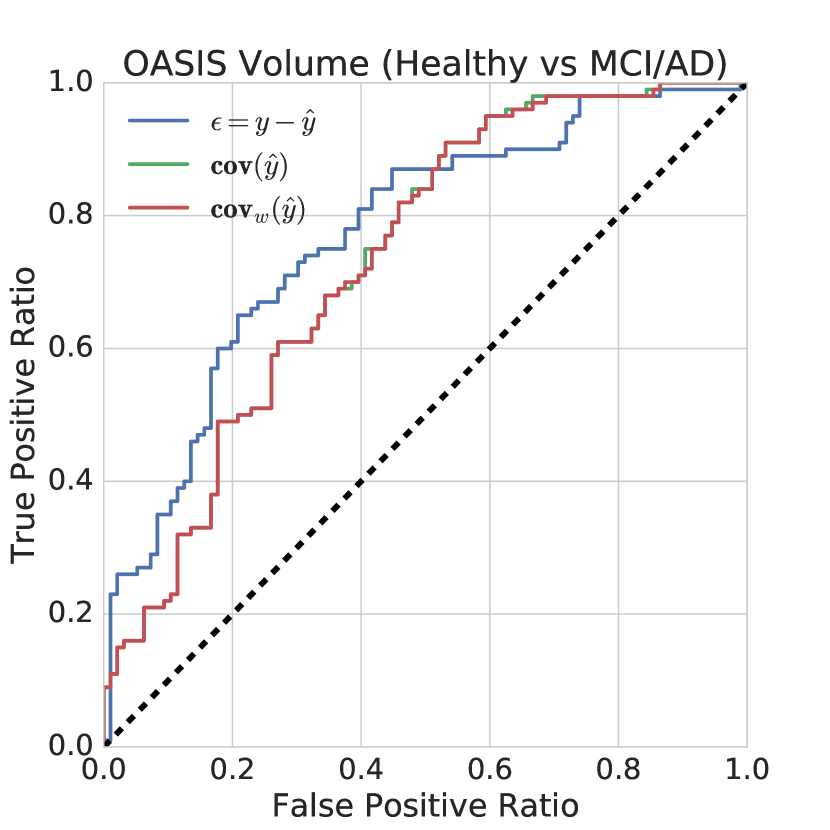
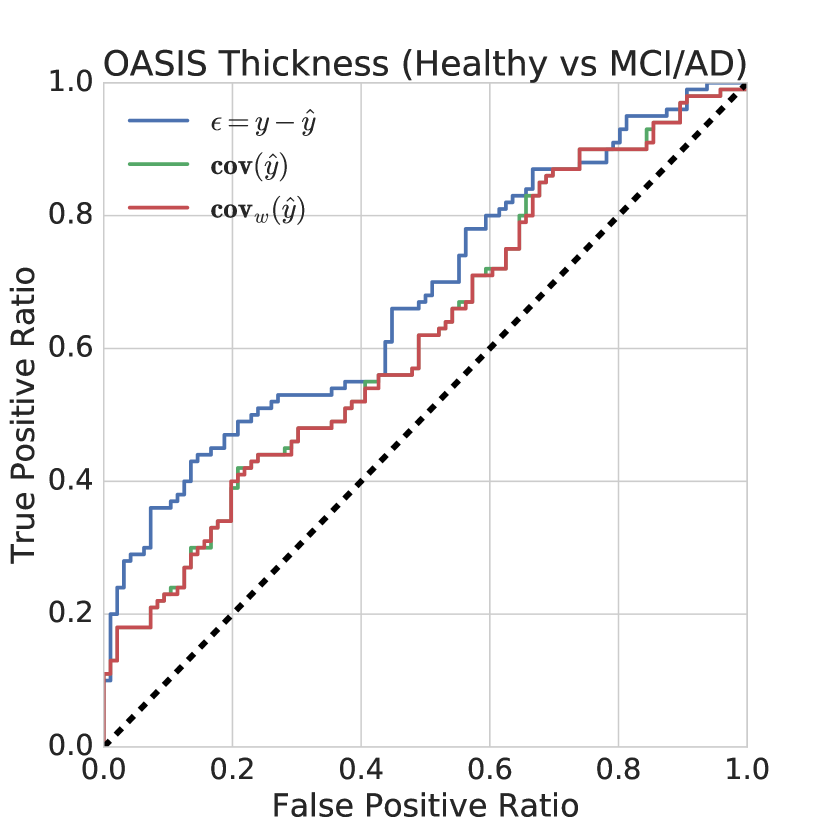
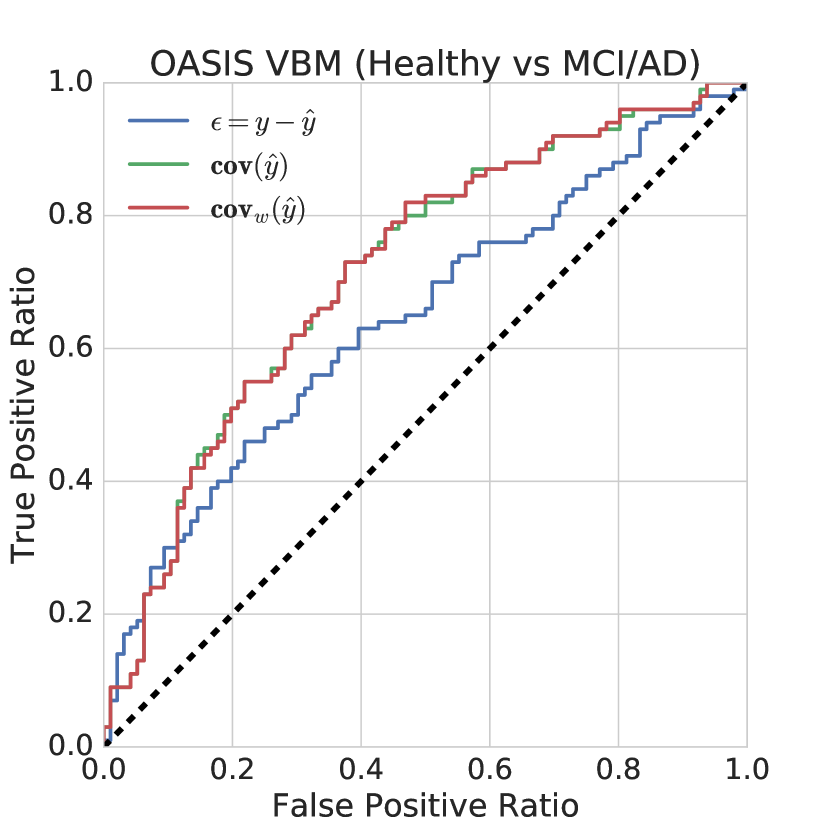
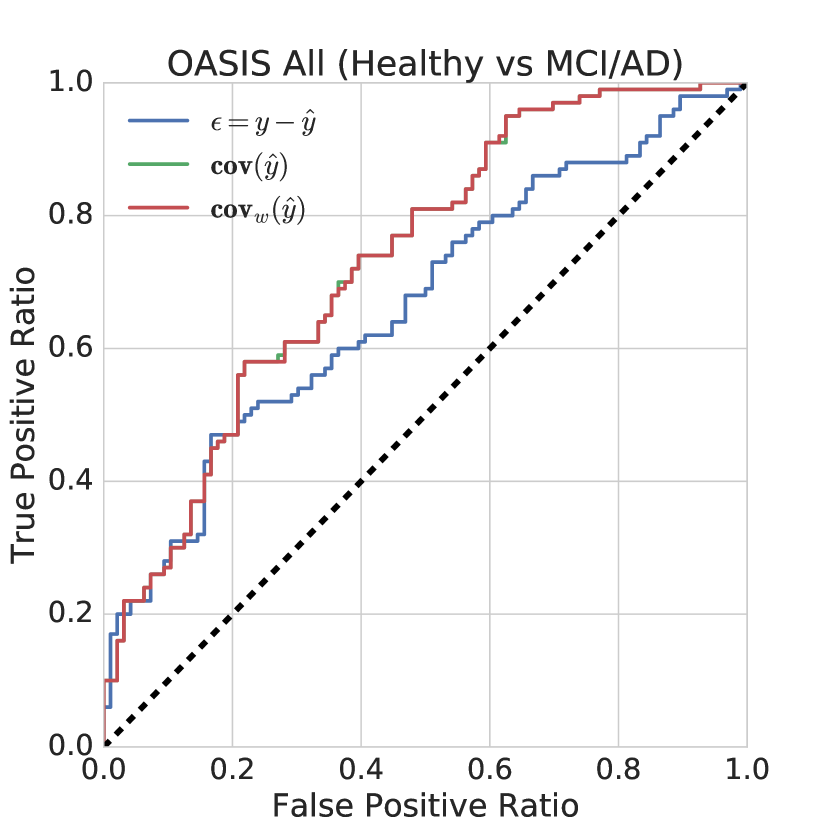
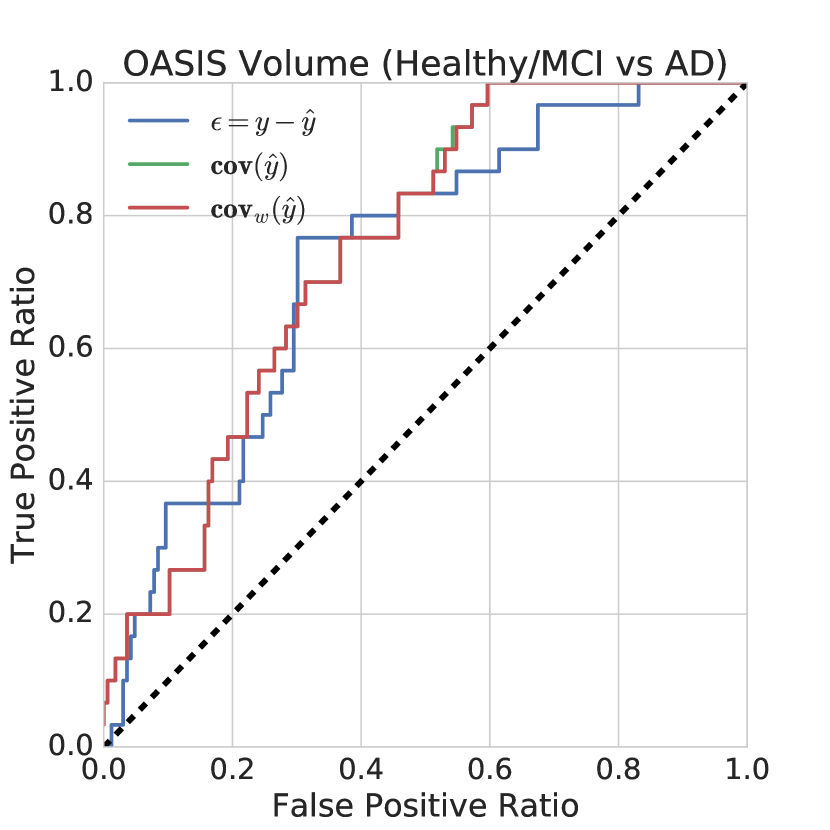
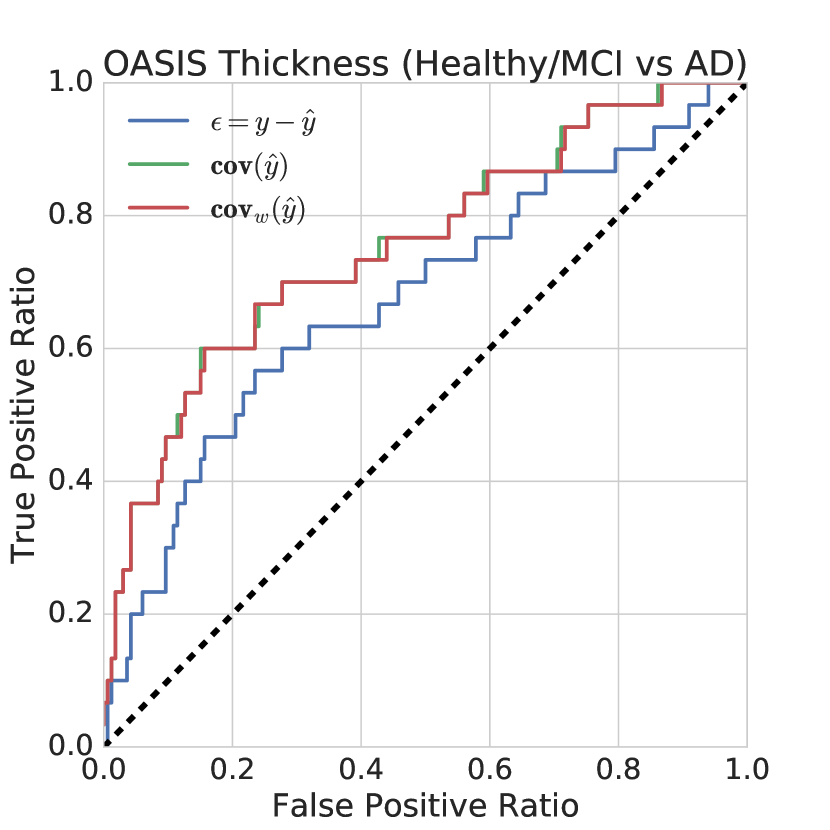
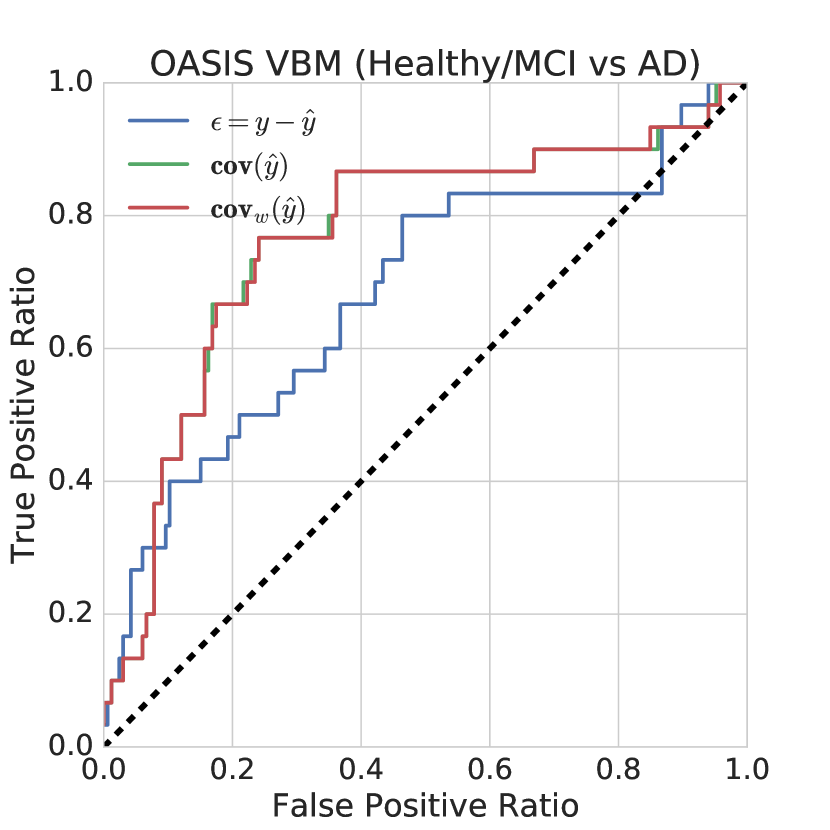
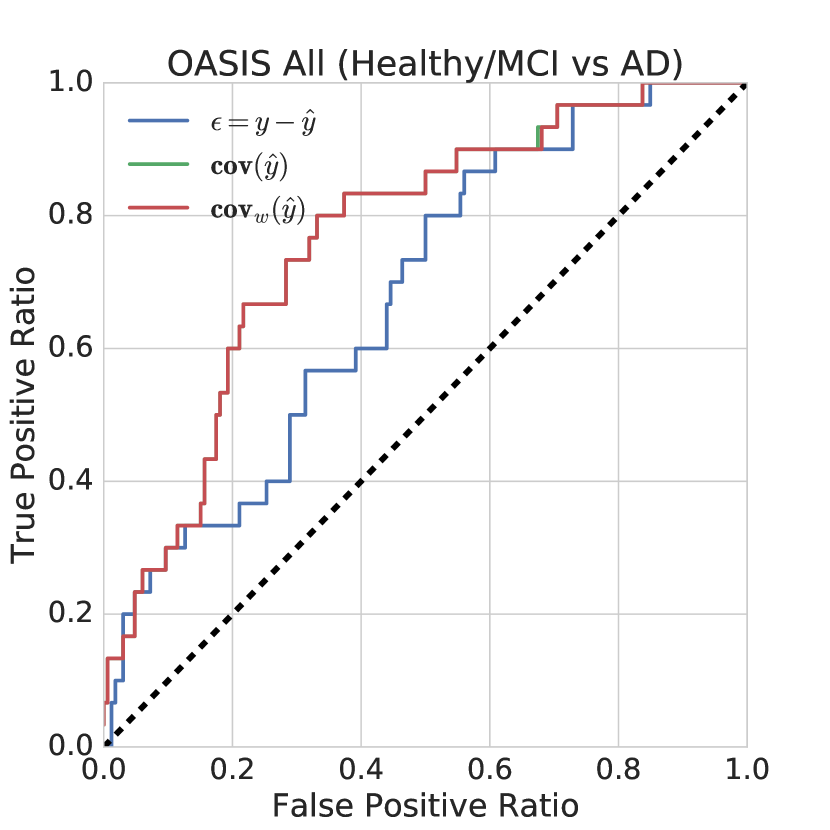
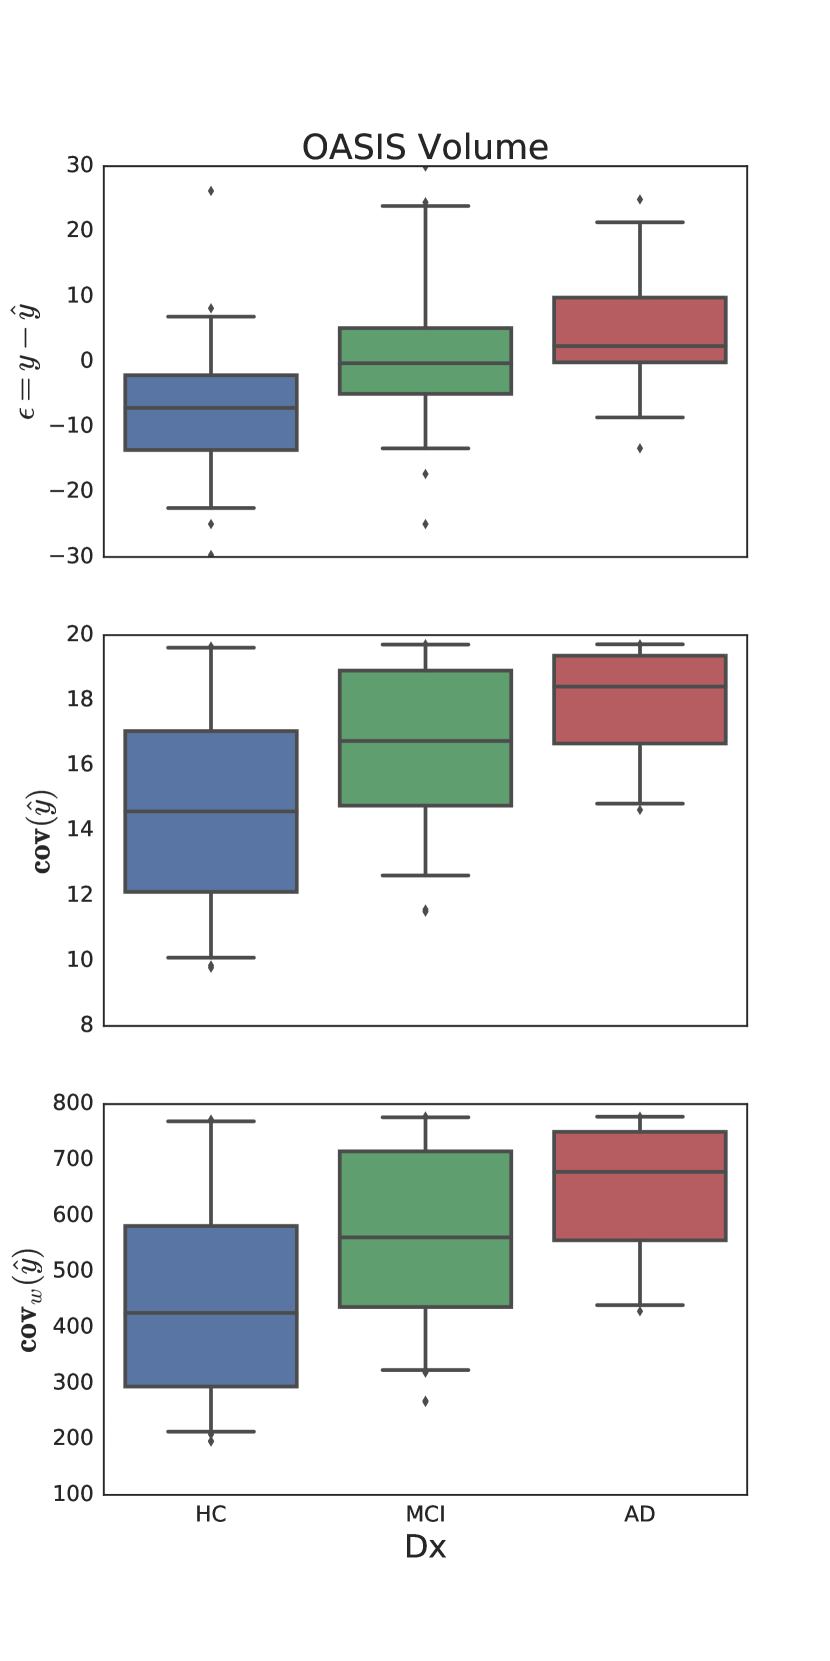
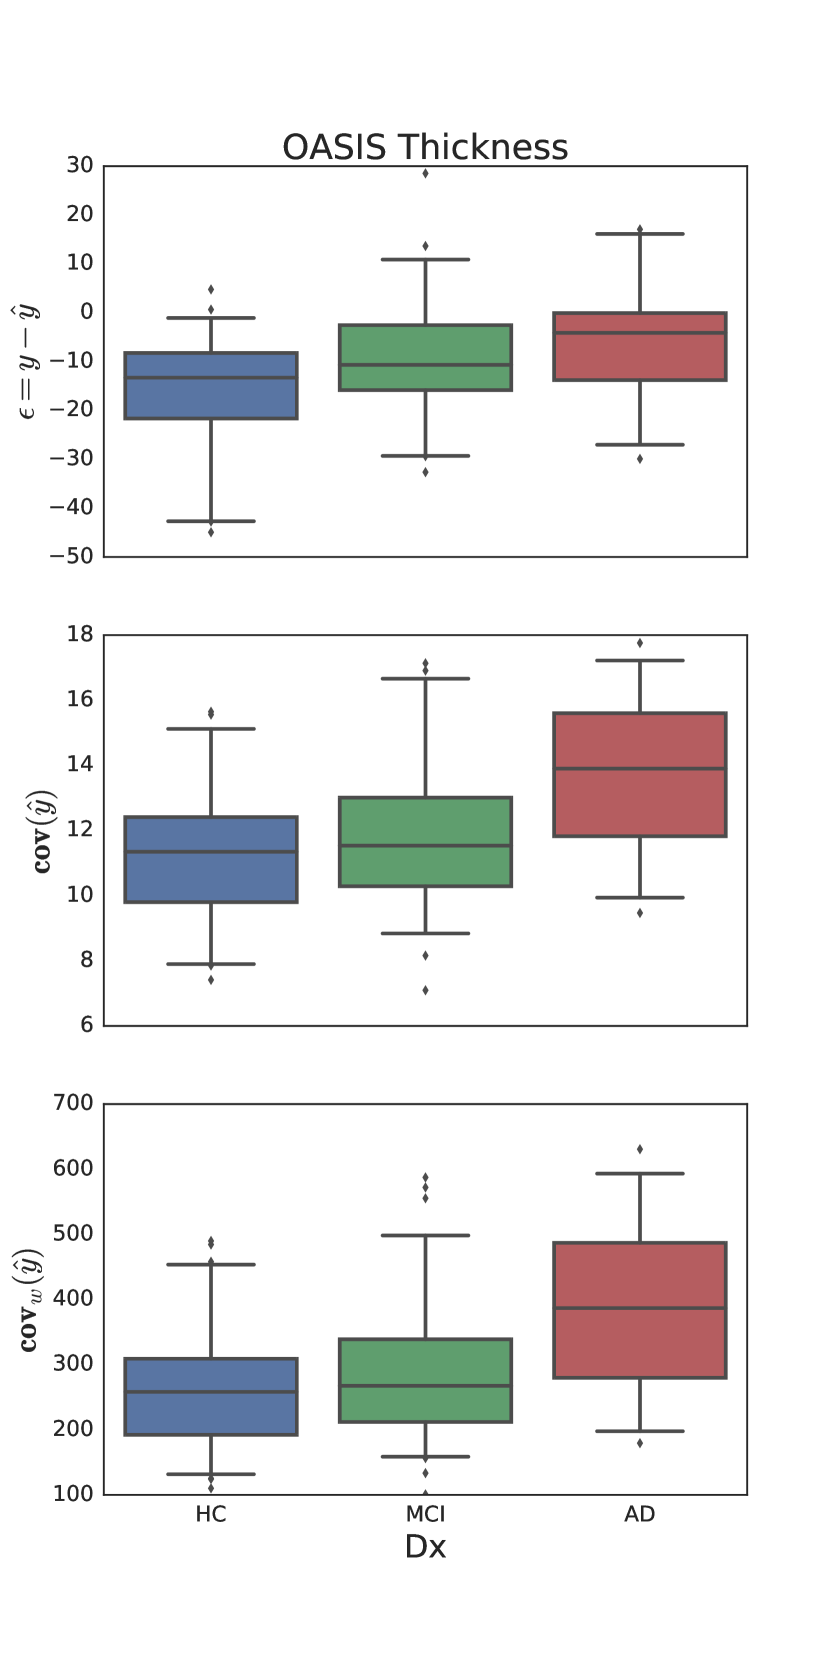
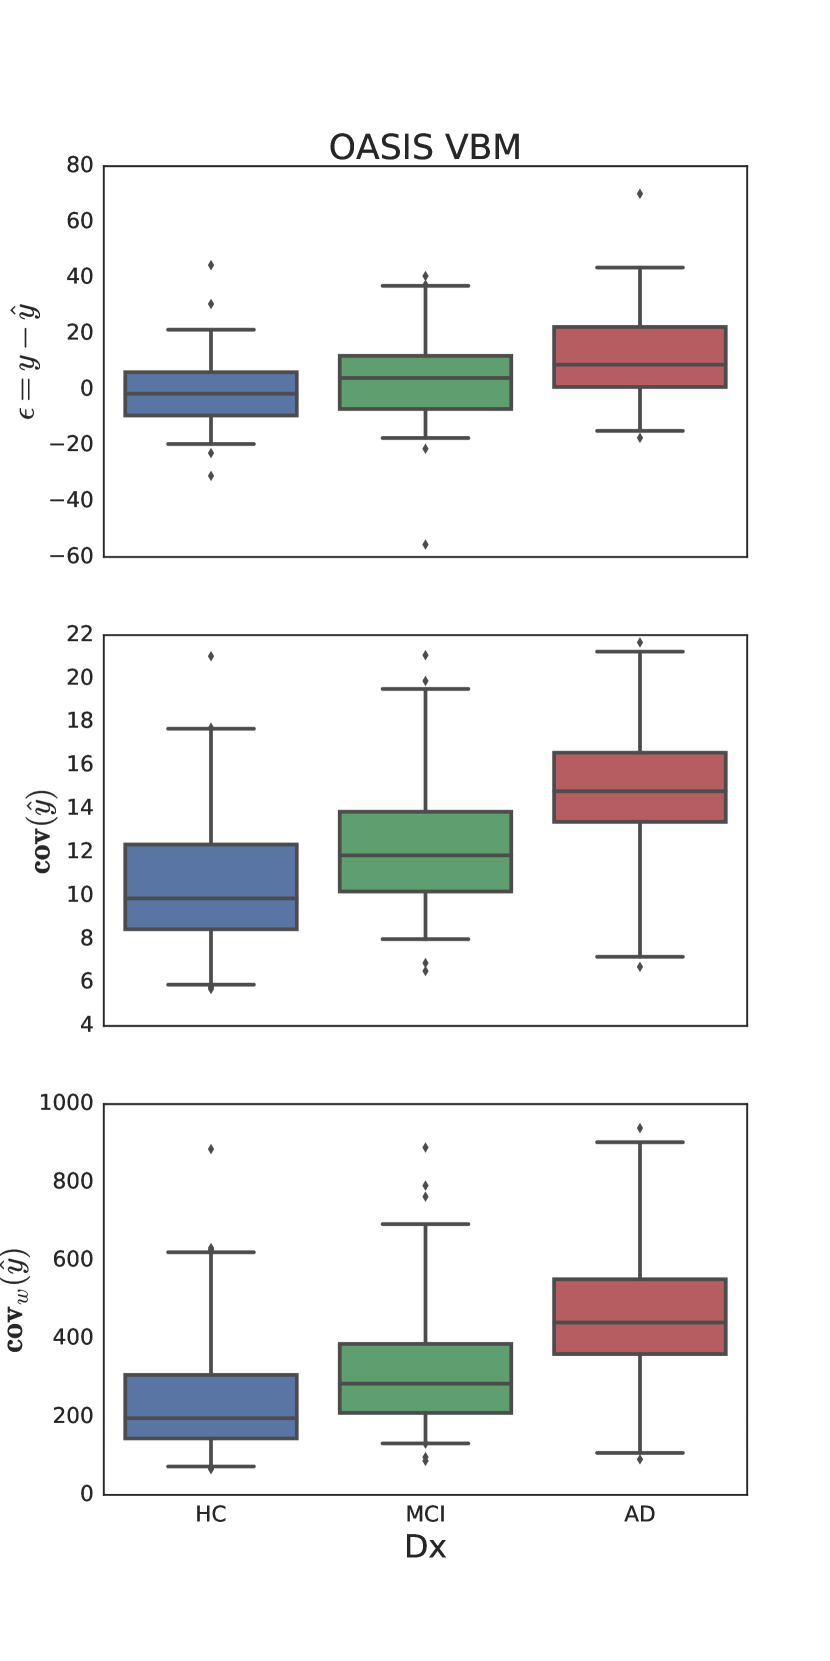
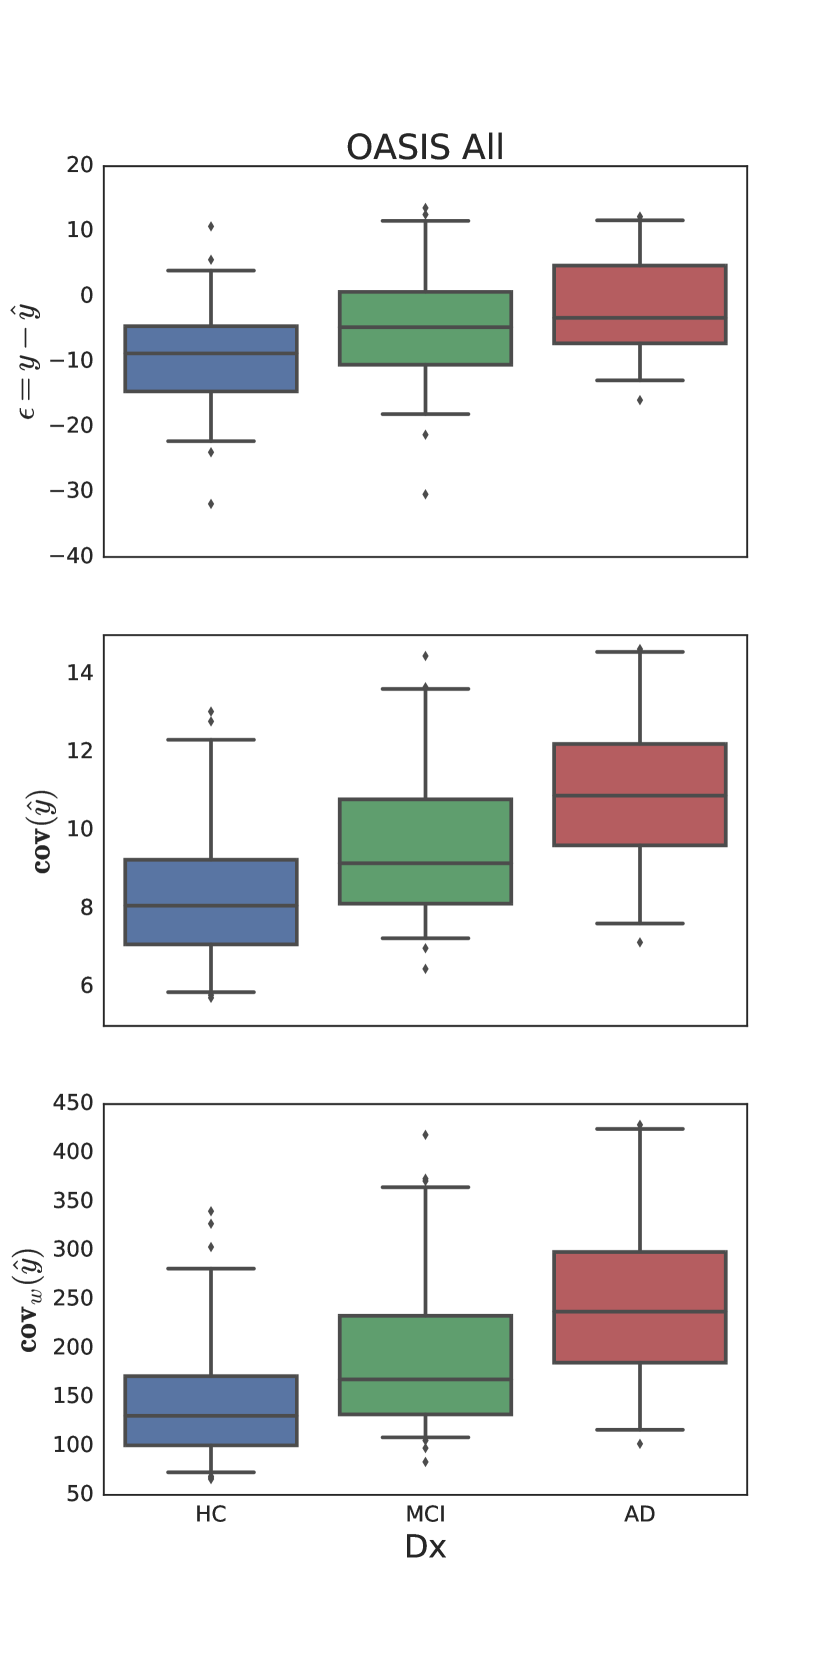
3.3.2 Experiment 2: OASIS Dataset
Our second experiment is similar to experiment 1, but our evaluation is performed on images obtained from the OASIS database. In order to ensure similar age ranges for the HC, MCI and AD groups, all individuals under 60 years were removed from the testing dataset. Tables 7 and 8 summarize the numerical results of the comparisons between HC-MCI and MCI-AD groups. Similar to previous results (Franke et al., 2010), we observed that prediction error is a useful biomarker in this particular dataset. According to the results in tables 7 and 8, presented larger AUC values and smaller p-values for the models trained using volume and thickness features when discriminating between HC and MCI groups. However for all the rest of the evaluations on the OASIS database, and presented the best performance amongst the evaluated metrics. Correlation coefficients between the metrics were 0.99 for -, 0.38 for - and 0.38 for -. Notice that in this case the results for and are strongly correlated due to the very large value assigned to the age length scale parameter . The ROC curves in figure 8 and the box plots in figure 9 confirm these observations.
| HC-MCI | MCI-AD | |||||
|---|---|---|---|---|---|---|
| Volume | <0.0001 | <0.0001 | < 0.0001 | 0.0611 | 0.0065 | 0.0067 |
| Thickness | 0.0005 | 0.1186 | 0.1123 | 0.0707 | 0.0002 | 0.0002 |
| VBM | 0.0075 | <0.0001 | <0.0001 | 0.0225 | 0.0003 | 0.0003 |
| All | 0.0015 | <0.0001 | < 0.0001 | 0.0707 | 0.0020 | 0.0020 |
| HC-MCI | MCI-AD | |||||
|---|---|---|---|---|---|---|
| Volume | 0.77 | 0.73 | 0.73 | 0.73 | 0.75 | 0.75 |
| Thickness | 0.68 | 0.62 | 0.62 | 0.68 | 0.76 | 0.76 |
| VBM | 0.64 | 0.72 | 0.72 | 0.68 | 0.77 | 0.77 |
| All | 0.67 | 0.74 | 0.74 | 0.68 | 0.77 | 0.77 |
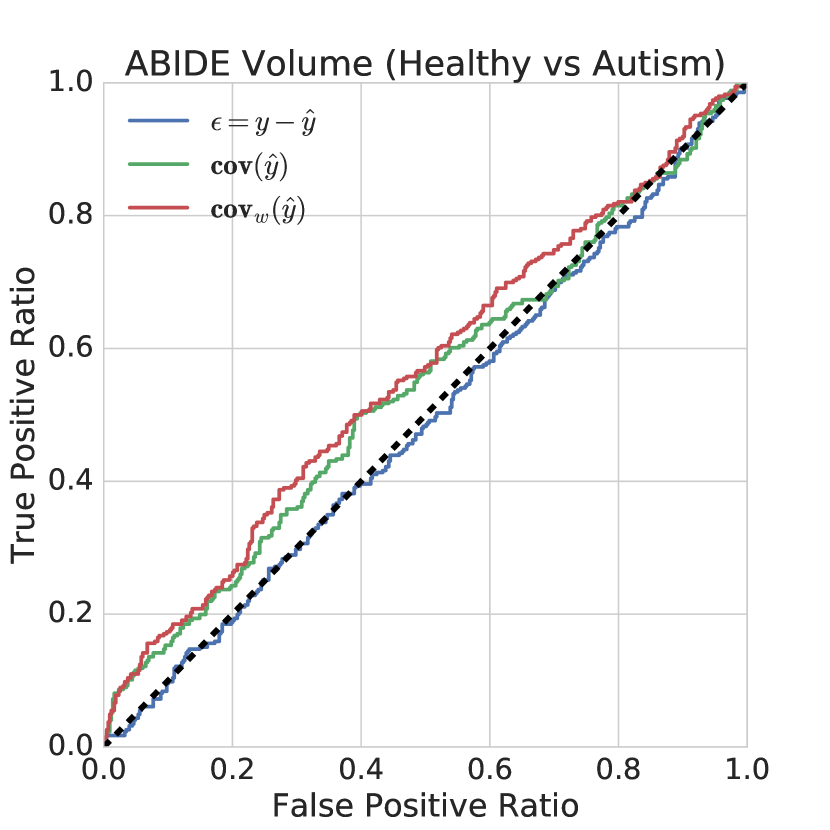
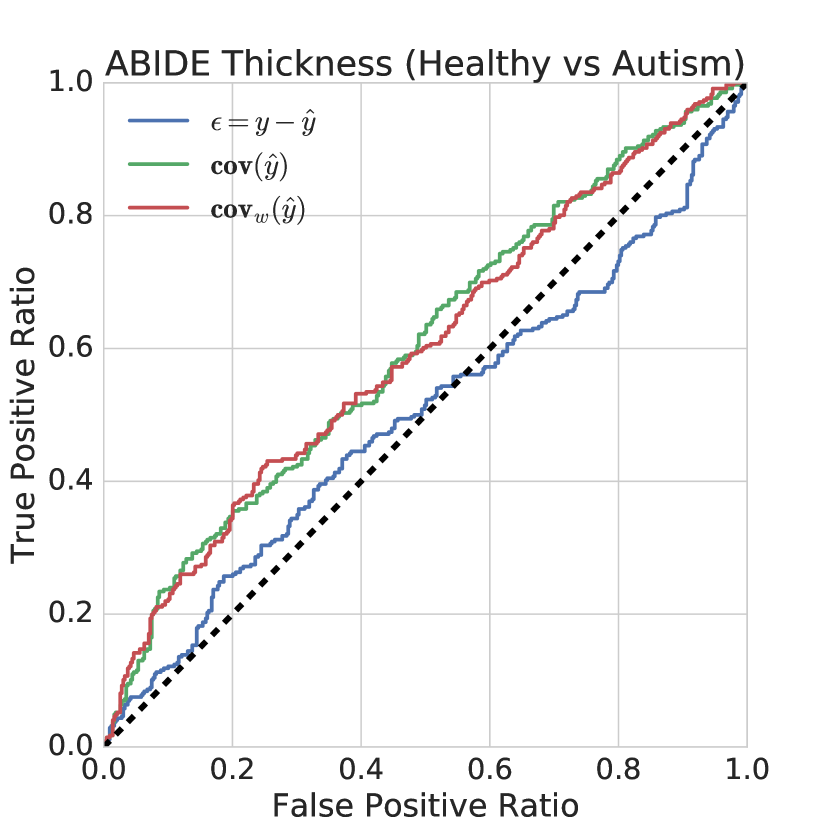
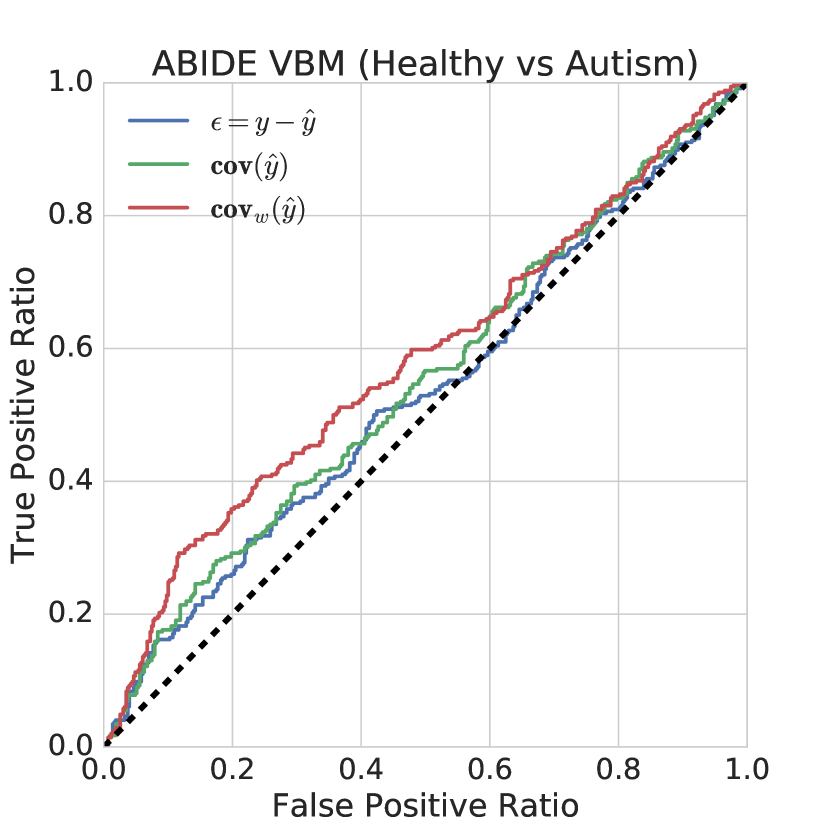
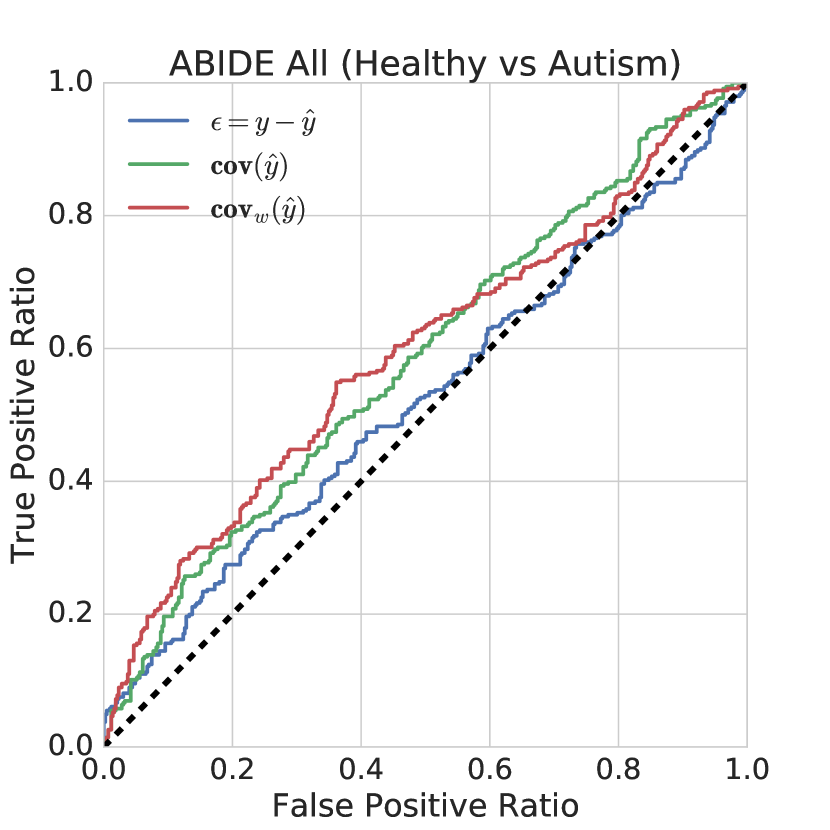
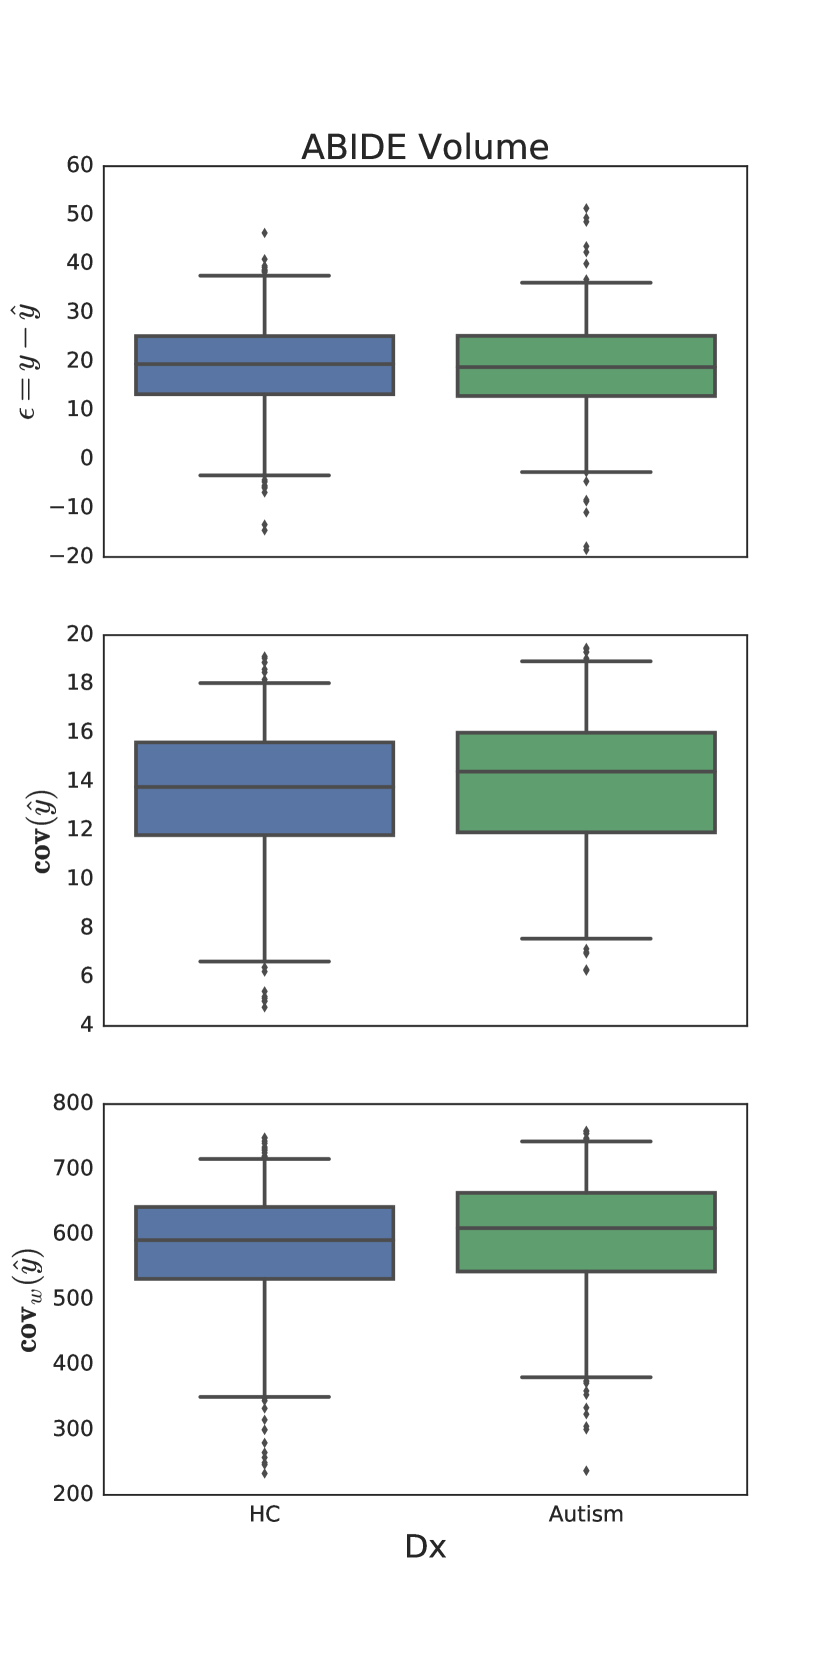
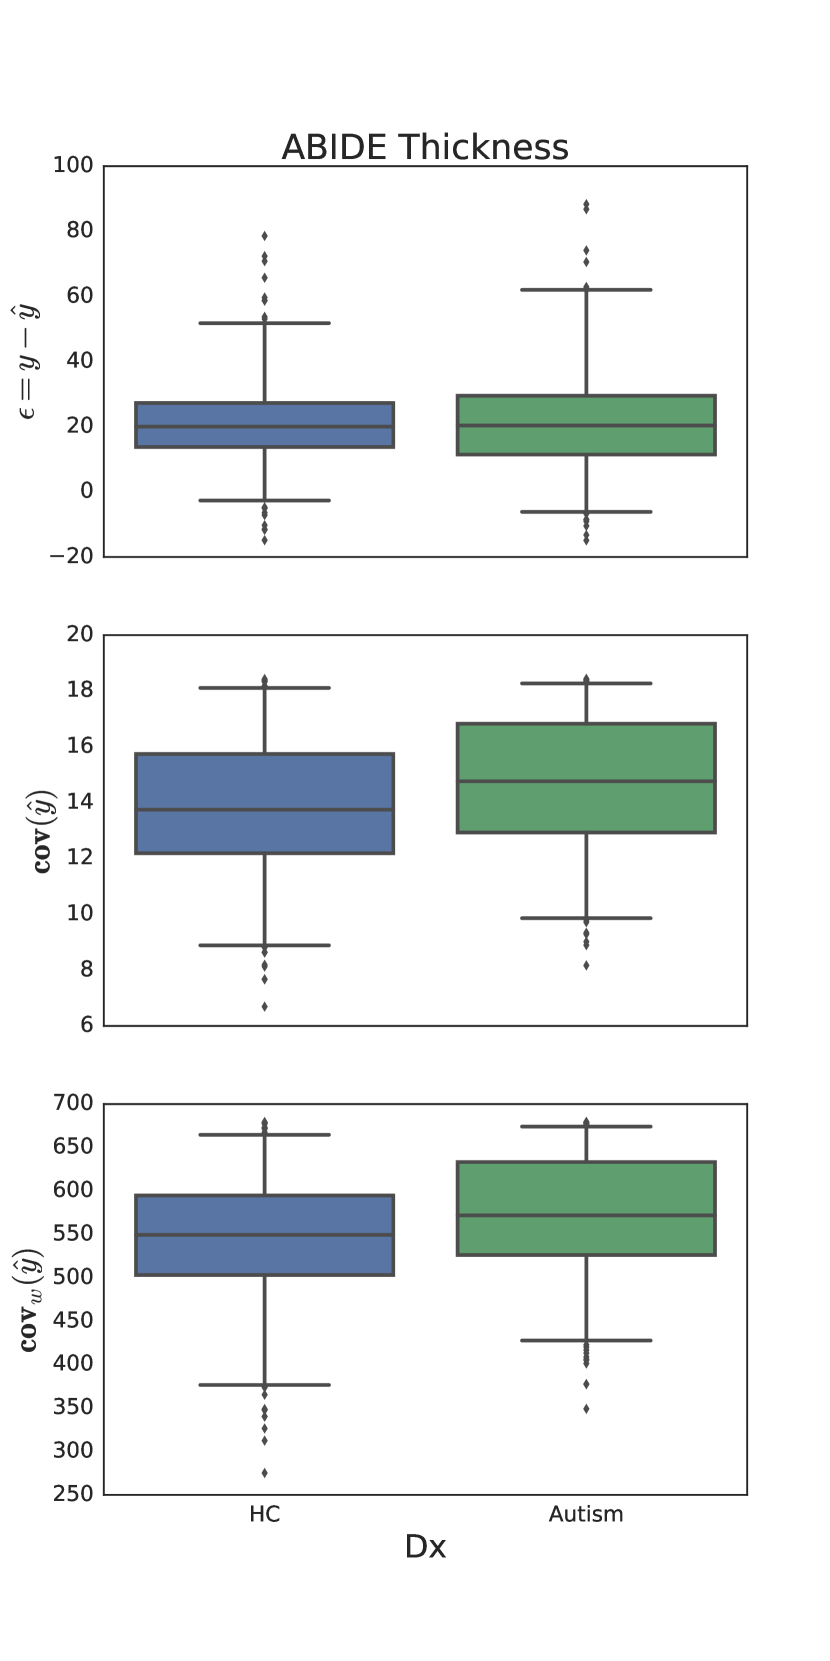
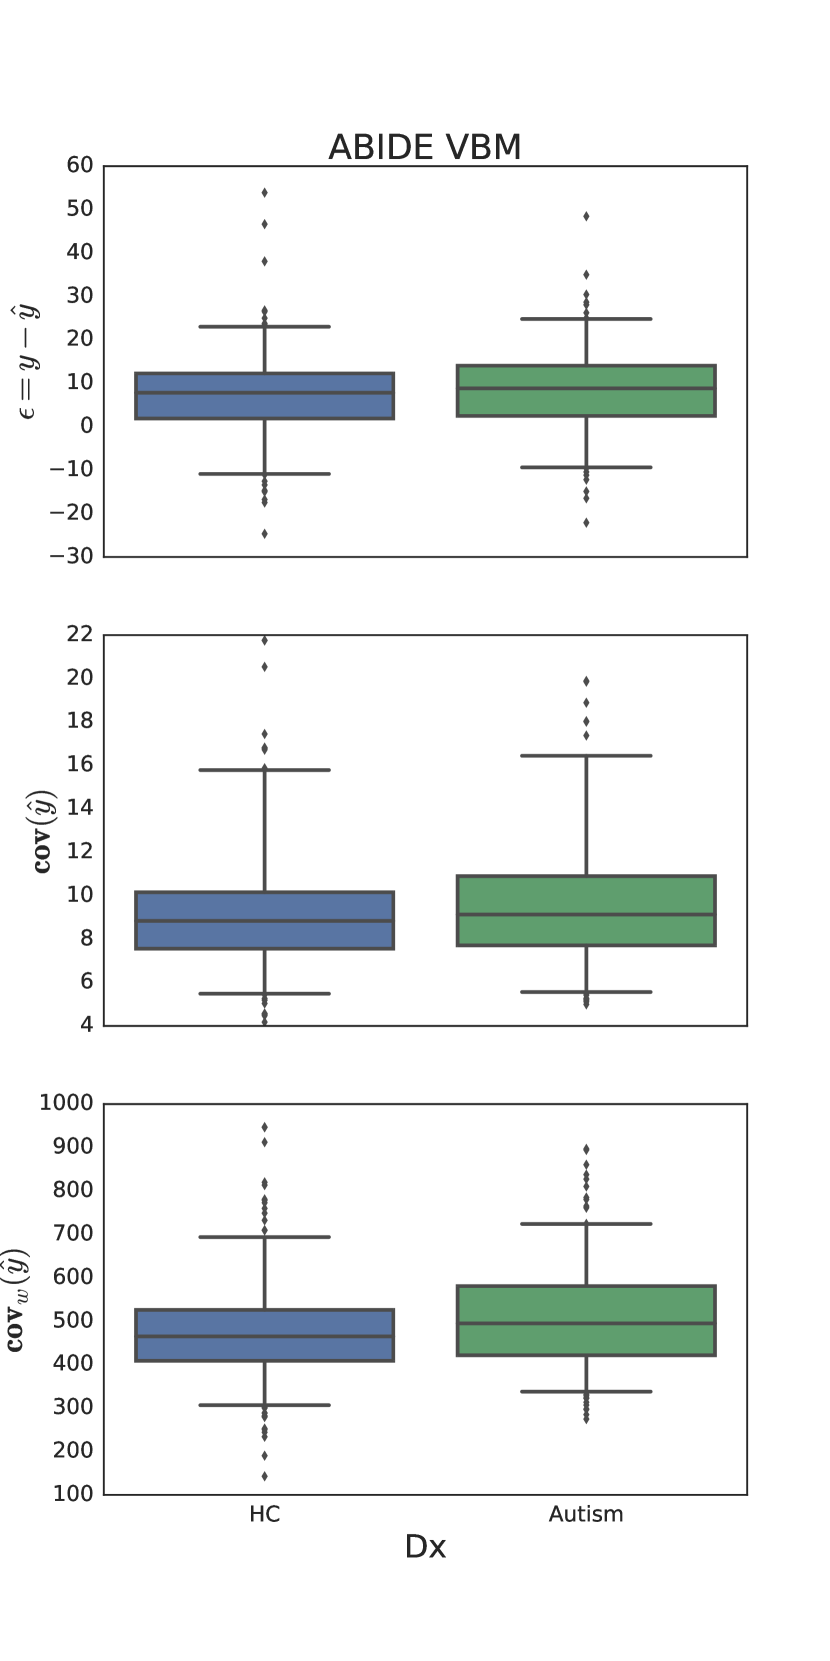
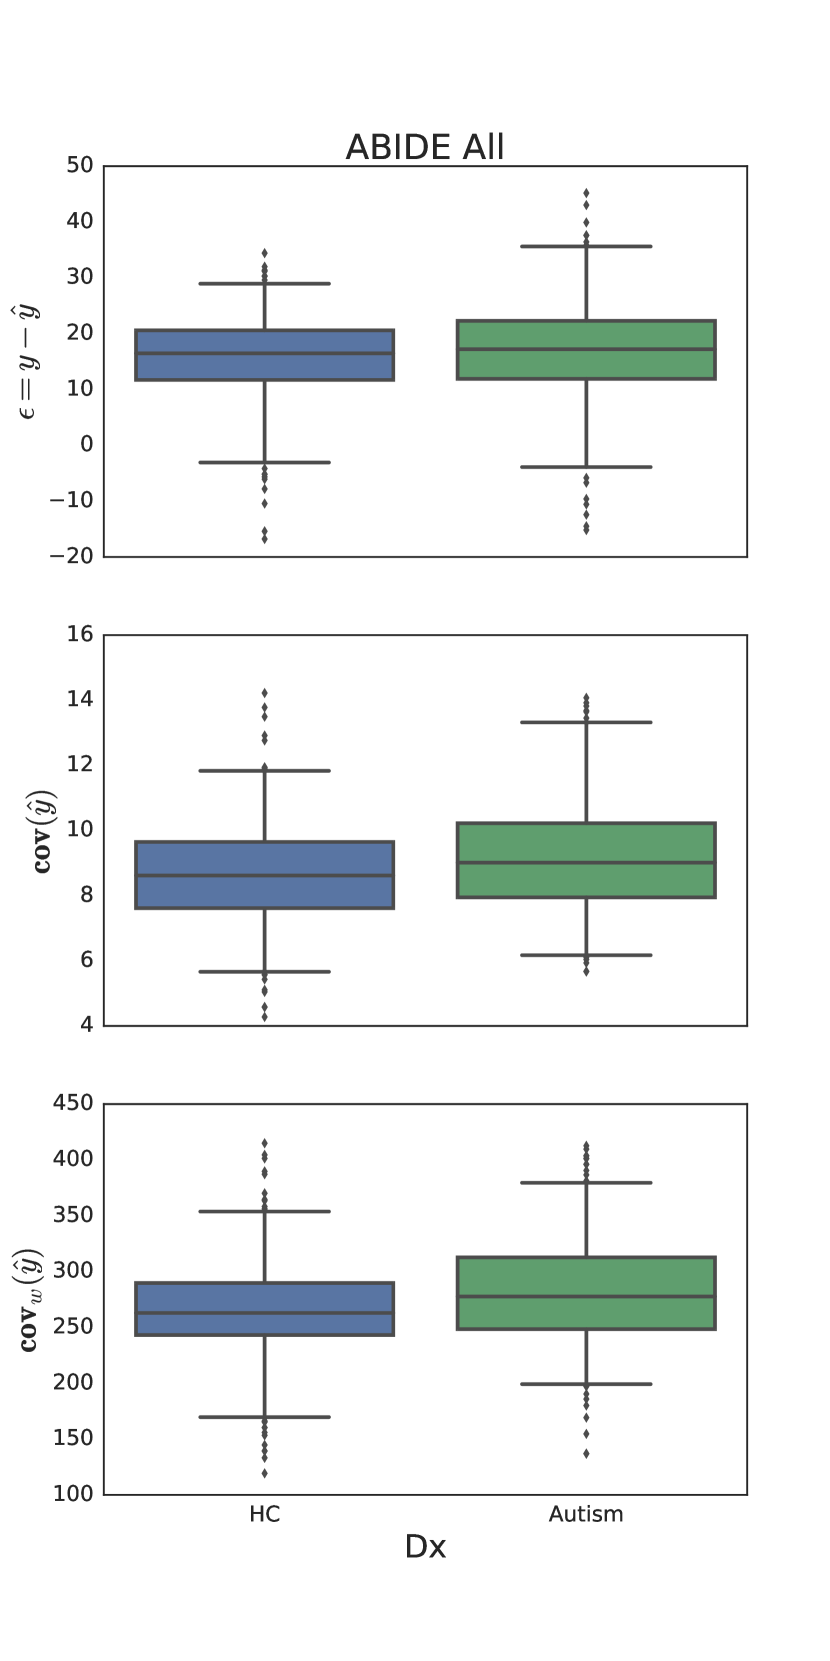
3.3.3 Experiment 3: ABIDE II Dataset
For our third experiment, we evaluate the age prediction on the ABIDE II dataset that contains subjects with autism. To the best of our knowledge, no previous age prediction based approach has been used for studying autism. However, previous studies have suggested abnormal brain development in patients diagnosed with autism Courchesne et al. (2001). By observing figures 11 and 10 it is clear that differences between HC and MCI groups are considerably less noticeable than in the previous two experiments. In fact, by analyzing the AUC results in table 10 and the p-values in table 9, we can observe that no significant differences between groups were found using the standard prediction error approach using as a predictive variable. In contrast, both uncertainty based measurements showed significant differences between HC and autistic groups. Also different to the previous two experiments, the weighted uncertainty based measurement showed a better performance than the standard uncertainty . In this case correlation coefficients between the metrics were 0.64 for -, 0.30 for - and 0.49 for -. The lower correlation between - and the larger correlation between - when compared to the two previous experiments are caused by the smaller value of .
| Volume | 0.3210 | <0.0317 | <0.0019 |
|---|---|---|---|
| Thickness | 0.4664 | <0.0001 | <0.0001 |
| VBM | 0.0556 | 0.0089 | <0.0001 |
| All | 0.1060 | <0.0001 | <0.0001 |
| Volume | 0.50 | 0.53 | 0.58 |
|---|---|---|---|
| Thickness | 0.50 | 0.60 | 0.60 |
| VBM | 0.53 | 0.55 | 0.60 |
| All | 0.53 | 0.58 | 0.60 |
4 Discussion
In this work, we have proposed to use uncertainty in GPR as a measure of neuropathology. In contrast to previous work based on the prediction error, which assumes similar trajectories between aging and disease processes, the GPR uncertainty handles differences in morphology of diseased brains that do not necessarily lie on a healthy aging trajectory. If we consider predicted age as an aging biomarker, GPR uncertainty can be seen as a measure of uncertainty of the aging biomarker. We have evaluated the ability of GPR uncertainty to discriminate subjects with pathology for two very different diseases: Alzheimer’s disease where we worked with a cohort of advanced age individuals, and autism where we operated on a younger cohort. To the best of our knowledge, this is the first time that uncertainty in a GPR model is used as a measure of neuropathology and it is also the first application of an age regression model for autism. For both applications, we work with a single model that was trained on healthy subjects from a wide age range. This distinguishes our work from discriminative approaches, which require the inclusion of images of patients diagnosed with a particular disease in the training set.
In this work, we build age prediction models using three different types of brain features: VBM, volume and thickness as well as a combination of all of them. Based on our results, we have observed that none of the features outperformed the others across all our evaluations. However, combining all features resulted on a model with the lowest prediction error and consistently achieved the best results when performing separation between healthy and disease groups. This is in line with previous work (Valizadeh et al., 2017; Liem et al., 2017), where it has been observed that extended feature sets which give models a larger variety of measurements to base the prediction on, result in more accurate age estimation models. Although the main goal of this paper is not to present a state-of-the-art age prediction method, we have observed that our proposed GPR model has a high prediction accuracy, comparable to that of current age estimation approaches (Valizadeh et al., 2017; Cole et al., 2016).
We have also demonstrated the generalization ability of our method by training and testing our model in completely independent datasets. Our training dataset was built based on the IXI, ABIDE and AIBL databases while testing was performed on the OASIS, ADNI and ABIDE II databases. Using different datasets for training and testing complicates the age prediction problem, as undesired dataset biases can impact the result (Wachinger and Reuter, 2016; Gutiérrez et al., 2017). However, such experiments model a scenario that is more realistic, as the translation to the clinic requires the accurate deployment of our method on data that differs from the training set.
Based on GPR uncertainty, we have introduced two metrics to assess the similarity of a test subject to a model of healthy aging: the uncertainty of the predictions of the GPR and an age-weighted uncertainty measurement . We have shown in our experiments in section 3 that both measures find statistically significant differences between HC, MCI and AD groups as well as between autism and HC groups. We have compared these results to the commonly used prediction error , and we have shown that the proposed metrics yield a better separation between groups. The age-weighted uncertainty measurement can be seen as an extension to the standard uncertainty measure, with the inclusion of a weighting parameter based on the chronological age of the test subject. The effect of this weighting is controlled by the age-length scale parameter . We have analyzed the effect of in the performance of the age-weighted uncertainty measurement and we have observed that although the use of the age-weighting had a limited effect in the case of the MCI/AD experiments there was a clear improvement in the case of autism. We hypothesize that these differences in performance of can be attributed to the different age ranges of the testing cohorts, since age prediction models present smaller prediction errors when testing on younger cohorts compared to the prediction error presented on datasets consisting of older individuals (Cole and Franke, 2017).
For the experiment on autism, our proposed uncertainty based metrics showed its ability to discriminate between autistic and healthy groups. We find these results particularly encouraging since the prediction error based approach showed to be insufficient to find differences for this particular disease. Given the analysis performed in section 3.1 and the results of our experiments, we believe that the main reason of the better performance of our uncertainty based measures is that they do not model brain anomaly as an accelerated aging process, but rather as deviations from healthy aging. As discussed before, the complex effects of aging and disease follow trajectories that affect different areas of the brain at different rates. The more relaxed assumptions, which our proposed uncertainty based measures are based on, are therefore better suited to account for the complex impact of aging and disease across the entire brain.
We have not performed direct quantitative comparisons between our uncertainty based measures and discriminative approaches. The main reason behind this is that discriminative approaches require training images not only from healthy individuals but also from patients. This means that separate models have to be trained for each specific disease. In contrast, age-prediction based models are only built on images from healthy individuals. This allows to have a flexible model which can be used for different diseases without any need to retrain or adjust the model. We demonstrated this in our experiments, where we used the same age prediction model to predict brain anomaly both on patients with Alzheimer’s disease and patients with autism.
5 Conclusions
We introduced the prediction uncertainty in age estimation as a measure of neuropathology, based on a multivariate age prediction model based on Gaussian process regression. Our measure does not make a priori specific assumptions about the nature of the changes caused by disease, but rather models these changes as deviations from healthy aging. The method is therefore not limited to a specific pathology or age range, as demonstrated in our experiments on patients with Alzheimer’s disease and patients with autism. Our method is also flexible to work with different sets of features, as we have illustrated in our experiments using volume, thickness, and VBM features. We have introduced an extension of the Gaussian process uncertainty measure for age estimation that also takes the chronological age into account, resulting in a weighted uncertainty measure, and we have demonstrated that the inclusion of this weighted measure can potentially be helpful for some applications. In comparison to the commonly used prediction error, the prediction uncertainty yielded an improved separation of diagnostic groups across all feature types and for different applications. It is also important to point out that in contrast to discriminative approaches, age prediction based models only require images of healthy individuals for training, which may allow for incorporating scans from large population-based studies in the future. The results presented in this paper encourage us to further explore the potential of uncertainty based measures and to apply our method to different diseases or conditions that might have complex effects in the anatomy of the brain. We are further interested in investigating the relationship between the prediction uncertainty and cognitive and clinical characteristics, as well as, future health outcomes.
Acknowledgements
This work was partly funded by SAP SE, the Förderprogramm für Forschung und Lehre, the Bavarian State Ministry of Education, Science and the Arts in the framework of the Centre Digitisation.Bavaria (ZD.B) and the Faculty of Medicine of the University Munich (Förderprogramm für Forschung & Lehre). Data collection and sharing for this project was funded by the Alzheimer’s DiseaseNeuroimaging Initiative (ADNI) (National Institutes of Health Grant U01 AG024904) and DOD ADNI (Department of Defense award number W81XWH-12-2-0012). ADNI is funded by the National Institute on Aging, the National Institute of Biomedical Imaging and Bioengineering, and through generous contributions from the following: AbbVie, Alzheimer’s Association; Alzheimer’s Drug Discovery Foundation; Araclon Biotech; BioClinica, Inc.; Biogen; Bristol-Myers Squibb Company; CereSpir, Inc.; Cogstate; Eisai Inc.; Elan Pharmaceuticals, Inc.; Eli Lilly and Company; EuroImmun; F. Hoffmann-La Roche Ltd and its affiliated company Genentech, Inc.; Fujirebio; GE Healthcare; IXICO Ltd.; Janssen Alzheimer Immunotherapy Research & Development, LLC.; Johnson & Johnson Pharmaceutical Research & Development LLC.; Lumosity; Lundbeck; Merck & Co., Inc.; Meso Scale Diagnostics, LLC.; NeuroRx Research; Neurotrack Technologies; Novartis Pharmaceuticals Corporation; Pfizer Inc.; Piramal Imaging; Servier; Takeda Pharmaceutical Company; and Transition Therapeutics. The Canadian Institutes of Health Research is providing funds to support ADNI clinical sites in Canada. Private sector contributions are facilitated by the Foundation for the National Institutes of Health (www.fnih.org). The grantee organization is the Northern California Institute for Research and Education, and the study is coordinated by the Alzheimer’s Therapeutic Research Institute at the University of Southern California. ADNI data are disseminated by the Laboratory for Neuro Imaging at the University of Southern California.
References
- Buckner (2004) Buckner, R. L., 2004. Memory and executive function in aging and ad. Neuron 44 (1), 195–208.
- Cole and Franke (2017) Cole, J. H., Franke, K., 2017. Predicting age using neuroimaging: Innovative brain ageing biomarkers. Trends in Neurosciences.
- Cole et al. (2015) Cole, J. H., Leech, R., Sharp, D. J., 2015. Prediction of brain age suggests accelerated atrophy after traumatic brain injury. Annals of neurology 77 (4), 571–581.
-
Cole et al. (2016)
Cole, J. H., Poudel, R. P., Tsagkrasoulis, D., Caan, M. W., Steves, C.,
Spector, T. D., Montana, G., 2016. Predicting brain age with deep learning
from raw imaging data results in a reliable and heritable biomarker.
URL http://arxiv.org/abs/1612.02572 - Courchesne et al. (2001) Courchesne, E., Karns, C., Davis, H., Ziccardi, R., Carper, R., Tigue, Z., Chisum, H., Moses, P., Pierce, K., Lord, C., et al., 2001. Unusual brain growth patterns in early life in patients with autistic disorder an mri study. Neurology 57 (2), 245–254.
- Di Martino et al. (2014) Di Martino, A., Yan, C.-G., Li, Q., Denio, E., Castellanos, F. X., Alaerts, K., Anderson, J. S., Assaf, M., Bookheimer, S. Y., Dapretto, M., et al., 2014. The autism brain imaging data exchange: towards large-scale evaluation of the intrinsic brain architecture in autism. Molecular psychiatry 19 (6), 659.
- Ellis et al. (2009) Ellis, K. A., Bush, A. I., Darby, D., De Fazio, D., Foster, J., Hudson, P., Lautenschlager, N. T., Lenzo, N., Martins, R. N., Maruff, P., et al., 2009. The australian imaging, biomarkers and lifestyle (aibl) study of aging: methodology and baseline characteristics of 1112 individuals recruited for a longitudinal study of alzheimer’s disease. International Psychogeriatrics 21 (4), 672–687.
- Fischl (2012) Fischl, B., 2012. Freesurfer. Neuroimage 62 (2), 774–781.
- Fjell et al. (2014) Fjell, A. M., Westlye, L. T., Grydeland, H., Amlien, I., Reinvang, I., Raz, N., Holland, D., Dale, A. M., Walhovd, K. B., Neuroimaging, D., 2014. Critical ages in the life-course of the adult brain: nonlinear subcortical aging 34 (10), 2239–2247.
-
Franke et al. (2010)
Franke, K., Ziegler, G., Klöppel, S., Gaser, C., 2010. Estimating the
age of healthy subjects from T1-weighted MRI scans using kernel methods:
Exploring the influence of various parameters. Neuroimage 50 (3), 883–892.
URL http://dx.doi.org/10.1016/j.neuroimage.2010.01.005 - Gaser et al. (2013) Gaser, C., Franke, K., Klöppel, S., Koutsouleris, N., Sauer, H., 2013. BrainAGE in Mild Cognitive Impaired Patients: Predicting the Conversion to Alzheimer’s Disease. PLoS One 8 (6).
-
Good et al. (2001)
Good, C. D., Johnsrude, I. S., Ashburner, J., Henson, R. N., Friston, K. J.,
Frackowiak, R. S., 2001. A Voxel-Based Morphometric Study of Ageing in 465
Normal Adult Human Brains. Neuroimage 14 (1), 21–36.
URL http://linkinghub.elsevier.com/retrieve/pii/S1053811901907864 - Gutiérrez et al. (2017) Gutiérrez, B., Peter, L., Klein, T., Wachinger, C., 2017. A multi-armed bandit to smartly select a training set from big medical data. In: International Conference on Medical Image Computing and Computer-Assisted Intervention. Springer, pp. 38–45.
-
Guttmann et al. (1998)
Guttmann, C., Jolesz, F. A., Kikinis, R., Killiany, R. J., Moss, M. B., Sandor,
T., Albert, M. S., 1998. White matter changes with normal aging. Neurology
50 (4), 972–978.
URL http://www.neurology.org/cgi/doi/10.1212/WNL.50.4.972 -
Habes et al. (2016)
Habes, M., Janowitz, D., Erus, G., Toledo, J. B., Resnick, S. M., Doshi, J.,
Van der Auwera, S., Wittfeld, K., Hegenscheid, K., Hosten, N., Biffar, R.,
Homuth, G., Völzke, H., Grabe, H. J., Hoffmann, W., Davatzikos, C.,
2016. Advanced brain aging: relationship with epidemiologic and genetic risk
factors, and overlap with Alzheimer disease atrophy patterns. Transl.
Psychiatry 6 (February), e775.
URL http://www.ncbi.nlm.nih.gov/pubmed/27045845 - Hedden and Gabrieli (2004) Hedden, T., Gabrieli, J. D., 2004. Insights into the ageing mind: a view from cognitive neuroscience. Nature reviews neuroscience 5 (2), 87–96.
- Ingalhalikar et al. (2014) Ingalhalikar, M., Smith, A., Parker, D., Satterthwaite, T. D., Elliott, M. A., Ruparel, K., Hakonarson, H., Gur, R. E., Gur, R. C., Verma, R., 2014. Sex differences in the structural connectome of the human brain. Proceedings of the National Academy of Sciences 111 (2), 823–828.
- Jack et al. (2008) Jack, C. R., Bernstein, M. A., Fox, N. C., Thompson, P., Alexander, G., Harvey, D., Borowski, B., Britson, P. J., L Whitwell, J., Ward, C., et al., 2008. The alzheimer’s disease neuroimaging initiative (adni): Mri methods. Journal of magnetic resonance imaging 27 (4), 685–691.
-
Kondo et al. (2015)
Kondo, C., Ito, K., Kai Wu, Sato, K., Taki, Y., Fukuda, H., Aoki, T., 2015.
An age estimation method using brain local features for T1-weighted images.
2015 37th Annu. Int. Conf. IEEE Eng. Med. Biol. Soc., 666–669.
URL http://ieeexplore.ieee.org/lpdocs/epic03/wrapper.htm?arnumber=7318450 - Koutsouleris et al. (2013) Koutsouleris, N., Davatzikos, C., Borgwardt, S., Gaser, C., Bottlender, R., Frodl, T., Falkai, P., Riecher-Rössler, A., Möller, H.-J., Reiser, M., et al., 2013. Accelerated brain aging in schizophrenia and beyond: a neuroanatomical marker of psychiatric disorders. Schizophrenia bulletin 40 (5), 1140–1153.
- Liem et al. (2017) Liem, F., Varoquaux, G., Kynast, J., Beyer, F., Masouleh, S. K., Huntenburg, J. M., Lampe, L., Rahim, M., Abraham, A., Craddock, R. C., et al., 2017. Predicting brain-age from multimodal imaging data captures cognitive impairment. NeuroImage 148, 179–188.
- Mann and Whitney (1947) Mann, H. B., Whitney, D. R., 1947. On a test of whether one of two random variables is stochastically larger than the other. The annals of mathematical statistics, 50–60.
- Marcus et al. (2007) Marcus, D. S., Wang, T. H., Parker, J., Csernansky, J. G., Morris, J. C., Buckner, R. L., 2007. Open access series of imaging studies (oasis): cross-sectional mri data in young, middle aged, nondemented, and demented older adults. Journal of cognitive neuroscience 19 (9), 1498–1507.
-
Nenadic et al. (2017)
Nenadic, I., Dietzek, M., Langbein, K., Sauer, H., Gaser, C., 2017. BrainAGE
score indicates accelerated brain aging in schizophrenia, but not bipolar
disorder. Psychiatry Res. Neuroimaging 266 (March), 86–89.
URL http://linkinghub.elsevier.com/retrieve/pii/S0925492717301002 - Pedregosa et al. (2011) Pedregosa, F., Varoquaux, G., Gramfort, A., Michel, V., Thirion, B., Grisel, O., Blondel, M., Prettenhofer, P., Weiss, R., Dubourg, V., Vanderplas, J., Passos, A., Cournapeau, D., Brucher, M., Perrot, M., Duchesnay, E., 2011. Scikit-learn: Machine learning in Python. Journal of Machine Learning Research 12, 2825–2830.
-
Potvin et al. (2017)
Potvin, O., Dieumegarde, L., Duchesne, S., 2017. Normative Morphometric Data
for Cerebral Cortical Areas Over the Lifetime of the Adult Human Brain.
Neuroimage.
URL http://linkinghub.elsevier.com/retrieve/pii/S1053811917304135 - Rasmussen and Williams (2005) Rasmussen, C. E., Williams, C. K. I., 2005. Gaussian Processes for Machine Learning (Adaptive Computation and Machine Learning). The MIT Press.
- Steffener et al. (2016) Steffener, J., Habeck, C., O’Shea, D., Razlighi, Q., Bherer, L., Stern, Y., 2016. Differences between chronological and brain age are related to education and self-reported physical activity. Neurobiology of aging 40, 138–144.
- Valizadeh et al. (2017) Valizadeh, S. A., Hanggi, J., Merillat, S., Jäncke, L., 2017. Age prediction on the basis of brain anatomical measures. Hum. Brain Mapp. 38 (2), 997–1008.
- Wachinger et al. (2015) Wachinger, C., Golland, P., Kremen, W., Fischl, B., Reuter, M., 2015. Brainprint: a discriminative characterization of brain morphology. NeuroImage 109, 232–248.
- Wachinger and Reuter (2016) Wachinger, C., Reuter, M., 2016. Domain adaptation for alzheimer’s disease diagnostics. Neuroimage 139, 470–479.
- Wachinger et al. (2016) Wachinger, C., Salat, D. H., Weiner, M., Reuter, M., 2016. Whole-brain analysis reveals increased neuroanatomical asymmetries in dementia for hippocampus and amygdala. Brain 139 (12), 3253–3266.
- Wang et al. (2014) Wang, J., Li, W., Miao, W., Dai, D., Hua, J., He, H., 2014. Age estimation using cortical surface pattern combining thickness with curvatures. Med. Biol. Eng. Comput. 52 (4), 331–341.
- Ziegler et al. (2012) Ziegler, G., Dahnke, R., Gaser, C., Initiative, A. D. N., et al., 2012. Models of the aging brain structure and individual decline. Frontiers in Neuroinformatics 6 (3).