-
Draft,
Experimental conditions to suppress edge localised modes by magnetic perturbations in the ASDEX Upgrade tokamak
Abstract
Access conditions for full suppression of Edge Localised Modes (ELMs) by Magnetic Perturbations (MP) in low density high confinement mode (H-mode) plasmas are studied in the ASDEX Upgrade tokamak. The main empirical requirements for full ELM suppression in our experiments are: 1. The poloidal spectrum of the MP must be aligned for best plasma response from weakly stable kink-modes, which amplify the perturbation, 2. The plasma edge density must be below a critical value, m-3. The edge collisionality is in the range (ions) and (electrons). However, our data does not show that the edge collisionality is the critical parameter that governs access to ELM suppression. 3. The pedestal pressure must be kept sufficiently low to avoid destabilisation of small ELMs. This requirement implies a systematic reduction of pedestal pressure of typically 30% compared to unmitigated ELMy H-mode in otherwise similar plasmas. 4. The edge safety factor lies within a certain window. Within the range probed so far, , one such window, has been identified. Within the range of plasma rotation encountered so far, no apparent threshold of plasma rotation for ELM suppression is found. This includes cases with large cross field electron flow in the entire pedestal region.
pacs:
28.52.–s, 52.55.Fa, 52.55.RkKeywords: ASDEX Upgrade, Edge Localised Modes, ELMs, ELM suppression, RMP, Resonant Magnetic Perturbation
1 Introduction
The transient heat load onto the first wall associated with the edge localised mode (ELM) instability is a main concern for the next step fusion device, ITER, and for a fusion reactor. Complete ELM suppression by small magnetic perturbations (MP) to the axisymmetric tokamak, first demonstrated in DIII-D [1], is one of the main methods considered for ITER to ensure an appropriate first wall lifetime and to prevent an excessive contamination of the plasma with heavy impurities produced by ELM-induced wall erosion [2] while maintaining the favourable properties of high confinement mode (H-mode). ELM suppression has been reproduced recently in KSTAR [3] and EAST [4], albeit at higher edge pedestal collisionality than in DIII-D and ITER.
ASDEX Upgrade (AUG) is equipped with two rows of MP coils, each with eight toroidally distributed in-vessel saddle coils [5]. They are capable of producing a peak MP field, measured at the plasma surface, of the order of , where T is the toroidal magnetic field in AUG. Independent MP coils power supplies for each MP coil [6] allow us to vary the poloidal structure of the MP field within a plasma discharge. This flexibility allows us to rotate MP fields with toroidal mode number rigidly for measurements of the plasma response [7, 8] and to vary the phase between the upper and lower coil ring (dubbed the “differential phase”) in order to vary the relative strength of resonant and non-resonant spectral modes [9].
With and magnetic perturbations, a significant reduction of the energy losses associated with individual ELMs (ELM mitigation) has been obtained at high [10] and low pedestal collisionality [11]. Attempts to fully suppress ELMs in stationary H-mode plasmas in AUG had long been unsuccessful. In a recent matching experiment of AUG and DIII-D [12], the plasma shape has been identified as a critical parameter. In plasmas with elevated upper triangularity, complete suppression of ELMs by magnetic perturbations has been observed for the first time in AUG [12, 13]. The decisive influence of plasma shaping has been attributed to higher pedestal pressure at elevated triangularity and hence, stronger amplification of the external MP by plasma response [12]. Apart from plasma shape, other experimental conditions appear to be crucial for attaining full suppression of ELMs. The initial success of ELM suppression in AUG enabled a recent study of access parameters, which is reported in this paper.
The paper is organised as follows: The experimental setup used to suppress ELMs in H-mode plasmas is described in section 2. The role of several parameters for accessing ELM suppression is studied in section 3, namely the resonant alignment of the MP, the choice of edge safety factor, plasma edge density and collisionality, and the role of plasma rotation. Finally (section 4), we discuss the implications of our results for ELM suppression models.
2 ELM suppression by magnetic perturbations
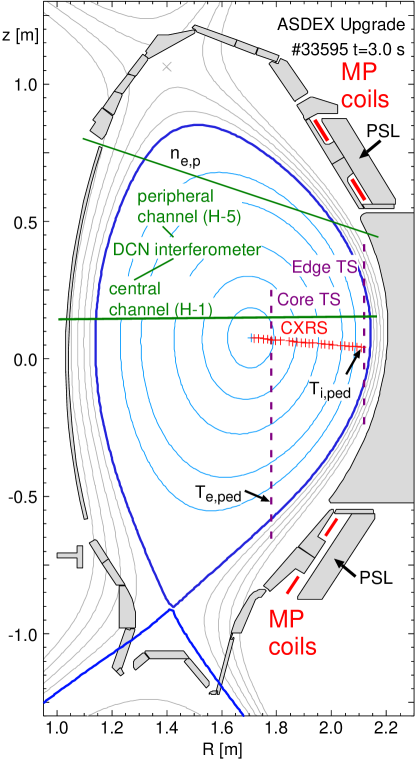
For the present experiment, the ELM suppression scenario described in Ref. [13] is used throughout, in particular the nominal plasma shape. Fig. 1 shows the cross section of a typical plasma, with the poloidal contours of in-vessel structures, MP coils and selected diagnostics sightlines. The two rows of MP saddle coils in AUG are located at the low field side, above and below midplane. They are mounted onto two massive copper conductors wired as an saddle loop, termed the Passive Stabilising Loop (PSL). The PSL serves to reduce the vertical growth rate of the elongated AUG plasma by induction of a radial field that counter-acts vertical plasma position excursions. Some of our experiments (see section 3.1) employ fast transients of MP coil currents. These transients induce eddy currents in the PSL conductor behind each individual MP coil that decay resistively and cause the evolution of the total vacuum field (from PSL plus MP coil) to lag behind the MP coil current. These eddy currents can significantly affect the amplitude and phase of the magnetic perturbation, as seen in section 3.1, and must be taken into account during MP coil transients. The total vacuum field including PSL response is calculated by a magnetodynamic finite element model as a function of frequency, from which a continuous complex transfer function is obtained [14]. Because of the proximity of the MP coil conductors and the PSL, compared to the distance to the plasma surface, we can express the shielding effect of the PSL as a lumped, effective coil current for which the vacuum field is calculated.
In the present study, we use full profiles with sufficient resolution in the H-mode pedestal region to represent gradients in the edge transport barrier - sightlines of some measurements are shown in Fig. 1. This includes edge and core Thomson scattering (electron density, and electron temperature ) using two different vertical laser beam lines and horizontal observation, and charge exchange recombination spectroscopy of boron () for ion temperature () and impurity toroidal rotation (v). Continuous time traces of edge and core electron density, electron temperature, ion temperature and toroidal impurity rotation are taken from a peripheral and a central DCN (deuterated cyanide) interferometer channel (H-5 and H-1 chords, respectively), core Thomson scattering observation channel 14 and core CXRS observation channel 24, as indicated in the figure. The edge interferometer H-5 chord is tangential at for this plasma shape and position, which is representative for the pedestal density in our discharges. Below, this measurement is denoted as .
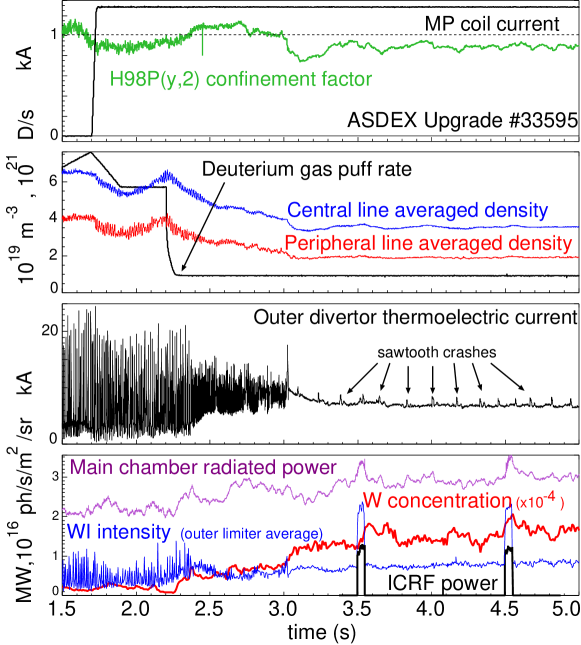
ELM suppression discharges are performed after boronisation of the vacuum vessel wall in order to obtain the lowest possible plasma density in H-mode. Time traces of discharge are shown in Fig. 2 as an example of long stationary ELM suppression. The startup is similar to conventional H-mode plasmas. However the MP coils are switched on at an early time ( s) in H-mode in order to reduce the ELM size. At s the gas puff rate is reduced to a very low level, D/s, which leads to a phase with increased ELM frequency and reduced ELM losses s, during which the central and peripheral plasma densities continuously decrease. This “pump-out” phenomenon due to the application of MP in low density plasmas is commonly observed in AUG and other experiments [15]. At s, ELM activity stops completely for the remainder of the H-mode flat top. The H-mode confinement factor [16] in the initial ELMy phase is and drops to at later times during the suppressed phase. Full suppression of ELMs is indicated by a large number of signals, e.g. the outer divertor thermoelectric current (third panel), which is a reliable indicator of divertor temperature and, therefore, ELM-related heat pulses. In the suppression phase, transient heat pulses from sawtooth crashes are observed; however, the magnetic measurements indicate that in most cases they do not trigger ELMs. It should be noted that in reference discharges without MP but otherwise identical plasma shape and actuator trajectories, the ELM frequency decreases and plasma density remains high after the gas puff is reduced.
As a special feature, AUG has a fully tungsten-clad first wall [17]. Stable H-mode operation with a metal wall requires net outward transport of heavy impurities to avoid radiative collapse of the plasma core [17], which is normally assisted by gas puffing in order to avoid density profile peaking and to ensure a sufficiently large ELM frequency. In AUG, ELM suppression can only be achieved without strong gas puff. Therefore, it is important to verify that impurity accumulation can be avoided in the absence of ELMs. Short pulses of power in the Ion Cyclotron Range of Frequencies (ICRF, see fourth panel of Fig. 2) are applied to inject tungsten impurities into discharge . Instead of using an optimum phase and power distribution between the straps of the newly installed 3-strap ICRF antennas [18] in order to minimise the induced radiofrequency (RF) currents in the antenna box and the associated RF sheaths, we deliberately apply the same phase to all of the three antenna straps (monopole phasing) to enhance the RF sheaths and to sputter tungsten from the antenna limiters. The resulting tungsten influx can be seen as an increased intensity of WI (neutral tungsten) spectroscopic lines. A small increase of tungsten concentration (higher charge states measured by an X-ray spectrometer) and main chamber radiated power follows and recovers to a steady state after about 200 ms, with a time constant slightly above the energy confinement time, . Hence, a particle transport mechanism is active which is not only causing the “pump-out” of main ions, but also flushes heavy impurities. This is consistent with the observation of outward transport of medium-Z impurities (fluorine) in DIII-D [19].
3 Access conditions to ELM suppression
3.1 Resonant magnetic perturbation
The relevance of the poloidal MP spectrum for access to ELM suppression can be tested by varying the relative phase of poloidally separated, toroidally equidistantly spaced MP coil sets, as has been done before using the two rows of 6 in-vessel saddle coil (I-coils) for perturbations in DIII-D [20]. The finite number of MP coils in the toroidal direction () leads to spatial aliasing, i.e. leakage of the applied MP pattern to . Apart from the sideband, the aliasing effect in AUG is a small modulation of the amplitude as the differential phase is varied.
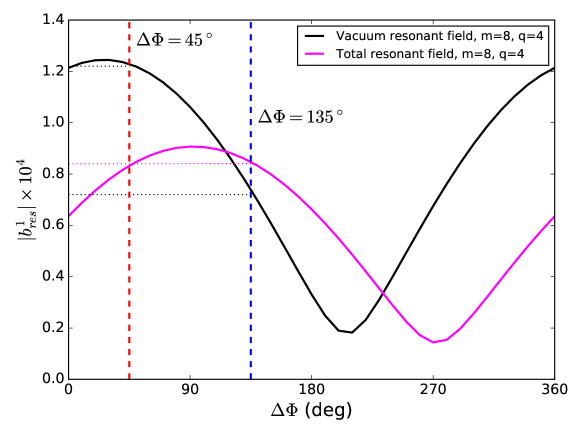
The effect of differential phase variation on the calculated resonant magnetic perturbation is demonstrated in Fig. 3. The , resonant radial magnetic field amplitude at the surface for fixed MP coil current amplitude, kA, normalised to the total magnetic field is shown as a function of the differential phase (defined in Ref. [21]). Two figures of merit are considered: a pure vacuum response (no helical plasma currents induced by the applied MP, black curve), and the resonant field including the plasma response, which is calculated using the linear resistive MARS-F fluid model [22] (magenta curve). The underlying MHD equilibrium is that of the ELM suppression scenario described in section 2. The maximum vacuum response () corresponds to alignment of the MP coil phasing with the plasma magnetic field. The plasma response to the vacuum field is two-fold in nature. Firstly, the resistive response to field-aligned MP is partially shielded by helical currents on resonant rational surfaces which are driven by flows perpendicular to the magnetic field [23]. Secondly, the MP is amplified by marginally stable ideal MHD modes, driven by the edge pressure gradient and edge current (which is dominated by the bootstrap current in the H-mode edge gradient region) [20]. Because of poloidal mode coupling due to toroidicity and vertical elongation of the torus, these modes produce a resonant response [22]. This can be seen in Fig. 3 particularly for , where the plasma-driven resonant response exceeds the unshielded vacuum response. It should be noted that while the magnitude of the plasma response depends sensitively on the pressure and edge current density profiles, the differential phase for optimum plasma response depends weakly on plasma pressure, as found in MARS-F calculations for a scan of using the ASDEX Upgrade arrangement of MP coils and an ASDEX Upgrade equilibrium as the base case [Ryan_PPCF59_2017_024005].
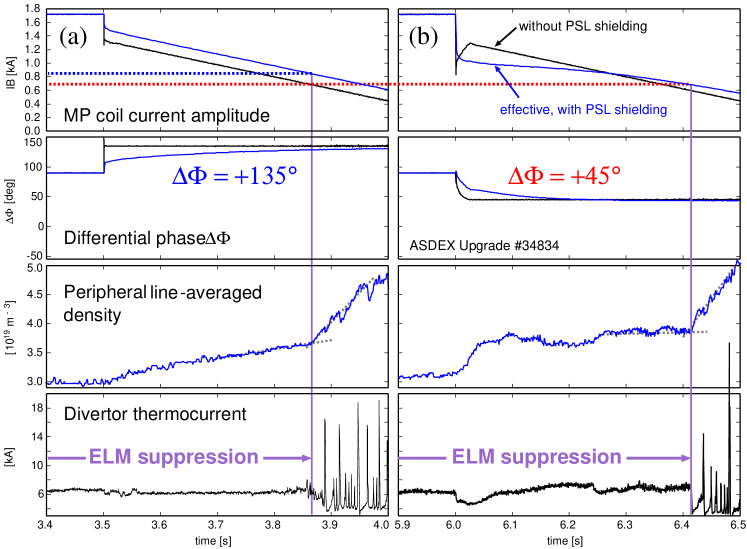
We consider two different cases for an experiment that highlights the importance of the plasma response: (a) and (b) , in which the calculated resonant vacuum field differs by about a factor of two (for the same effective MP coil current), while the MP field including plasma response is similar (see Fig. 3). If we assume that maintaining ELM suppression requires that the resonant field remains above a certain fixed threshold value, then the measured effective MP coil current thresholds for the two values of should be inversely proportional to one of the two calculated response curves in Fig. 3. Since the ratio of the response fields for these values differ significantly for the vacuum-only and total resonant response models, our experiment can discriminate between the two models. Fig. 4 shows time traces of the two cases, which are examined in different time intervals in discharge 34834. In each case, reproducible initial conditions are set by a preceding phase with optimum plasma response and maximum MP coil current. This results in an initially stationary ELM suppression phase with low plasma density, m-3, in order to obtain a similar plasma response in both cases. The MP coil current phasing is then switched to the value for the respective case and the MP coil current amplitude is slowly ramped down to measure the threshold for losing ELM suppression. The upper two panels of Fig. 4 show the spatial amplitude and phase, as obtained from actual MP coil currents (black time traces) and derived from effective MP coil currents that take into account the shielding by the PSL (blue time traces). One can clearly see that the presence of the PSL currents affects both amplitude and differential phase of the MP field, therefore the effective MP coil current must be used for this comparison.
Loss of ELM suppression is detected by a reversal to a classical ELM-free phase, characterised by a rapid increase of plasma density, followed by large ELM activity. Just before ELM suppression is lost (at the times denoted by vertical magenta lines), the plasma density (third panel in Fig. 4) has increased compared to the begin of the coil current ramp, but is similar in the two cases. For cases (a) and (b), with similar total (vacuum plus plasma) response, the effective MP coil current amplitude threshold is similar, A and A, respectively, while the resonant (field-aligned) vacuum field (Fig. 3) differs by a factor of two. This comparison shows that the plasma response, i.e. coupling of the applied MP field to amplifying ideal MHD modes, is essential to maintain ELM suppression.
3.2 Low edge density and collisionality
It can be noted from discharge 33595 (shown in Fig. 2) that the application of the MP at s with correct phasing is a necessary, but not sufficient condition for ELM suppression, as ELM activity continues until s. After the gas puff is reduced to a minimum, small ELMs are encountered. The plasma density in this phase slowly decreases, until the ELM activity ceases. Therefore, the suppression of ELMs appears to depend on achieving a low plasma density in H-mode. Right after the transition to ELM suppression (at s in Fig. 2) the density drops further and then levels at a stationary low value for the entire ELM suppression time interval. Hence, the outward particle transport induced by the MP (the “pump-out”) increases during ELM suppression compared to the previous ELM mitigation phase.
In an attempt to identify the physically relevant edge parameter for access to ELM suppression, we can examine the data base of ELM suppression experiments carried out in AUG so far. This comprises a total of 191 time slices from 44 discharges which all have the same nominal plasma shape and T. The plasma current is varied between and MA with MA in most cases, and the plasmas are heated with MW neutral beam injection (NBI) power and up to MW central third harmonic electron cyclotron resonance heating (ECRH) power. Fig. 5 shows the neoclassical pedestal collisionality of ions (left) and electrons (right), as defined in Refs. [24] (Eq. 18) and [25] (Eq. 1), plotted against the peripheral line-averaged density . All cases shown in the figure use , which corresponds to optimal MP alignment at MA.
Three data sets are included: ELM suppression (magenta circles), mitigated ELMs with MP (blue triangles) and one reference case (red square) without MP but same low fuelling rate, showing higher plasma density and unmitigated, large ELMs. Only time intervals with stationary plasma parameters, averaged over ms or longer are considered. All ELM suppression cases are bounded by m-3 and and . The variation of and at fixed is mainly due to variations of the ion and electron pedestal temperature, and , respectively.
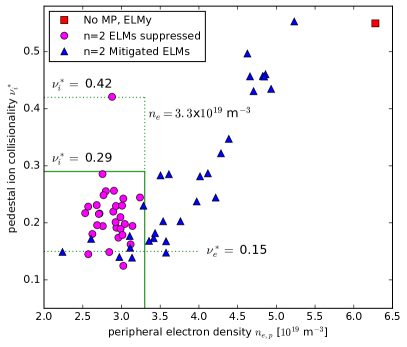
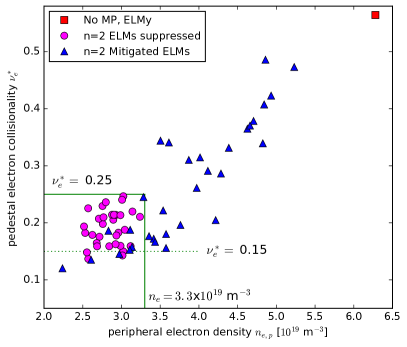
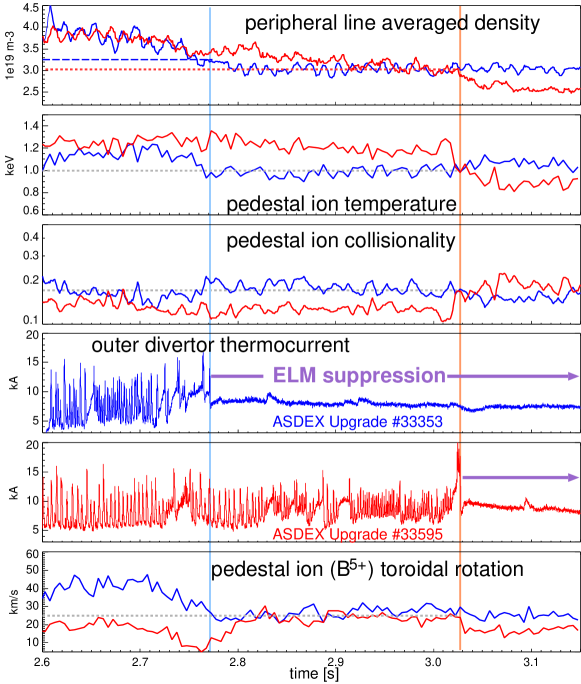
Two observations can be made from Fig. 5. Firstly, there are no cases with ELMs at m-3 but collisionality larger than those with ELM suppression. Therefore, we cannot conclude from our data whether there is an upper collisionality limit. Secondly, for m-3 small ELM activity is still found at low , i.e. at high and high . This finding points to an upper pedestal temperature limit for ELM suppression. We therefore examine in more detail two discharges, 33353 with early ELM suppression (at s) and 33595, where ELM suppression is delayed to s despite reaching low early. Fig. 6 shows time traces for these two pulses (33353: blue lines, 33595: red lines). All plasma control request waveforms for the two shots are identical. Plasma parameters at the transition to ELM suppression are marked with dashed lines. The main difference between the shots is that in 33595, keV in the extended ELMy phase ( s), well above keV in 33353 (second panel from top). This is consistent with an upper bound of for ELM suppression. The peripheral density (top panel) and plasma rotation (measured is the boron, , impurity rotation, bottom panel) are identical at the time of the transition to ELM suppression, hence these quantities cannot explain the delayed transition in shot 33595. We will discuss a possible reason for this behaviour in section 4.
3.3 Edge safety factor
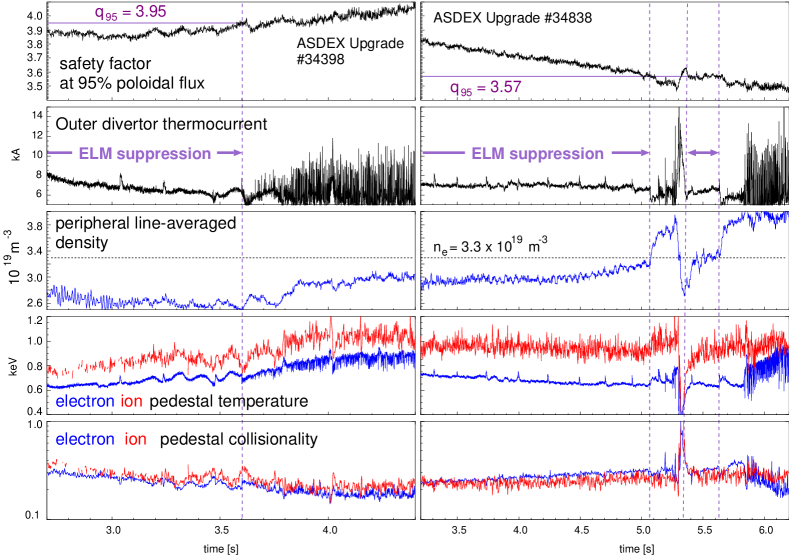
The existence of safety factor windows for access to ELM suppression has been reported for DIII-D with [26, 27] and [20] MP. First experiments are aimed to explore whether similar restrictions exist in AUG. The safety factor is varied by slow ramps of the plasma current, with poloidal field coils ramped accordingly to preserve the plasma shape and plasma volume. The pulses are started up similarly to the case shown in Fig. 2 to enter ELM suppression early, followed by the ramp until ELM suppression is lost. Time traces of two of these discharges are shown in Fig. 7, where transitions to and from ELM suppression are indicated by vertical dashed lines. In shot 34398, the plasma current is ramped down and ELM suppression is lost as is reached. In shot 34838, a lower limit is encountered at . While ELM suppression is maintained, the peripheral density (third panel from top) and ion collisionality (bottom panel) remain below m-3 and , respectively, well in the parameter range for ELM suppression. The loss of ELM suppression is detected as a sharp drop of divertor thermocurrent. Pedestal parameters change afterwards, in response to the loss of ELM suppression. We therefore conclude that the variation is causal for the back transition and that an access window for ELM suppression in AUG exists for . More windows above and below the probed range may exist, but they still need to be explored experimentally.
It has been speculated that the reason for the occurrence of windows is the need for resonant surfaces to be placed at certain radial positions near the pedestal top in order to avoid the expansion of the H-mode edge gradient region towards destabilisation of ELMs [28]. From this viewpoint, it is interesting to compare the access window in AUG with those reported for DIII-D. Width and central values for access windows with MP in DIII-D depend on the differential phase , i.e. the relative strength of the plasma response [20]. For and optimum , a window centered at was found in DIII-D [20], which can be compared with the center value of in AUG.
It is instructive to also consider the corresponding window documented for DIII-D [27], . Because of the different fractional resonant surfaces (AUG: , DIII-D: , where : integer), the similarity of the upper limit in both machines suggests that it corresponds to the position of an integer and not a non-integer rational surface. The integer surface next to the top of the gradient region is, in both cases, the surface. The next lower resonant surface ( in AUG, in DIII-D) will take this same position at in AUG and in DIII-D, which should therefore represent the upper bound of the next ELM suppression access window. For DIII-D, this matches the experimental value of reported in Ref. [27]. For AUG, there is no such reference as no safety factor scan at lower has been made to date. A more direct comparison would be comparing different values in the same machine, however, ELM suppression has not been observed with MP in AUG to date.
3.4 Plasma rotation

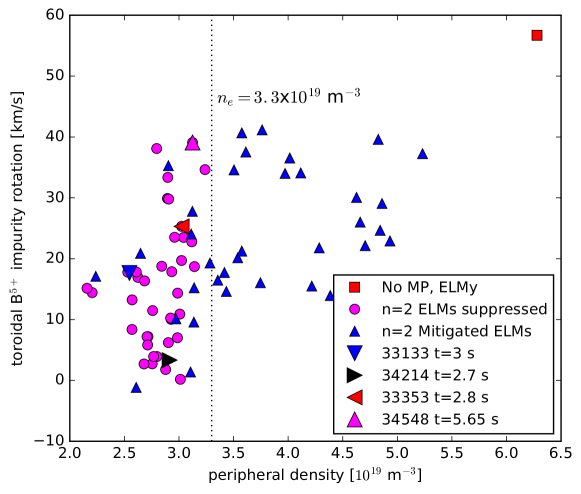
A recent study [29] showed that access to ELM suppression in DIII-D depends on the torque applied to the plasma by neutral beam injection, leading to a threshold in plasma rotation. For small flows or flows directed in counter-current direction, ELM suppression could not be obtained. Depending on the underlying physics reason, this is a potential issue for ITER and a fusion reactor where small plasma rotation is expected in the absence of strong external momentum sources. Significant variation of plasma rotation is encountered in ELM suppression discharges in our present experiment. Fig. 8 shows the toroidal rotation velocity of boron () impurities, measured by a charge exchange recombination spectroscopy (CXRS) sightline which intersects one of the heating neutral beams at normalised poloidal flux , i.e. on the pedestal top, for the plasma shape used in these experiments. The data set of Fig. 5 is used, with the same symbol and colour coding, but without restrictions for in order to represent our full set of ELM suppression cases. Again, only time intervals stationary for at least ms are shown. One can see that ELM suppression is observed in a large range of impurity velocities, v km/s and that no separation in rotation velocity between ELM suppression and ELM mitigation is visible in the toroidal rotation velocity range covered in our experiments so far.
In Fig. 8, four ELM suppression cases (triangles with different orientations and colours) are marked up with their shot numbers and times of interest. The toroidal impurity rotation for these cases is different, and we will study them in more detail subsequently. Time traces for three of these four cases are shown in Fig. 9. The full duration of the ELM suppressed state in each discharge is indicated by horizontal arrows labelled “ELM suppression”. The transition to ELM suppression occurs at different values of the toroidal impurity rotation and is dictated by the time the plasma density drops below m-3. However, the plasma rotation drops somewhat after this transition in shots and where it was initially high, indicating a stronger braking torque during ELM suppression than during ELM mitigation.
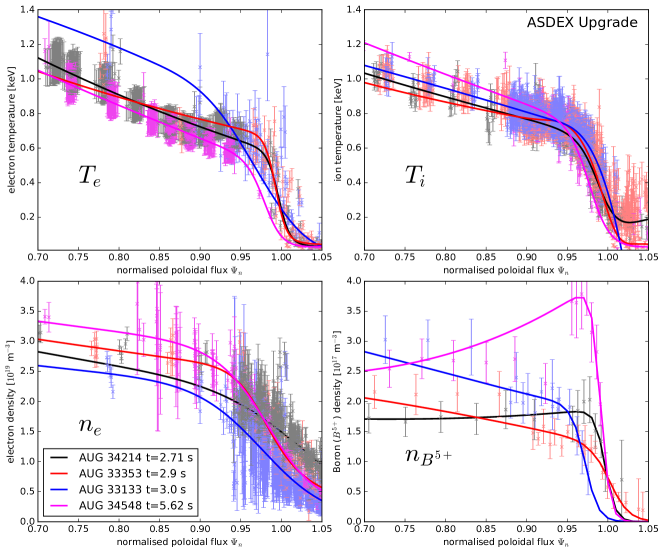
For further analysis, we pick one time interval in each of these discharges during fully established ELM suppression. They are indicated by vertical shaded areas in Fig. 9, which are coloured similarly to the measured curves of each discharge. A fourth time interval is taken during a long stationary ELM suppression phase in pulse around s. Fig. 10 shows profiles of , , and (density of fully stripped boron impurity ions) in the edge pedestal region, originating from core and edge Thomson scattering (, ), core and edge CXRS on boron impurities (, ), and Li beam (). Hyperbolic tangent fits to this data are shown as solid lines. Fits to the density are constrained by the DCN interferometer line integrals in addition to radially resolved profiles. The edge gradient and the pedestal top regions are well resolved by these measurements so that electron and ion diamagnetic velocity profiles can be determined. There is little variation of , and gradients of these quantities. Boron is the prevalent light impurity species and occurs with about 1% or lower concentration. The impurity density shows a clear pedestal and a steep gradient at .
We will now examine these four cases in view of a recent model for ELM suppression [28] which invokes an unshielded resonant response to the MP to block the expansion of the edge transport barrier before an ELM crash can occur. In various linear two-fluid MHD calculations [30, 31], the cross-field electron flow ve,⟂ has been identified to control the shielding of the external MP at rational surfaces.
In AUG, impurity ion flows are measured in toroidal (vα,t) and poloidal (vα,p) directions by charge exchange recombination spectroscopy [33]. The index denotes the impurity species used, fully stripped boron () with charge state in the present experiment. We obtain ve,⟂ from the combined radial force balances of electrons and impurity ions [34],
| (1) |
where is the elementary charge; , , and are the toroidal, poloidal and total magnetic inductance, respectively. and are the electron and impurity diamagnetic flows, respectively, and the last two terms represent the cross field impurity flow. Often the terms of the force balance are expressed as angular frequencies , with the advantage that most of them become flux functions and can more easily be compared with numerical code output. Eq. 1 then becomes
| (2) |
where now the derivative is with respect to the poloidal flux ( in Vs/rad). Here, , , and are flux functions, while and are not flux functions individually.
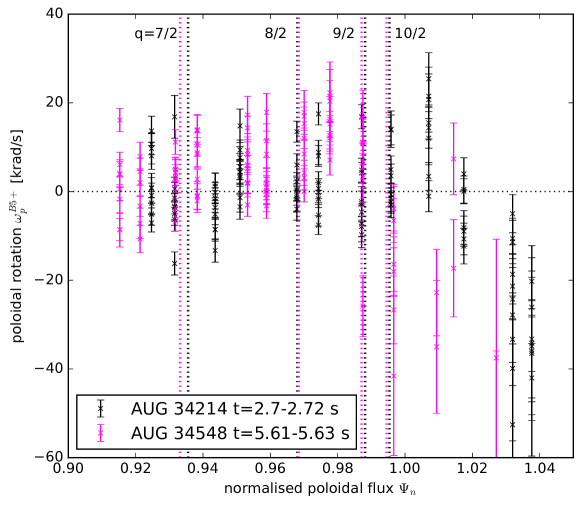
Several observations can be made in the course of the analysis. In Eq. 2, the poloidal impurity flow vα,p is weighted stronger by a factor than vα,t and hence the errors of typically dominate the errors in the cross field impurity flow. Fig. 11 shows the measured impurity poloidal rotation for two cases, pulse 34214 in the time interval s and pulse 34548 at s. All measurements in these time intervals are overlayed and show significant scatter. On the pedestal top, the averaged poloidal rotation essentially vanishes within the scatter of the data and can become significant only in the gradient region and scrape-off-layer, . Neglecting in Eq. 2 greatly reduces the uncertainty of the result, and constitutes an upper bound of .
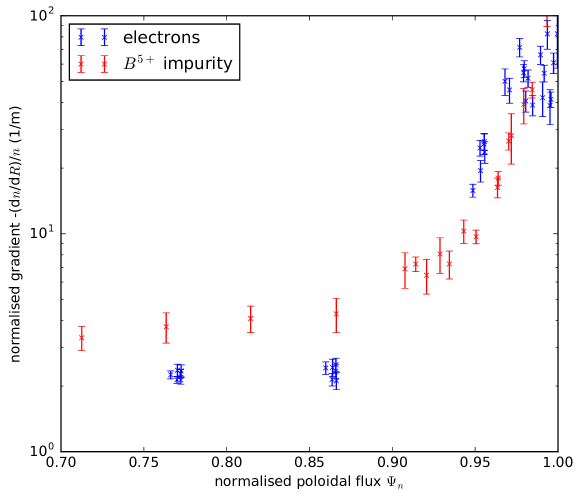
The impurity diamagnetic term in Eq. 1 can be written as , i.e. there is no dependence on the absolute impurity density, but only on the impurity density gradient length . Furthermore, for similar density gradient length and temperature of impurity ions and electrons, the impurity diamagnetic flow is smaller by a factor of (for boron as in our case) than the electron diamagnetic flow. The density gradient length for impurity ions and electrons is often very similar at the pedestal top. Fig. 12 shows the case with the most peaked impurity density profile at the pedestal top among our set of four highlighted discharges, pulse 33353 at s. The edge transport barrier at is well seen in both species. At the pedestal top, the contribution of the density gradient length term in the impurity ion diamagnetic flow to Eq. 1 is about /m eVT m/s, which is small compared to the electron diamagnetic flow. The accuracy of ve,⟂ is therefore mainly determined by the errors of the electron diamagnetic and the impurity cross-field flows.
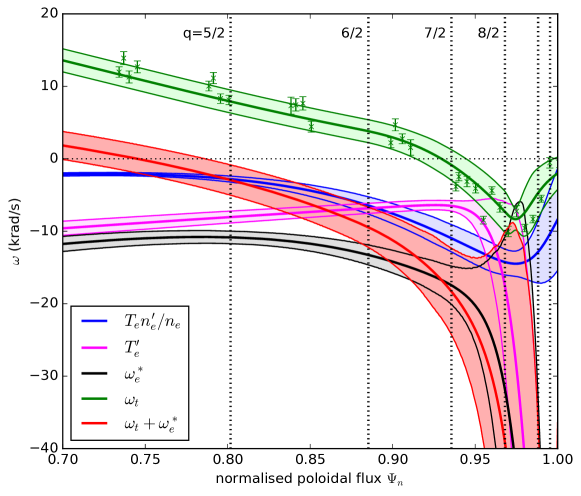
We inspect now the dominant terms in the radial force balance, Eq. 2, for one example, pulse 34214 at s. Fig. 13 shows angular frequencies of the electron diamagnetic rotation (black curve), its components (blue curve) and (magenta curve), the toroidal rotation (green curve) along with the original measurement (green symbols) and the sum of and (red curve). Least squares fits to the original diagnostic data are applied in order to calculate the rotation angular frequencies on a common dense grid of . The coloured bands represent propagated experimental errors, profile fit errors and errors of the radial alignment between the various diagnostics. While (green) changes sign near the pedestal top, and in this case remains small in the entire pedestal region, is strictly in the electron diamagnetic (negative) direction. Their sum and corresponds to as given by the force balance Eq. 2, but without (small or negative, Fig. 11) and without (small). In this example, (red) crosses zero at and is negative (outside error bars) for , i.e. in the entire pedestal top and gradient regions. This includes the locations of the and surfaces, which are near the upper end of the gradient region and therefore are candidates for a resistive plasma response to the MP.
For our four cases of interest, we now evaluate the full force balance, Eq. 2, including and . In order to avoid the errors associated with the measurement, we use the neoclassical estimate for from the NEOART code [35, 36]. In a previous study of H-mode plasmas in AUG [37], which included low H-mode pedestal collisionalities (), good agreement was found between measured and neoclassical poloidal rotation. For our present discharges we find that the neoclassical calculation tends to slightly underestimate (predict more negative values than measured) on the pedestal top. Fig. 14 shows the measured pedestal rotation profiles of the impurities () in toroidal direction (left panel, with experimental errors), the gyrocentres (middle panel) and the cross field flow of the electron fluid (right panel). Solid curves in the middle and right panel represent the values obtained using the full force balance, Eq. 2, including neoclassical . Dashed curves are calculations with assumed to be zero, which represents an upper bound of and , as discussed above. The rotation (middle panel) changes sign at the plasma edge in all our cases, because with co-injected neutral beams as used in all our present discharges, (ion diamagnetic direction) in the core, while in the edge gradient region (), poloidal and diamagnetic flows always drive a strong inward directed radial electric field, . The precise position of depends crucially on the actual errors of the analysis, in particular the precision of . At the present time we cannot determine whether or not is aligned with rational surfaces or not.
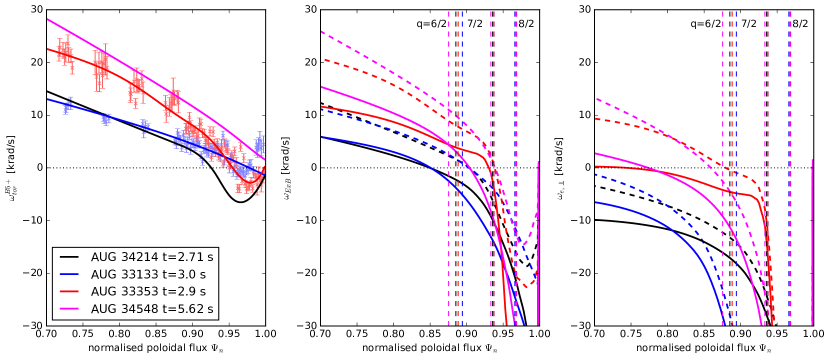
Because of a significant electron diamagnetic rotation , is clearly offset from . As shown in the right panel of Fig. 14, the electron perpendicular rotation has zero crossings for two of our four selected cases and no zero crossings for the other two, independent of whether is neglected or taken from the neoclassical calculation. Again, it should be noted that for our present discharges this choice corresponds approximately to an upper or lower bound for the true value of , respectively. At the and resonant surfaces, i.e. near the inner end of the edge gradient region, becomes large for all our cases. We compare this result with shielding calculations and discuss the implications of our findings in the next section (section 4).
4 Summary and Discussion
In many respects, the ELM suppression regime in ASDEX Upgrade at low pedestal collisionality resembles that of the original DIII-D discovery: ELMs are suppressed after a sharp transition encountered normally from phases with ELMs, which are typically mitigated already by the MP. The mode number spectrum of the MP in both machines matters in that optimum coupling to amplifying edge pedestal-driven kink-peeling modes is essential for ELM suppression access. During ELM suppression phases, significant particle transport across the H-mode edge transport barrier occurs, and the plasma density with identical fuelling is usually below that of ELMy phases, despite the absence of ELMs and ELM-related particle losses. Plasma density and stored energy are stationary for many confinement times, if the MP is continuously applied and sufficiently strong to keep the plasma density below a limit which is very similar in AUG and DIII-D. This upper density limit for ELM suppression can be expressed by a maximum value near m-3 of pedestal top plasma density or as a maximum pedestal collisionality near . Since AUG and DIII-D have about the same physical size, it is not possible to identify which density-related dimensionless parameter describes the actual physical requirement for achieving ELM suppression. Finally, within the range of edge safety factor examined so far in AUG, one window for ELM suppression has been detected that seems to have a clear corresponding window in DIII-D, despite different plasma shapes. The access window width for our experiment with MP is wider than the corresponding window’s width of DIII-D (), as expected for the sparser radial distribution of resonant surfaces (half integer instead of third integer ). These observations are consistent with the assumption that the location of resonant surfaces and therefore a resistive response play an important role for ELM suppression.
However, there is an apparent insensitivity to plasma rotation variations and therefore, varying conditions for shielding of a resistive response. We observe ELM suppression in cases where the pedestal top impurity rotation is very small as expected for a burning plasma without external momentum input, and consequently the electron cross-field flow is large. In the DIII-D experiment [29], input torque variations around zero net torque have been produced by a mixture of co- and counter- NBI, which is not possible in AUG. All our plasma have been heated with co- directed NBI and the variation of plasma rotation originates mainly from plasma density and MP field strength variations. Despite this technical limitation, impurity rotation varies widely in AUG, v km/s, and as shown in section 3.4, there is a concomitant strong variation of .
This rotation variation can be compared with the cross-field electron flow required for shielding the resistive response in linear MHD model predictions. For ELM suppression plasmas in AUG and DIII-D several such calculations have been made [38, 39, 40]. Single-fluid MARS-F calculations for the AUG experimental case [39] show that a fairly small cross-field flow, of the order of krad/s, is required to obtain a significant resistive response at a resonant surface. A similar study has been carried out for DIII-D equilibria, using a two-fluid MHD model implemented in the M3D-C1 code [40]. This study shows that the resonant response for a single row of MP coils in DIII-D as a function of electron cross-field rotation is strongly peaked, with a half width of krad/s around maximum response (section 3.1 in Ref. [40]). In this respect, this result agrees with that of Ref. [39]. However, the maximum response is found to not coincide exactly with zero flow at the resonant surface location, but is slightly skewed in radius to either side of the resonance, depending on whether the upper or lower MP coil ring is considered. The authors of Ref. [40] do not give an explanation for this effect in their modelling. We do not have the same two-fluid analysis for AUG, but we can inspect our experimental data presented in section 3.4 whether the electron cross-field flow is small, krad/s, in the vicinity of resonant surfaces in the edge pedestal region, even if not exactly aligned with a surface. This is true for none of the cases of Fig. 14 at the surface, and for shots 34214 and 33133 there is no region at the pedestal for which krad/s.
If a resistive response is important for ELM suppression at all, it is difficult to understand our observations from the viewpoint of a linear MHD description of the plasma response. Kinetic modelling [41] suggests that guiding center orbit resonances at (for stationary or slowly varying MP) play a role for field penetration and particle transport. In our present experiments, a surface with exists because of co-current (positive) rotation in the core and the inward directed well, i.e. negative , in the H-mode barrier. Consequently, in the vicinity of the inner boundary of the gradient region. It is a remaining task to develop and apply kinetic models to AUG ELM suppression experiments and explore the sensitivity of ELM suppression to the location.
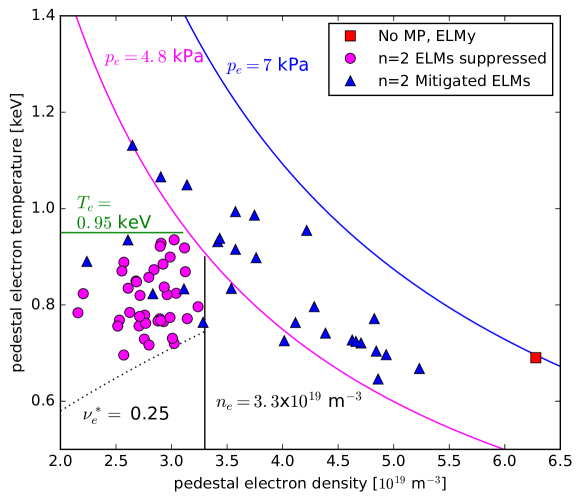
A surprising finding in AUG is the lack of ELM suppression at ITER-relevant low edge pedestal collisionality , despite sufficiently low density for ELM suppression. This can be attributed to a high pedestal temperature (section 3.2). Another view emerges if one examines the locus of ELM suppression and ELM mitigation in edge pedestal temperature-density space, also referred to as the H-mode edge operational diagram [42]. Fig. 15 shows electron parameters, vs. , for the AUG ELM suppression data set together with an annotation of empirical regime boundaries. Only cases with , i.e. within the safety factor access window, and with the same nominal plasma shape are selected. The cases of returning small ELMs at low collisionality () appear above a temperature threshold, keV (green line). They are also close to a line of constant pedestal electron pressure (magenta line) at kPa which is bounding the actual ELM suppression cases, and which is decorated by most ELM mitigation cases at higher density and lower temperature. We can therefore hypothesise that the return of ELMs at low collisionality is due to the pedestal reaching a stability limit for triggering small ELMs with applied MP. This stability limit is considerably reduced compared to ELMy H-mode without MP. As a reference without MP, our case with lowest edge density (red square) has considerably larger edge pressure, Pa (blue curve). Therefore, and in addition to the density reduction by the “pump-out” effect, a reduction of pedestal pressure appears as an additional price for ELM mitigation or ELM suppression despite access to higher pedestal temperature at low density. As H-mode confinement depends largely on pedestal properties, it is of high interest for the fusion performance of ITER and future fusion devices to examine the reason for the observed pedestal pressure reduction and devise ways to minimise it.
A possible reason for the reduced edge stability with MP applied has been pointed out in a recent study of toroidally localised inter-ELM oscillations in AUG with applied MP [43]. The MP causes toroidal variations of the local magnetic shear which destabilise ballooning modes in a toroidally restricted region, for field lines where, experimentally, the inter-ELM oscillation is observed. It can therefore be expected that the maximum stable edge pressure gradient is reduced when the MP is applied. The situation is complicated by the fact that for low collisionalities, such as in our cases near ELM suppression, a strong bootstrap current exists in the gradient region, which leads to destabilisation of medium- edge peeling modes that couple with infinite- ballooning modes [44]. Linear [39] and non-linear [32, 45] MHD models have so far been mainly used to predict the plasma response to the applied low- MP, with quantitative success to describe the plasma edge displacement in AUG [8]. Wingen et al [46] find for selected DIII-D cases that at low pedestal collisionality the increased H-mode edge bootstrap current leads to both larger helical plasma deformation and stronger destabilisation of peeling-ballooning modes than at high collisionality. That would suggest a reduced stability limit at high edge temperature and possibly explain the re-appearance of small ELMs. This question can be addressed in the future by edge stability calculations for a 3D equilibrium against a wide range of modes, such as coupled peeling-ballooning modes, and quantitative comparisons with empirical edge stability limits in AUG.
From Fig. 15, we note that, with the exception of a few cases of mitigated ELMs at very low pressure, all ELM suppression cases seem to be grouped below the pedestal pressure associated with mitigated ELMs. This suggests that lifting the small ELM pressure gradient may lead to an extension of the edge operational range for ELM suppression access. Edge stability can be improved by stronger shaping of the plasma cross-section which allows to maintain larger pressure gradient and pedestal pressure without triggering ELMs. As an additional benefit, increased pressure gradient and bootstrap current may increase the drive for amplification of the externally applied MP by marginally stable low- peeling modes, and hence reduce the MP coil current threshold for ELM suppression. We can speculate that the required increased triangularity in AUG to achieve ELM suppression [12, 13] is caused by a combination of these two factors.
A few observations in Fig. 15 remain unexplained so far. The existence of an upper density (black solid curve) or collisionality (black dotted curve) limit (shown is the locus of which bounds our data) cannot be explained solely by a pressure-driven stability argument. The small temperature variation near this boundary in our present data also does not allow us to distinguish conclusively between these two parameters (or a possible third, density-related, parameter). Variation of by seeding with low- impurities such as nitrogen, and variation of the major radius , i.e. comparison of plasmas in machines with different size, would probably be most effective to test a collisionality boundary. The other observation is the re-appearance of very small ELMs at low edge pedestal pressure in a few cases (blue triangles well below the magenta line in Fig. 15), which can take the form of sharp, seemingly unmotivated, transitions out of suppression. So far no parameter has been identified in our data set that triggers these transitions. This question requires more attention in upcoming experiments in AUG.
Acknowledgments
W.S. and E.V. thank R. Dux for valuable discussions. This work has been carried out within the framework of the EUROfusion Consortium and has received funding from the Euratom research and training programme 2014-2018 under grant agreement No 633053. The views and opinions expressed herein do not necessarily reflect those of the European Commission.
References
References
- [1] T. E. Evans, R. A. Moyer, P. R. Thomas, J. G. Watkins, T. H. Osborne, J. A. Boedo, E. J. Doyle, M. E. Fenstermacher, K. H. Finken, R. J. Groebner, M. Groth, J. H. Harris, R. J. La Haye, C. J. Lasnier, S. Masuzaki, N. Ohyabu, D. G. Pretty, T. L. Rhodes, H. Reimerdes, D. L. Rudakov, M. J. Schaffer, G. Wang, and L. Zeng. Suppression of large edge-localized modes in high-confinement DIII-D plasmas with a stochastic magnetic boundary. Phys. Rev. Lett., 92(23):235003–1–235003–4, 2004.
- [2] A. Loarte, G. Huijsmans, S. Futatani, L.R. Baylor, T.E. Evans, D. M. Orlov, O. Schmitz, M. Bécoulet, P. Cahyna, Y. Gribov, A. Kavin, A. Sashala Naik, D.J. Campbell, T. Casper, E. Daly, H. Frerichs, A. Kischner, R. Laengner, S. Lisgo, R.A. Pitts, G. Saibene, and A. Wingen. Progress on the application of ELM control schemes to ITER scenarios from the non-active phase to DT operation. Nuclear Fusion, 54(3):033007, 2014.
- [3] Y. M. Jeon, J.-K. Park, S. W. Yoon, W. H. Ko, S. G. Lee, K. D. Lee, G. S. Yun, Y. U. Nam, W. C. Kim, Jong-Gu Kwak, K. S. Lee, H. K. Kim, and H. L. Yang. Suppression of edge localized modes in high-confinement KSTAR plasmas by nonaxisymmetric magnetic perturbations. Phys. Rev. Lett., 109:035004, Jul 2012.
- [4] Y. Sun, Y. Liang, Y. Q. Liu, S. Gu, X. Yang, W. Guo, T. Shi, M. Jia, L. Wang, B. Lyu, C. Zhou, A. Liu, Q. Zang, H. Liu, N. Chu, H. H. Wang, T. Zhang, J. Qian, L. Xu, K. He, D. Chen, B. Shen, X. Gong, X. Ji, S. Wang, M. Qi, Y. Song, Q. Yuan, Z. Sheng, G. Gao, P. Fu, and B. Wan. Nonlinear transition from mitigation to suppression of the edge localized mode with resonant magnetic perturbations in the EAST tokamak. Phys. Rev. Lett., 117:115001, Sep 2016.
- [5] W. Suttrop, O. Gruber, S. Günter, D. Hahn, A. Herrmann, M. Rott, T. Vierle, U. Seidel, M. Sempf, B. Streibl, E. Strumberger, D. Yadikin, O. Neubauer, B. Unterberg, E. Gaio, V. Toigo, P. Brunsell, and ASDEX Upgrade Team. In-vessel saddle coils for mhd control in ASDEX Upgrade. Fusion Engineering and Design, 84(2-6):290–294, 2009.
- [6] Markus Teschke, Nils Arden, Horst Eixenberger, Michael Rott, and Wolfgang Suttrop. Electrical design of the BUSSARD inverter system for ASDEX Upgrade saddle coils. Fusion Engineering and Design, 96-97(Supplement C):171 – 176, 2015. Proceedings of the 28th Symposium On Fusion Technology (SOFT-28).
- [7] M Willensdorfer, S S Denk, E Strumberger, W Suttrop, B Vanovac, D Brida, M Cavedon, I Classen, M Dunne, S Fietz, R Fischer, A Kirk, F M Laggner, Y Q Liu, T Odstrčil, D A Ryan, E Viezzer, H Zohm, I C Luhmann, the ASDEX Upgrade Team, and the EUROfusion MST1 Team. Plasma response measurements of external magnetic perturbations using electron cyclotron emission and comparisons to 3D ideal MHD equilibrium. Plasma Physics and Controlled Fusion, 58(11):114004, 2016.
- [8] M. Willensdorfer, E. Strumberger, W. Suttrop, M. Dunne, R. Fischer, G. Birkenmeier, D. Brida, M. Cavedon, S.S. Denk, V. Igochine, L. Giannone, A. Kirk, J. Kirschner, A. Medvedeva, T. Odstrčil, D.A. Ryan, the ASDEX Upgrade Team, and the EUROfusion MST1 Team. Three dimensional boundary displacement due to stable ideal kink modes excited by external n = 2 magnetic perturbations. Nuclear Fusion, 57(11):116047, 2017.
- [9] W. Suttrop, J.C. Fuchs, R. Fischer, L. Giannone, A. Herrmann, R.M. McDermott, M. Maraschek, A. Mlynek, and H.W. M\̇lx@bibnewblockMitigation of edge localised modes with magnetic perturbations in asdex upgrade. Fusion Engineering and Design, 88(6):446 – 453, 2013. Proceedings of the 27th Symposium On Fusion Technology (SOFT-27); Liège, Belgium, September 24-28, 2012.
- [10] W. Suttrop, T. Eich, J. C. Fuchs, S. Günter, A. Janzer, A. Herrmann, A. Kallenbach, P. T. Lang, T. Lunt, M. Maraschek, R. M. McDermott, A. Mlynek, T. Pütterich, M. Rott, T. Vierle, E. Wolfrum, Q. Yu, I. Zammuto, H. Zohm, and ASDEX Upgrade Team. First observation of edge localized modes mitigation with resonant and nonresonant magnetic perturbations in ASDEX Upgrade. Phys. Rev. Lett., 106(22):225004, Jun 2011.
- [11] A. Kirk et al. Effect of resonant magnetic perturbations on low collisionality discharges in MAST and a comparison with ASDEX Upgrade. Nuclear Fusion, 55(4):043011, 2015.
- [12] R. Nazikian, W. Suttrop, A. Kirk, M Cavedon, T.E. Evans, B. Grierson, A. Hyatt, M. Knolker, Y. Q. Liu, B. Lyons, McDermott R. M., C. Paz-Soldan, D. Orlov, T. H. Osborne, D. A. Ryan, E. Viezzer, Z. Wang, M. Willensdorfer, and A. Wingen. First observation of ELM suppression by magnetic perturbations in ASDEX Upgrade and comparison to DIII-D matched-shape plasmas. 26th IAEA Int. Conf. on Fusion Energy (Kyoto, Japan, 2016), post-deadline paper.
- [13] W Suttrop, A Kirk, R Nazikian, N Leuthold, E Strumberger, M Willensdorfer, M Cavedon, M Dunne, R Fischer, S Fietz, J C Fuchs, Y Q Liu, R M McDermott, F Orain, D A Ryan, E Viezzer, The ASDEX Upgrade Team, The DIII-D Team, and The Eurofusion MST1 Team. Experimental studies of high-confinement mode plasma response to non-axisymmetric magnetic perturbations in ASDEX Upgrade. Plasma Physics and Controlled Fusion, 59(1):014049, 2017.
- [14] W. Suttrop, D. Hahn, J. Hartmann, A. Herrmann, M. Rott, B. Streibl, W. Treutterer, T. Vierle, D. Yadikin, I. Zammuto, E. Gaio, V. Toigo, P. Brunsell, E. Olofsson, and ASDEX Upgrade Team. Physical description of external circuitry for resistive wall mode control in ASDEX Upgrade. In M Mateev and E Benova, editors, Europhysics Conference Abstracts (CD-ROM, Proc. of the 36th EPS Conference on Plasma Physics, Sofia, Bulgaria, 2009), volume 33E of ECA, pages P–1.165, Geneva, 2009. European Physical Society.
- [15] N Leuthold, W Suttrop, R Fischer, A Kappatou, A Kirk, R McDermott, A Mlynek, M Valovič, M Willensdorfer, the ASDEX Upgrade Team, and the EUROfusion MST1 Team. Parameter dependence of ELM loss reduction by magnetic perturbations at low pedestal density and collisionality in ASDEX Upgrade. Plasma Physics and Controlled Fusion, 59(5):055004, 2017.
- [16] ITER Physics Expert Group on Confinement and Transport, ITER Physics Expert Group on Confinement Modelling and Database, and ITER Physics Basis Editors. Chapter 2: Plasma confinement and transport. Nuclear Fusion, 39(12):2175, 1999.
- [17] R. Neu. Experience with high-z plasma facing materials and extrapolation to future devices. IEEE Transactions on Plasma Science, 38(3):453–460, jan 2010.
- [18] V. Bobkov, F. Braun, R. Dux, A. Herrmann, H. Faugel, H. Fünfgelder, A. Kallenbach, R. Neu, J.-M. Noterdaeme, R. Ochoukov, Th. Pütterich, A. Tuccilo, O. Tudisco, Y. Wang, Q. Yang, and ASDEX Upgrade team. First results with 3-strap ICRF antennas in ASDEX Upgrade. Nuclear Fusion, 56(8):084001, 2016.
- [19] B. A. Grierson, K. H. Burrell, R. M. Nazikian, W. M. Solomon, A. M. Garofalo, E. A. Belli, G. M. Staebler, M. E. Fenstermacher, G. R. McKee, T. E. Evans, D. M. Orlov, S. P. Smith, C. Chrobak, C. Chrystal, and DIII-D Team. Impurity confinement and transport in high confinement regimes without edge localized modes on DIII-D. Physics of Plasmas, 22(5), 2015.
- [20] M.J. Lanctot, R.J. Buttery, J.S. de Grassie, T.E. Evans, N.M. Ferraro, J.M. Hanson, S.R. Haskey, R.A. Moyer, R. Nazikian, T.H. Osborne, D.M. Orlov, P.B. Snyder, M.R. Wade, and the DIII-D Team. Sustained suppression of type-I edge-localized modes with dominantly n = 2 magnetic fields in DIII-D. Nuclear Fusion, 53(8):083019, 2013.
- [21] W Suttrop, L Barrera, A Herrmann, R M McDermott, T Eich, R Fischer, B Kurzan, P T Lang, A Mlynek, T Pütterich, S K Rathgeber, M Rott, T Vierle, E Viezzer, M Willensdorfer, E Wolfrum, I Zammuto, and the ASDEX Upgrade Team. Studies of edge localized mode mitigation with new active in-vessel saddle coils in ASDEX Upgrade. Plasma Physics and Controlled Fusion, 53(12):124014, 2011.
- [22] D A Ryan, Y Q Liu, A Kirk, W Suttrop, B Dudson, M Dunne, R Fischer, J C Fuchs, M Garcia-Munoz, B Kurzan, P Piovesan, M Reinke, M Willensdorfer, the ASDEX-Upgrade team, and the EUROfusion MST1 team. Toroidal modelling of resonant magnetic perturbations response in ASDEX Upgrade: coupling between field pitch aligned response and kink amplification. Plasma Physics and Controlled Fusion, 57(9):095008, 2015.
- [23] M. Bécoulet, F. Orain, P. Maget, N. Mellet, X. Garbet, E. Nardon, G.T.A. Huysmans, T. Casper, A. Loarte, P. Cahyna, A. Smolyakov, F.L. Waelbroeck, M. Schaffer, T. Evans, Y. Liang, O. Schmitz, M. Beurskens, V. Rozhansky, and E. Kaveeva. Screening of resonant magnetic perturbations by flows in tokamaks. Nuclear Fusion, 52(5):054003, 2012.
- [24] O. Sauter, C. Angioni, and Y. R. Lin-Liu. Neoclassical conductivity and bootstrap current formulas for general axisymmetric equilibria and arbitrary collisionality regime. Physics of Plasmas, 6(7):2834–2839, 1999.
- [25] Robert Hager and C. S. Chang. Gyrokinetic neoclassical study of the bootstrap current in the tokamak edge pedestal with fully non-linear coulomb collisions. Physics of Plasmas, 23(4):042503, 2016.
- [26] M. E. Fenstermacher, T. E. Evans, T. H. Osborne, M. J. Schaffer, M. P. Aldan, J. S. deGrassie, P. Gohil, I. Joseph, R. A. Moyer, P. B. Snyder, R. J. Groebner, M. Jakubowski, A. W. Leonard, O. Schmitz, and the DIII-D Team. Effect of island overlap on edge localized mode suppression by resonant magnetic perturbations in DIII-D. Physics of Plasmas, 15(5):056122, 2008.
- [27] O. Schmitz, T.E. Evans, M.E. Fenstermacher, M. Lehnen, H. Stoschus, E.A. Unterberg, J.W. Coenen, H. Frerichs, M.W. Jakubowski, R. Laengner, C.L. Lasnier, S. Mordijck, R.A. Moyer, T.H. Osborne, H. Reimerdes, D. Reiter, U. Samm, B. Unterberg, the DIII-D, and TEXTOR teams. Resonant features of energy and particle transport during application of resonant magnetic perturbation fields at TEXTOR and DIII-D. Nuclear Fusion, 52(4):043005, 2012.
- [28] M.R. Wade, R. Nazikian, J.S. deGrassie, T.E. Evans, N.M. Ferraro, R.A. Moyer, D.M. Orlov, R.J. Buttery, M.E. Fenstermacher, A.M. Garofalo, M.A. Lanctot, G.R. McKee, T.H. Osborne, M.A. Shafer, W.M. Solomon, P.B.Snyder, W. Suttrop, A. Wingen, E.A. Unterberg, and L. Zeng. Advances in the physics understanding of ELM suppression using resonant magnetic perturbations in DIII-D. Nuclear Fusion, 55(2):023002, 2015.
- [29] R. A. Moyer, C. Paz-Soldan, R. Nazikian, D. M. Orlov, N. M. Ferraro, B. A. Grierson, M. Knölker, B. C. Lyons, G. R. McKee, T. H. Osborne, T. L. Rhodes, O. Meneghini, S. Smith, T. E. Evans, M. E. Fenstermacher, R. J. Groebner, J. M. Hanson, R. J. La Haye, T. C. Luce, S. Mordijck, W. M. Solomon, F. Turco, Z. Yan, L. Zeng, and DIII-D Team. Validation of the model for ELM suppression with 3D magnetic fields using low torque ITER baseline scenario discharges in DIII-D. Physics of Plasmas, 24(10):102501, 2017.
- [30] Q. Yu and S. Günter. Plasma response to externally applied resonant magnetic perturbations. Nuclear Fusion, 51(7):073030, 2011.
- [31] N. M. Ferraro. Calculations of two-fluid linear response to non-axisymmetric fields in tokamaks. Physics of Plasmas, 19(5), 2012.
- [32] F. Orain, M. Bécoulet, G. Dif-Pradalier, G. Huijsmans, S. Pamela, E. Nardon, C. Passeron, G. Latu, V. Grandgirard, A. Fil, A. Ratnani, I. Chapman, A. Kirk, A. Thornton, M. Hoelzl, and P. Cahyna. Non-linear magnetohydrodynamic modeling of plasma response to resonant magnetic perturbations. Physics of Plasmas, 20(10), 2013.
- [33] E. Viezzer, T. Pütterich, R. Dux, R. M. McDermott, and ASDEX Upgrade Team. High-resolution charge exchange measurements at ASDEX Upgrade. Review of Scientific Instruments, 83(10):103501, 2012.
- [34] E. Viezzer, T. Pütterich, G.D. Conway, R. Dux, T. Happel, J.C. Fuchs, R.M. McDermott, F. Ryter, B. Sieglin, W. Suttrop, M. Willensdorfer, E. Wolfrum, and the ASDEX Upgrade Team. High-accuracy characterization of the edge radial electric field at ASDEX Upgrade. Nuclear Fusion, 53(5):053005, 2013.
- [35] R. Dux, A. G. Peeters, A. Gude, A. Kallenbach, R. Neu, and ASDEX Upgrade Team. Z dependence of the core impurity transport in ASDEX Upgrade H-Mode discharges. Nuclear Fusion, 39(11):1509–1522, 1999.
- [36] A. G. Peeters. Reduced charge state equations that describe Pfirsch-Schlüter impurity transport in tokamak plasma. Physics of Plasmas, 7(1):268–275, 2000.
- [37] E. Viezzer, E. Fable, T. Pütterich, A. Bergmann, M. Cavedon, R. Dux, R.M. McDermott, C. Angioni, R.M. Churchill, M.G. Dunne, F.M. Laggner, B. Lipschultz, U. Stroth, and E. Wolfrum. Collisionality dependence of edge rotation and in–out impurity asymmetries in ASDEX Upgrade H-mode plasmas. Nuclear Fusion, 55(12):123002, 2015.
- [38] Yueqiang Liu et al. Toroidal modelling of RMP response in ASDEX Upgrade: coil phase scan, dependence, and toroidal torques. Nuclear Fusion, 56(5):056015, 2016.
- [39] Yueqiang Liu, A. Kirk, Li Li, Y. In, R. Nazikian, Youwen Sun, W. Suttrop, B. Lyons, D. Ryan, Shuo Wang, Xu Yang, and Lina Zhou. Comparative investigation of ELM control based on toroidal modelling of plasma response to RMP fields. Physics of Plasmas, 24(5):056111, 2017.
- [40] B C Lyons, N M Ferraro, C Paz-Soldan, R Nazikian, and A Wingen. Effect of rotation zero-crossing on single-fluid plasma response to three-dimensional magnetic perturbations. Plasma Physics and Controlled Fusion, 59(4):044001, 2017.
- [41] Martin F. Heyn, Ivan B. Ivanov, Sergei V. Kasilov, Winfried Kernbichler, Peter Leitner, Viktor V. Nemov, Wolfgang Suttrop, and the ASDEX Upgrade Team. Quasilinear modelling of RMP interaction with a tokamak plasma: application to ASDEX Upgrade ELM mitigation experiments. Nuclear Fusion, 54(6):064005, 2014.
- [42] W. Suttrop, M. Kaufmann, H. J. de Blank, B. Brüsehaber, K. Lackner, V. Mertens, H. Murmann, J. Neuhauser, F. Ryter, H. Salzmann, J. Schweinzer, J. Stober, H. Zohm, and ASDEX Upgrade Team. Identification of plasma-edge-related operational regime boundaries and the effect of edge instability on confinement in ASDEX Upgrade. Plasma Physics and Controlled Fusion, 39(12):2051–2066, 1997.
- [43] M. Willensdorfer, T. B. Cote, C. C. Hegna, W. Suttrop, H. Zohm, M. Dunne, E. Strumberger, G. Birkenmeier, S. S. Denk, F. Mink, B. Vanovac, and L. C. Luhmann. Field-line localized destabilization of ballooning modes in three-dimensional tokamaks. Phys. Rev. Lett., 119:085002, Aug 2017.
- [44] H. R. Wilson, J. W. Connor, A. R. Field, S. J. Fielding, R. L. Miller, L. L. Lao, J. R. Ferron, and A. D. Turnbull. Ideal magnetohydrodynamic stability of the tokamak high-confinement-mode edge region. Physics of Plasmas, 6(5):1925–1934, 1999.
- [45] E. Strumberger, S. Günter, and C. Tichmann. MHD instabilities in 3D tokamaks. Nuclear Fusion, 54(6):064019, 2014.
- [46] A Wingen, N M Ferraro, M W Shafer, E A Unterberg, J M Canik, T E Evans, D L Hillis, S P Hirshman, S K Seal, P B Snyder, and A C Sontag. Connection between plasma response and resonant magnetic perturbation (RMP) edge localized mode (ELM) suppression in DIII-D. Plasma Physics and Controlled Fusion, 57(10):104006, 2015.