The Maximum Trajectory Coverage Query in Spatial Databases
Abstract
With the widespread use of GPS-enabled mobile devices, an unprecedented amount of trajectory data is becoming available from various sources such as Bikely, GPS-wayPoints, and Uber. The rise of innovative transportation services and recent break-throughs in autonomous vehicles will lead to the continued growth of trajectory data and related applications. Supporting these services in emerging platforms will require more efficient query processing in trajectory databases. In this paper, we propose two new coverage queries for trajectory databases: (i) Maximizing Reverse Range Search on Trajectories (MaxRRST); and (ii) a Maximum Coverage Range Search on Trajectories (MaxCovRST). We propose a novel index structure, the Trajectory Quadtree (-tree) that utilizes a quadtree to hierarchically organize trajectories into different quadtree nodes, and then applies a z-ordering to further organize the trajectories by spatial locality inside each node. This structure is highly effective in pruning the trajectory search space, which is of independent interest. By exploiting the -tree data structure, we develop a divide-and-conquer approach to compute the trajectory “service value”, and a best-first strategy to explore the trajectories using the appropriate upper bound on the service value to efficiently process a MaxRRST query. Moreover, to solve the MaxCovRST, which is a non-submodular NP-hard problem, we propose a greedy approximation which also exploits the TQ-tree. We evaluate our algorithms through an extensive experimental study on several real datasets, and demonstrate that our -tree based algorithms outperform common baselines by two to three orders of magnitude.
I Introduction
With the widespread use of GPS-equipped mobile devices and the popular map services, an unprecedented amount of trajectory data is becoming available. For example, in Bikely111http://www.bikely.com users can share their cycling routes from the GPS devices, in GPS-wayPoints222http://gpswaypoints.net a user can add waypoints (points on a route at which a course is changed) in a route and share with friends, in Microsoft GeoLife333https://research.microsoft.com/en-us/projects/geolife/ users can share their travel routes and experience using GPS trajectories. Most of the popular social network sites also support sharing user trajectories
Other than personal trips and travel routes, there are many examples of trajectories from different transport services. Uber served nearly million users in New York City between January-June 2015444https://github.com/fivethirtyeight/uber-tlc-foil-response. While user trajectory data has already been used for public transport planning, a wide range of applications remain where planning ad-hoc transport services are of interest. As discussed in an IEEE Spectrum report earlier this year, ride-sharing, taxi services, and on-demand transportation services will be key sectors in the looming autonomous vehicle industry [1]. Consider the following examples that highlight the potential applications in planning ad-hoc transport services.
Scenario 1: An autonomous transport service company wants to introduce new service routes that can serve the maximum number of users who are currently using other forms of transportation (e.g., personal cars) for daily commute. The daily commuting routes are essentially a trajectory from a source to a destination. Since there can be many possible service routes, the top- routes that can serve the maximum number of users are of interest.
Scenario 2: Consider a tourist city, where each tourist has a list of POIs to visit, which can be seen as a trajectory. Now, a tour operator wants to run a bus service in different routes to serve the maximum number of tourists. In this case, a tourist may use the service if a number of her POIs can be visited (if it is not possible to serve the full list by the operator).
Scenario 3: In a smart city, consider a public transport operator wants to provide Wi-Fi service or display moving advertisements to commuters. The operator has multiple buses, and among the many possible routes, the operator can choose the top- routes which provide this additional service to the maximum number of users for the maximum duration.
The underlying problem in all the above scenarios is to select a limited number (top-) of facility trajectories from a given set that can best “serve” the user trajectories. In Scenario 1, only the start and the end points of each user trajectory are of interest, and a user can be served by a facility (e.g., ride the bus) if a stop of that facility is sufficiently close, i.e., within a certain distance to these locations. In this case, the service of a facility is a binary notion.
In Scenarios 2 and 3, all of the points in a user trajectory can be important as one may want to maximize the “service” to the user trajectories by a facility trajectory in terms of the number of points (e.g., the number of POIs that a tourist can visit) or the trajectory length (e.g., the length of a journey with advertisement display). In this case, a user can be served partially by a facility. We use the term “service” of a facility to refer to both these binary and non-binary measures (details in Section II).
In this paper, we address this new class of trajectory search problems, denoted as the Maximizing Reverse Range Search on Trajectories (MaxRRST) query which finds facilities that maximize a service measure for a set of user trajectories. Formally, given a set of user trajectories, a set of candidate facility trajectories, and a positive integer , a MaxRRST query returns facilities from with the highest service to the user trajectories in . We also address another variant of the query that returns facilitates from that combinedly serve the maximum user trajectories from . We denote this type of query as a Maximum Coverage Range Search on Trajectories (MaxCovRST).
As the service value, i.e., how well the users are served by a service may vary across applications, we formally define the service value function to measure the service of a facility on the set of user trajectories. For the MaxCovRST problem, the service value is computed for a subset of facilities , where the common service provided by different facilities to the users are considered. Please refer to Section II for details.
Example 1
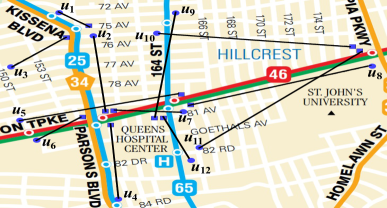
Figure 1 shows an example of a MaxRRST query for user trajectories , representing daily routes of commuters, and three facility trajectories representing the bus routes with stop points in Queens NY. Let, a user will use a facility if there is a pickup/drop-off location of that facility within a threshold distance from her source and destination. Thus, can be served by , by , and by . Hence the bus route will be returned as the answer for the query. For MaxCovRST query, since can be served jointly by and , the answer of the query for is {} as they can serve maximum users, , , , , , , , , where the other sets of size , and can serve , , , , , , , and , , , , respectively.
A major challenge of these queries is to track the different segments of a trajectory that can be served by a facility trajectory. A user can be served partially by a facility, and a user can be served by multiple facilities. In most of the existing work on trajectories ([2, 3]), the points of the trajectories are indexed using a state-of-the-art spatial indexing method to answer a query. However, such techniques are not amenable to our problem as both the partial service of a user trajectory (e.g., the number of POIs from the list of interesting places that a tourist can visit), and the combined service of multiple facilities are required in this problem. Similarly, previous studies that find trajectories within a range of a query trajectory ([4]), or find the reverse nearest neighbor trajectories ([5]) cannot be used for our problem, as it would require repeating the approaches for each facility route, which is not efficient. Moreover, to the best of our knowledge, there is no existing work on trajectories that can be used to efficiently answer MaxCovRST, where a user trajectory can be served jointly by multiple facility trajectories (See Section VII for details).
The contributions of the paper are summarized as follows:
-
•
We propose a new class of trajectory queries: (i) Maximizing Reverse Range Search on Trajectories (MaxRRST) which finds query trajectories with the maximum service to the users. (ii) Maximum Coverage Range Search on Trajectories (MaxCovRST) which finds trajectories that combinedly maximize the service.
-
•
The novelty of our work comes from the key observation that if the points of multiple user trajectories are co-located and have similar orientation, then those trajectories are likely to be served by the same facility. We propose a novel two-level index structure, the Trajectory Quadtree (-tree) based on this idea where such trajectories are stored together. Specifically, a quadtree structure is employed to organize the trajectories in a hierarchy, and then a z-ordering is applied to organize the trajectories by spatial locality inside a quadtree node. Such a structure is highly effective in pruning the search space for different segments of trajectories based on locality and orientation, which is of independent interest.
-
•
We present an efficient divide-and-conquer approach where a facility trajectory is recursively divided and the service value of the components of the facility is calculated in that subspace. For each subspace, we apply a two-phase pruning technique using the TQ-tree. As either the partial or the complete service values are important based on the application, we present a best-first strategy to efficiently explore the facilities using the appropriate upper bound on the service value. We also present different conditions where the process can be safely early terminated.
-
•
We prove that the MaxCovRST is a non-submodular NP-hard problem. We propose an efficient two-step greedy approximation algorithm to answer MaxCovRST, where in the first step we compute a subset of the highest serving facilities using our MaxRRST algorithm, and then greedily choose facilities.
-
•
We evaluate our algorithms through an extensive experimental study on real datasets. The results demonstrate both the efficiency and effectiveness of the algorithms.
II Problem Formulation
Let be a set of user trajectories where each is a sequence of point locations, and be a set of facility trajectories, where each is a sequence of stop points representing the pick-up or drop-off locations of a facility route (e.g., bus route). A user trajectory can be served by a facility in different contexts.
First, we present the calculation of the service values of a facility for a single user in different scenarios, and then we present a generalized function to compute the service value of a facility or a set of facilities for the set of users .
II-A Service value for a single user
Scenario 1. Here, and are the source and destination locations of . A user is only interested in using a facility if there is any stop point of within a certain distance from the source and destination of , i.e., . Here, can be set based on the distance/range that a user can cover on foot or by other means for availing the transportation facility. In such cases, we can define the Boolean service function as:
Scenario 2. In non-binary cases where can be served partially by , the service can be computed based on the number of points in that can be served by , (e.g., the number of POIs that can be visited by a tourist) as described in Scenario 2. Then the service value of is calculated as: .
Scenario 3. When the interest is in maximizing the length of served by , (e.g., the length of journey with advertisement display), the service value is calculated as: , where is the total length of . Note that the length of two trajectories with the same number of points can be different based on the length of the segments between those points.
II-B Service value for the set of users
As the objective of a facility is to maximize the service to , the service value of a facility for is calculated as:
| (1) |
For a collection of facilities, where , we can generalize the service value function as follows:
| (2) |
Since a user can be served by more than one facility in , we only consider the service once if the same service is provided by more than one facility. The function AGG takes this issue into account by aggregating the services provided by each to .
Problem definition. Based on the above definitions, we formally define our trajectory queries as follows.
Definition 1
k. Given a set of user trajectories, a set of facilities, a positive integer , and a service value function , the MaxRRST query returns the top- facilities from such that , .
Definition 2
(MaxCovRST). Given a set of user trajectories, a set of facilities, the group size , and a service value function , let the set be all possible subgroups of size from . The MaxCovRST query returns a subgroup of facilities such that for any other subgroup , .
III Trajectory Quad-tree (TQ-tree)
The key observation behind our proposed indexing technique is, the trajectories whose points (e.g., start points and end points) are co-located, are likely to use the same facility. Thus such trajectories should be stored together in the index. Based on this observation we present a novel index, denoted as the Trajectory Quad (TQ) tree, where trajectories with close spatial proximity and similar orientation are grouped and stored together in an effective way. For simplicity, we first describe the details of the index for trajectories with two endpoints (source-destination), and later we present the generalized structure for trajectories with any number of points. A two-level indexing is applied to index the trajectories in a TQ-tree. We explain the index construction process and the rationale behind each step in the following.
Hierarchical organization. The space is recursively partitioned to group spatially similar trajectories together. Specifically, a quadtree structure is employed to partition the space. Each node of the quadtree, denoted as a q-node is associated with a pointer to a list of user trajectories.
If is a leaf node, contains the intra-node trajectories, i.e., the trajectories whose both endpoints reside in . Otherwise, consists of the inter-node user trajectories, i.e., trajectories whose two endpoints reside in two immediate child nodes of . A node of the quadtree is partitioned until there is no such inter-node trajectories left to be stored with that node, or contains at most number of intra-node trajectories. Here, corresponds to the size of a memory block (or a disk block for a disk-resident list ).
With each q-node , an upper bound, of the service value is stored for the trajectories stored in the subtree rooted at . For Scenario 1, of is the total number of user trajectories, for Scenario 2, is the total number of points of the user trajectories, and for Scenario 3 is the total length of the user trajectories stored in the sub-tree rooted at , respectively.
 |
 |
 |
 |
 |
| (a) | (b) | (c) |
As mentioned in prior work [6], one of the major challenges of indexing trajectories is in organizing the trajectories with different lengths. Unlike traditional spatial hierarchical indexing, where only the leaf nodes contain the data, we store the trajectories in both leaf and non-leaf nodes. In this hierarchical organization, longer trajectories are more likely to be stored in upper level nodes and shorter trajectories in lower level nodes. Such an organization will later facilitate efficient pruning and service (either partial or complete) calculations for both longer and shorter trajectories.
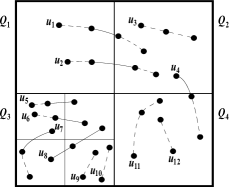
Example 2
Figure 2 shows an example TQ-tree for the user trajectories, , where let . The space is first divided into four quadrants, . As only contains intra-node trajectories, and the trajectories in and are stored as the inter-node trajectories of the root node of the quadtree, these q-nodes are not partitioned further. The q-node is further divided into four quadrants. The inter-node trajectories of are , and the partitioning terminates.
 |
 |
| (a) Segmented TQ-tree | (b) Full-trajectory TQ-tree |
Ordered bucketing using z-curve:. Depending on the application scenarios and the user travel patterns, the list of trajectories in a q-node can be quite large. For example, if there are many users who travel everyday from the same suburb to the city, these user trajectories may all fall under a particular q-node. Thus, a straightforward approach to store these trajectories as a flat list may result in poor query processing performance. Therefore we use a space filling curve, specifically a Z-curve (Morton order) to order the trajectories such that the trajectories with close spatial proximity and similar orientation are grouped together into a single “bucket”. The list of each q-node is arranged as a sorted list of buckets, where the trajectories in each bucket is also sorted by their z-ordering. Here each bucket is referred to as a z-node.
Specifically, for each q-node , (i) we first apply the z-ordering on the start points of the user trajectories in . The space enclosed by is partitioned until each partition contains at most start points of user trajectories. (ii) Then, we partition the space based on the end points of the user trajectories, where each partition can contain a maximum of end points. Also, if multiple trajectories have the same z-id for their start points, the space is partitioned until the end point of each such trajectory is assigned a different z-id. This step enables us to distinguish between the trajectories with the co-located start points. (iii) Based on the z-order numbers assigned to each points of user trajectories, we keep them in a sorted bucket list, where each bucket can contain at most trajectories.
If each trajectory is an ordered sequence of points, then we order the trajectories based on the starting point first, and if two trajectories have the same z-orders, we order them based on their second points, and so on. If the trajectories are defined as non-ordered sequence of points, then we order the points of a trajectory based on the z-order, and then apply the aforementioned procedure to sort the trajectories.
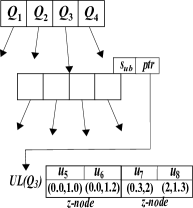
Example 3
Figure 3 shows the construction process of z-nodes. The q-node points to of four inter-node trajectories, . To obtain the z-ordering, the space of is partitioned based on the start points of the trajectories, and each partition is assigned a z-id where a partition can have at most start points (Figure 3(b)). As an example, the start points of both and have as their z-ids. Next, we apply the same partitioning strategy on the end points. The end points of , , , and are assigned z-ids , , , and , respectively and the partitioning terminates. Finally, a pair of z-ids for each trajectory is kept in z-nodes, each of size (Figure 2 (right)).
III-A Generalization of the Index
So far we explained our index for trajectories with two points (source and destination), which serves only a subset of queries described in Scenario 1. To serve other types applications that require maintaining a sequence of points in each trajectory where a trajectory can be served partially, we generalize our index as follows. We propose two approaches: a segmented approach, and a full-trajectory approach.
Segmented approach:. We segment each trajectory into a sequence of pairs of points, and then for each pair of points (segment) we apply the same strategies described above.
Here, indexing each segment of the trajectories in hierarchy and ordered lists will enable us to calculate the total and the partial score of service (explained later in Section IV. This process is depicted in Figure 4(a).
Full trajectory approach. In some applications, we need to consider the entire trajectory contiguously as the objective function may need to quantify the coverage of an individual user trajectory that is served by the facilities. For these applications, we propose a full-trajectory approach, where we store a trajectory in the q-node at the lowest level of the quadtree that fully contains the entire trajectory. In an intermediate q-node, all inter-node trajectories are sorted using z-orders, and in a leaf q-node intra-node trajectories are stored using z-orders (as described previously). This scenario is depicted in Figure 4(b).
Note that we use a quadtree to partition the space and then organize the trajectory information in each quadtree cell using space filling curves. The main reason for using quadtree is that it supports efficient frequent updates. Moreover, since a quadtree partitions the space into disjoint cells, we can apply z-orders to generate unique ids for the points in a trajectory.
III-B Index Storage Cost
The space requirement of the hierarchical component of the TQ-tree includes storing the nodes of the quadtree, specifically, , where is the height of the tree. If only the source and destination points of each trajectory is of interest, then a trajectory is stored exactly once in an appropriate node of the TQ-tree. Thus the total size of the user trajectory lists in all nodes, , is at most the total number of user trajectories . The same storage costs apply for the full trajectory approach as well.
In the generalized TQ-tree, each segment of a user trajectory is stored in an appropriate node of the TQ-tree. The total number of segments of a trajectory is , and a segment is stored exactly once. Thus the total size of the user trajectory lists in all the nodes, in the generalized TQ-tree is .
III-C Updating the Index
Since the TQ-tree uses a regular space partitioning scheme, to insert a new user trajectory, , we can quickly identify the corresponding q-node to which belongs to in time. Then, needs to be inserted in an appropriate z-node of the user trajectory list. If the number of points in the corresponding z-node does not exceed the threshold , no further partitioning is needed. The points of are assigned the appropriate z-ids, and inserted in the sorted user trajectory list. Otherwise, the corresponding z-node is partitioned and the z-ids are assigned to the points of . Since the z-ids of the existing user trajectories in that z-node may change, we may need to re-assign z-ids to the trajectories. This re-assignment needs to be done for at most trajectories in that z-node.
IV Processing MaxRRST Queries


In MaxRRST query, a user trajectory can be partially served by a facility. Thus, an efficient technique is needed to calculate the appropriate service value of a facility for the set of user trajectories. In this section, we first propose an efficient divide-and-conquer algorithm to recursively divide a facility trajectory and traverse only the necessary nodes of the TQ-tree to calculate the service value of the components of the facility in that subspace. We apply a two-phase pruning technique using the TQ-tree, where the q-nodes are pruned first, and then the z-ordering of the trajectories are used to further prune the z-nodes. A merge step is evoked to check if the same user trajectory can be served by the connected components of the same facility, and an upper bound of the service value of that facility is updated from the current state of exploration. A best-first strategy is employed to explore the facilities based on their estimated upper bounds of service values. In this section, we first present our algorithm for computing the service value of a single facility . Then we present our approach to find the top- facilities from with the maximum service value.
IV-A Calculating Service Value: Divide-and-Conquer
Algorithm 1 shows the pseudocode for calculating the service value of a facility . Note that in our application scenarios, a user can be served by (partially or completely) if a point of is within a threshold distance from any point of . Thus, we cover with an extended minimum bounding rectangle (EMBR) that includes the serving area of . However, without loss of generality, we use the term EMBR and interchangeably when we match users with .
Initially, the function is called with the root node of the TQ-tree for . First, it finds the relevant child q-nodes of that intersect with (or EMBR of ) in the function (Line 1). If a child q-node does not intersect, that q-node can be safely pruned. Otherwise, the EMBR of is divided into four equal subspaces. For each unpruned child q-node of and the corresponding intersecting components of , the function evaluateService in Algorithm 1 is recursively called (Line 1).
The recursive call terminates at two conditions: (i) If is empty, i.e., after division there is no point left in that subspace that can server any user (Line 1); and (ii) When is a leaf node. For a leaf node, the function is called to compute the service value for the intra-node trajectories in of that node.
The function evaluateNodeTrajectories is used to determine the service value that is increased for serving the trajectories in . Algorithm 2 describes that process. A merge step is employed in this algorithm as the function MakeUnion() to check whether the same user trajectory can be served by the same connected components of . Here, the connected components of are assigned unique identifiers. Next, we need to access the trajectories in (that are stored as a sorted list of z-nodes according to z-order). We apply a pruning technique using the z-order ids of the trajectory points to get a list of a reduced size from using the function in Lines 2 - 2 (explained later). For each user trajectory in the reduced list , we compute the service value gained for serving by .
Note that the evaluation of function varies across different applications. For example, in Scenario 1, where we are only interested in serving start and end points, returns if both points of are within distance from any of the stop points of (or a connected component of ). Otherwise, returns .
The function zReduce in Algorithm 2 is used to prune the inter-child trajectories that cannot contribute to the service value. The idea is to avoid searching the full list of inter-child trajectories and reduce the list to a small relevant set of trajectories based on the spatial properties of and z-ordering. This function takes the inter node trajectory list and a component of the facility as input. It prunes the user trajectories based on the z-ids that the facility intersects.
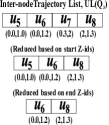
Example 4
We explain the function with an example in Figure 5. The figure shows a facility trajectory , and a list of inter-node trajectories with start and end z-ids {(0.0,1.0), (0.0,1.2), (0.3,2), (2,1.3)} of q-node . Let can intersect nodes with z-ids fully or partially, i.e., the stop points in are within distance to serve fully or some portions of these z-nodes. Thus, trajectory is pruned since its start z-id is not covered by . In this step, we get a reduced list with z-ids {(0.0,1.0), (0.0,1.2), (2,1.3)}. Next we look at the z-ids of end points for pruning the list further. Here, is pruned since its end z-id is , and we get the final reduced list . Thus in two steps the inter-node trajectory list gets reduced to . After reducing to (Figure 5(b)), we divide into four sub-spaces, , and evaluate the service values of these subspaces by calling Function (Figure 5(c)).
Algorithm for multiple-point trajectories. In Algorithm 2, the function returns a normalized score that is achieved for serving multiple-point trajectory by . The normalized score depends on the requirements of the applications (e.g., Scenario 2 or 3): one may want to count the number of points in served by , or find a summation of the segments of served by . To accommodate such applications, the service value calculation changes accordingly.
Based on our above algorithms, we now propose an approach that finds the top- facilities from a set of facilities.
IV-B Finding Top- Facilities
Algorithm 3 shows the pseudocode for finding the top- facilities from . The key idea is to apply a best-first technique to explore facilities based on their predicted upper bounds of the service values. The upper bound of the service value, fserve of a facility (or a collection of facilities) is computed by combining the value of the actual service function, aserve, from the current state of exploration and the optimistic value of the service function, hserve, which is estimated based on a heuristic, i.e., the maximum service value that can be achieved by further exploration of the facility.
For each facility , we maintain a tuple to preserve its current state of exploration. contains the following information: identity of the facility, a list qflist of q-node, facility-component pair that overlaps with each other, the actual service value aserve of the facility based on the actual number of users served so far by the current state of exploration, and the maximum value of the service hserve that can be achieved by in the remaining parts of the exploration. We maintain a max-priority queue, PQ of such tuples according to the upper bound values, fserve, where, (i.e., the summation of the actual service value achieved and the upper bound of the service value that can be achieved by the facility).
The result set and the priority queue PQ is initialized (Line 3) as empty. The states are initialized for each facility, and inserted in PQ (Lines 3 - 3). Function returns the smallest q-node, that contains (Line 3). A pair is formed with the facility component and the corresponding . The pair is inserted in qflist of . We initialize aserve with 0 (as no user trajectories has been matched with ) and hserve with the upper bound of the service values stored with the node in the TQ-tree. As described in Section III, depending on the application, the upper bound of serve is different. For example, for scenario 1, of a node is the number of trajectories contained in . We insert the current state of along with the total upper bound of the service value, , achieved so far by the current state of facility exploration.
Next, we progressively explore user trajectories by relaxing different parts of facility trajectories to find the top- facilities that maximize the service. In each iteration (Lines 3 - 3), the facility component with the maximum fserve value is dequeued from PQ, and the state is updated by relaxing the component through a function call that explores the children of the corresponding q-node, updates aserve and hserve, and inserts the new state into PQ. If qflist of the dequeued facility is empty, it implies that all components of this facility trajectory are explored, thus the facility is added to the result set. The process terminates when top- facilities are found, and the result list is returned.
Relaxing state. Algorithm 4 shows the pseudo-code of how to relax the state of a facility component. The input is the current state, the relaxed (or more expanded) state is returned as output.
First, we initialize the variables of the new relaxed state as , , , and . Next, for pair of q-node and facility component in the qflist of input state , we expand the component with respect to the children q-nodes of . In this expansion and update process, we update the value aserve, i.e., number of users already served by adding the number of inter-node trajectories of the corresponding q-node that can be served by .
For this purpose, we compute the service value of that q-node by calling the evaluateNodeTrajectories() function, and add this value to , as denotes the value of trajectories already served (Line 4).
Next we get the child q-nodes and corresponding components of the facility. In the loop presented in Lines 4 - 4 we update the list of q-node, facility component pair for each of the child nodes and the maximum value of service with the upper bound service value stored in the child q-node (Line 4). The outer loop terminates when we complete the same computation for all the members of the pair list of the current state. Finally the relaxed state is returned.
V Processing MaxCovRST
The MaxCovRST query is a variant of the maximum coverage problem, which is NP Hard. A similar problem is presented in [7], please refer to Lemma 1 in [7] for the proof of NP-hardness.
The exact solution of the problem is to iterate through all possible combinations of facilities from facilities, calculate the service value of each of them, and then return the combination with the maximum value.
Although a greedy solution exists with theoretically known best approximation ratio for the maximum coverage problem ([8]), the assumption of the solution is that the objective function is submodular. However, the objective function of the MaxCovRST problem is non-submodular, and thus the approximation ratio of that solution does not hold.
Lemma 1
The service value function of the MaxCovRST problem is non-submodular.
Proof:
Let be a function that maps a subset of a finite ground set to a non-negative real number. The function is submodular if it satisfies the natural “diminishing returns” property: the marginal gain from adding an element to a set is at least as high as the marginal gain from adding to a superset of . Formally, for all elements and all pairs of sets , a submodular function satisfies .
We will prove this lemma by contradiction. Assume that the service function of the MaxCovRST problem is submodular. Let be a set of facilities, and be the maximum number of user trajectories that are combinedly served by . Now suppose that we add another facility to such that (i.e., no additional user is served by adding ). If is submodular, then must be true.
If we can find an instance where when , is non-submodular by contradiction. Consider Scenario 1 where a user is served by a facility when both the source and destination of is within distance from any point of the facility. Let the source of a user be within from a facility in but not , and the destination of is not within from either or (i.e., is not served by either). Let the facility be within distance from only the destination of . Therefore, will be served by (source is served by , and destination is served by ). That is, . However is not served by as the source of is not served by or , i.e., , which is a contradiction. So, of the MaxCovRST problem is non-submodular. ∎
To the best of our knowledge there is no greedy solution with a guaranteed approximation ratio for non-submodular functions for this problem. There are several optimization approaches, including genetic algorithms, simulated annealing, or ant colony optimization that could be used to find the maximum value of the objective function. However, all of these solutions are offline and may require many iterations to converge to an optima, so these solutions are not suitable for the online computation of ad-hoc route planning problems. Therefore, we present a greedy solution of the MaxCovRST problem, where the challenge is to efficiently find the users and the user segments that can be combinedly served by multiple facilities, and compute the combined service value, as a user can be served by multiple facilities and there can be overlaps in the service. We exploit the TQ-tree for our solution, as this structure enables us to efficiently address these challenges.
V-A Greedy Solution
Inspired by the greedy algorithm of Fiege [8], which is the best-possible polynomial time approximation algorithm for the maximum coverage problem, we present a greedy solution for the MaxCovRST problem. A straightforward adaptation is to first compute the service value for each facility and iteratively choose a facility that serves the maximum number of users that have not been served, considering the service overlap of multiple facilities for a user. Since this straightforward approach requires to evaluate the services for all facilities and keeping track of all users who have been served by each facility, this approach can be expensive when the number of users and facilities are large.
To overcome the above limitations, we propose a two-step greedy approach, where in the first step we compute a subset () of the highest serving facilities using our MaxRRST algorithm. In the second step we apply the above mentioned greedy algorithm to iteratively choose a facility from those facilities that serve the maximum number of users that have not been served. We have found that this approach is highly effective in practical scenarios and can respond to queries in milliseconds. Due to space constraint, we have omitted the details, but present its experimental evaluation in Section VI.
VI Experimental Evaluation
In this section we present the experimental evaluation for our solutions to answer the MaxRRST and MaxCovRST queries. As there is no prior work that directly answers these problems, we compare our solutions with a baseline.
Specifically, for the MaxRRST query, we compare the following three methods: (i) Baseline (BL): In this approach, for each facility, the user trajectories that are within distance are retrieved by executing a range query in a traditional index (in our experiments, a quadtree). The service value of each facility is computed, and the top- facilities are returned as the result. (ii) TQ-tree Basic (TQ(B)): In this method, we use a simple TQ-tree that hierarchically organizes user trajectories using a quadtree, but keeps a linear list for storing trajectories in each q-node as the index structure. The algorithm presented in Section IV is applied on this index.
(iii) TQ-tree Z-order (TQ(Z)): We use our proposed TQ-tree, where the trajectories in the hierarchical structure are ordered using a z-curve and indexed using their z-ids in each q-node of the quadtree, and apply the algorithm presented in Section IV. We present our approach with both TQ(B) and TQ(Z) to show the additional benefits of using the Z-ordered bucketing in the index.
| Name | # Facilities | # of stop points |
|---|---|---|
| NY Bus Route | ||
| Beijing Bus Route |
| Name | # Trajectories | Type |
|---|---|---|
| NY Taxi-trips (NYT) | point-to-point | |
| NY Foursquare (NYF) | multipoint | |
| BJ Geolife (BJG) | multipoint |
For the MaxCovRST problem, we compare four different methods: (i) Greedy baseline (G-BL) that uses baseline service evaluation strategy in the straightforward greedy approach, (ii) Greedy TQ-tree basic (G-TQ(B)) that runs our greedy solution using TQ-tree basic, (iii) Greedy TQ-tree Z-order (G-TQ(Z)) using TQ-tree Z-order, and (iv) Genetic-TQ-tree Z-order (Gn-TQ(Z)) that employs genetic algorithm using TQ-tree Z-order.
VI-A Experimental settings
We use Java to implement our algorithms. All the experiments were conducted in a PC equipped with Intel core i5-3570K processor and 8 GB of RAM. In all of our experiments, we use in-memory data structures. Without loss of generality our data structures can be applied for disk-based system.
Facility Datasets. We use two real bus network datasets: (i) New York (NY) and Beijing (BJ) bus routes as our facility datasets. Table I shows the summary of the facility datasets.
User Trajectory Datasets. To accommodate a wide range of real-world user movements with different types and volumes, we use the following three datasets: (i) Yellow taxi trips555www.nyc.gov/html/tlc/html/about/trip_record_data.shtml in New York (NYT), (ii) Foursquare check-ins666www.kaggle.com/chetanism/foursquare-nyc-and-tokyo-checkin-dataset in New York (NYF), and (iii) Geolife GPS traces777www.microsoft.com/en-us/download/details.aspx?id=52367 in Beijing (BJG).
The taxi-trips are essentially pairs of pick-up and drop-off locations of passengers, and thus can be considered as user trajectories with two points. In contrast, the Foursquare dataset consists of user check-in data for different users in NY, where each check-in is a stop point for a trajectory. We refer these trajectories as multi-point. We also use Geolife GPS trajectories that contain the user movement traces of users over three years period of time resulting trajectories in Beijing. This Geolife data can also be considered as multi-point user trajectories. Table II summarizes the datasets used.
Performance Evaluation and Parameterization. We studied the efficiency, scalability, and effectiveness for the baseline and our proposed approaches by varying several parameters. The list of parameters with their ranges and default values in bold are shown in Table III. For all experiments, a single parameter is varied while keeping the rest as the default settings.
For efficiency and scalability, we studied the impact of each parameter on (i) the runtime to calculate the service value of a facility, and (ii) the total runtime of answering the MaxRRST query. We evaluate the performance on the user trajectory dataset with both source-destination points, and multiple points. In each case we generate sets of queries with the same settings and report the average performance. As the greedy solutions provide an approximate result, we also report the effectiveness of our solutions as (i) the total number of users served, and (ii) approximation ratio.
| Parameters | Ranges |
|---|---|
| Routes | NY, BJ |
| Datasets | NYT, NYF, BJG |
| # Trajectories | , 357139, , |
| # Stops () | 8, 16, 32, 64, 128, 256, 512 |
| # Facilities () | 8, 16, 32, 64, 128, 256, 512 |
| 4, 8, 16, 32 |
VI-B Experimental results
1) Computing service value. We vary different parameters and present the processing time for calculating the service value of a single facility in the following.
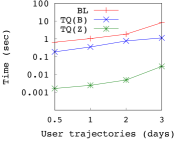
(i) No. of user trajectories: We vary the number of taxi trips in NYT dataset as (NYT-0.5), (NYT-1), (NYT-2), and (NYT-2), which corresponds to the taxi trips in hours, day, days, and days, respectively. Figure 6 (a) shows the average processing time for the baseline (BL), TQ-tree basic (TQ(B)), and TQ-tree Z-order (TQ(Z)). As the TQ(B) organizes the trajectory segments in hierarchy in contrast to indexing points in a quadtree in BL, TQ(B) is order of magnitude faster than the baseline. The spatial Z-ordering of the trajectories in TQ(Z) results into orders of magnitude faster processing time than TQ(B) for calculating the service value of a single facility.
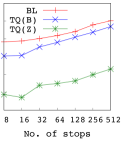
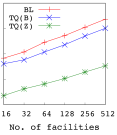
(ii) No. of facility stops: We vary the number of stops of each facility from to , and report the average processing time to compute the service value of a facility. The results (Figure 6 (b)) show that TQ(B) and TQ(Z) outperform the baseline by around order of magnitude and order of magnitude, respectively. Here, the runtime of all of the approaches gradually increase with the number of stops, as more users become eligible to be served. The benefit of the divide-and-conquer approach in the TQ-tree based approaches is higher for a lower number of stops.
(iii) Distance threshold : Although more users are likely to be eligible to be served with the increase of , we do not observe any significant change in the performance of our proposed algorithms other than the baseline. We omit the performance graph for varying for brevity.
2) Processing MaxRRST. We evaluate our proposed algorithms to answer MaxRRST, and compare the performance with the baseline.
(i) No. of user trajectories: The algorithm using the TQ(Z) index outperforms the baseline by at least orders of magnitude and TQ(B) by around orders of magnitude (Figure 7(a)). As the number of trajectories in the user list of each q-node increases with the total number of user trajectories in the dataset, the benefits of TQ-tree based indexes decrease gradually. The number of unique z-ids in the Z-ordering, and the number of z-nodes also increase with the number of user trajectories, thus the processing time in TQ(Z) increases at a higher rate than the other two approaches.
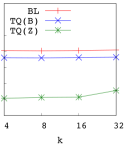
(ii) No. of results (): We vary the number of the required answers and compare the performances. As the baseline computes the service value of each facility and return facilities with the maximum values, the processing time of the baseline do not vary for . The runtime of both TQ-tree based approaches slightly increase with the increase of as more iterations in the divide-and-conquer approach are likely to be required for a higher (Figure 7(b)).
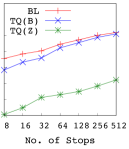
(iii) No. of stops: Similar to the previous results shown for computing the service value of a facility, the processing time of MaxRRST for varying the number of stops of each facility gradually increase for all of the approaches (Figure 7(c)). The runtime of TQ(B) is around order of magnitude faster than the baseline for smaller number of stops, but the benefit decreases for a higher number of stops. The reason is that the number of iterations in the divide-and-conquer approach increases with the number of stops, and the list of trajectories in the user list of a q-node needs to be searched linearly in the TQ(B) each time (as there is no ordering of the trajectories in the list). TQ(Z) consistently outperforms the baseline by around orders of magnitude with the help of the efficient two-level index.
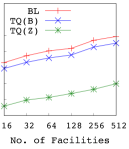
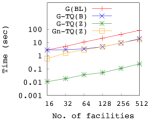
(iv) No. of facilities: As more computations are required to find the top- facilities from a higher number of candidate facilities, the runtime increases for each approaches at around the same rate as shown in Figure 7(d). Although TQ(B) consistently outperforms the baseline, the runtime of the baseline and TQ(B) may not suitable for an efficient ad-hoc route planning with a higher number of facilities. The TQ(Z) answers the query in the scale of milliseconds, and is around orders of magnitude faster than the baseline.
3) MaxRRST for multipoint datasets.
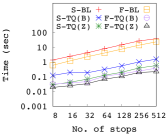
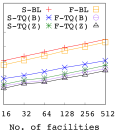
NYF Dataset: Since each user trajectory in the NY Foursquare-checkins dataset is a sequence of points, we evaluated MaxRRST queries using the two genaralized versions of the index: a Segmented TQ-tree (S-TQ) and Full trajectory TQ-tree (F-TQ) (please see Section III-A). In the S-TQ version, two consecutive check-ins of a user are considered as a segment, and all such segments of all users are indexed using the TQ-tree. For F-TQ, we consider the sequence of checkins in a day of a user as a single multipoint trajectory, and index these trajectories using the TQ-tree. For both approaches, we compare the performance for both the TQ-tree basic and the TQ-tree (Z-order) indexes.
Figure 8 shows the results of our approaches when varying (a) the number of stops and (b) number of facilities. The F-TQ based approaches perform better than S-TQ as the number of trajectories increases significantly in the segmented approach. The performance gap between the S-TQ-tree basic (S-TQ(B)) and the S-TQ(Z) is around order of magnitude, which is smaller than the previous experiments. The underlying reason is that for smaller segments, TQ-tree contains fewer trajectories in internal nodes of the TQ-tree, and thus z-order based performance gain cannot be achieved. For the same reason, we have found that the F-TQ based approaches outperform the S-TQ based approach. In all cases, our proposed approaches for processing MaxRRST using multipoint trajectories significantly outperform the baseline.

BJG dataset: We evaluate our algorithms on another multipoint trajectory dataset from the Geolife project. Since the dataset is small, we run the experiments with the segmented TQ-tree approach, and consider every pair of points as a single trajectory. Figure 9 shows that even for a small dataset our TQ-tree based approaches significantly outperform the baseline.
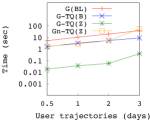
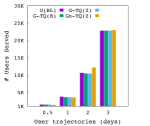
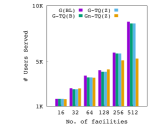
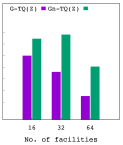
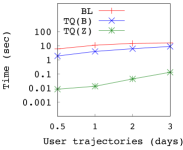
4) Evaluate MaxCovRST. We also evaluated the effectiveness and efficiency of our greedy algorithm, and compare between the competitive approaches Figure 10 shows the processing time for varying the number of users and facilities for processing MaxCovRST in NYT dataset. The G-TQ(Z) outperforms other approaches by a big margin.
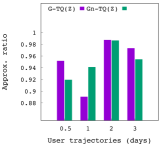
We also evaluate the quality of our approaches in terms of number of users served (Figure 10(b), Figure 10(d)) and as the approximation ratio with the exact solution (Figure 11). Experimental evaluation shows that the approximation ratio of our greedy TQ(Z) is close to the exact solution in most of the cases, and at least achieves ratio. The genetic algorithm (20 iterations) performs poorly in terms of the number of users served when the number of facilities is large (Figure 10(d)).
Index construction time: We evaluate the index construction cost of both TQ(B) and TQ(Z). The index construction for , , , and users trips of NYT data takes only 0.74, 0.95, 2.42, 3.74 secs, respectively for TQ(B), and 1.03, 1.86, 4,23, 9.95 secs, respectively for TQ(Z). The index construction times for the other datasets are also less than a second for both indexes.
VII Related Work
The related body of work mostly includes studies in trajectory indexing and query processing, facility location selection problems, and the route planning algorithms.
VII-A Trajectory Indexing and Queries
There have been studies to find user trajectories, including finding human mobility patterns [9], detecting taxi trajectories [10], etc. However, as we only use the user trajectories directly as input, the methods for constructing trajectories is outside the scope of this paper. Relevant studies on trajectories can be categorized mainly as: (i) trajectory search by similarity, (ii) trajectory search by point locations, and (iii) reverse nearest neighbor (RNN) queries on trajectories. Studies on each of these categories propose a variety of different indexes and algorithms. We also discuss other approaches addressing trajectory storage and retrieval in general.
Trajectory Search by Similarity. Frentzos et al. [11] define a dissimilarity metric between two trajectories and apply a best-first technique to return the most similar trajectories to a query trajectory. Chen et al. [12] address the problem of finding similar trajectories based on the edit distance. A comparative review of different measures of similarity is presented in [13]. Shang et al. [14] study a variant of this problem, where both location and textual attributes of the trajectories are considered.
The significance of each point in a query trajectory is taken into consideration in [4], where users can specify a weight for each point in the query trajectory to find the most similar trajectories using the weights in the similarity function. The general idea is to take each point along the query trajectory and check whether a circle with the point as centre and a threshold based on the user-defined weight as the radius, touches any data trajectory. Based on whether a trajectory is touched for each point or some points of the query trajectory, a lower and an upper bound of similarity is calculated, and different pruning techniques are applied. However, this approach is not directly amenable to our problem, as this computation needs to be repeated for each of the facilities, which will incur a high computational cost and unnecessary, repeated retrieval of trajectories. Moreover, this approach cannot efficiently answer the MaxCovRST query, where an user trajectory can be served jointly by multiple facility trajectories.
Trajectory Search by Point Location. Given a set of query points, Tang et al. [2] answer the nearest trajectories, where the distance to a trajectory is calculated as the sum of the distances from each query point to its nearest point in that trajectory. Han et al. [3] find the top- trajectories that are close to the set of query points with respect to traveling time. Given a set of query locations, finding the top- trajectories that best connect the points (either maintaining order or unordered) are studied. Each of these solutions use variations on the -tree to store trajectory points. As computing both the individual and partial service is important in our case, these techniques are not useful for our problem. Adapting these approaches would affect our pruning strategy greatly, resulting in higher computational complexity as it will not be easy to exclude the inter-node trajectories by indexing the points independently. Also, the queries (facilities) in our problem are also trajectories, not just points.
Reverse NN Trajectory Queries. Given a set of user trajectories , a set of facility (bus) trajectories , and a new facility trajectory , an RNN query returns the user trajectories from for which is one of the nearest facilities. Wang et al. [5] address this problem where they consider each user trajectory as transitions (trajectories with just pickup and drop-off points). In contrast to their work, we assume a user can be served by a facility if the trajectories (stop points) are sufficiently close. Moreover, their approach cannot be used to solve the MaxCovRST query, where a user trajectory can be served jointly by multiple trajectories.
Other Storage Techniques.
Other index structures, e.g., TrajTree [15], SharkDB [6] are also proposed to efficiently store trajectories. However, as segmentation of trajectories is required to construct TrajTree [15], this index is not amenable to our problem when computing the served portions of the individual user trajectories. SharkDB [6] is an in-memory column oriented timestamped storage solution used for indexing trajectory data. This index can support NN and window queries in the spatio-temporal domain, but cannot be directly applied to solve MaxCovRST where identifying trajectories can be partially served by a facility trajectory.
VII-B Facility Location Selection Problem
Several studies have investigated the problem of finding a location or a region in space to establish a new facility such that the facility can serve the maximum number of customers based on different optimization criteria. The min-dist selection problem finds a location for a facility such that the average distance from each customer to the closest facility [16] is minimized. A similar problem was presented by Papadias et al. [17], that finds a location that minimizes the sum of the distances from the users.
A Maximizing Bichromatic Reverse NN query [18, 19] finds the optimal region in space to place a new facility such that the number of customers for which is one of the NNs, is maximized.
These queries focus on point data or regions in space, thus they are not directly applicable to our problem on trajectories.
VII-C Route/Trip Planning
Bus network design is known to be a complex, non-linear, non-convex, multi-objective NP-hard problem [20]. Based on mobility patterns, there are a number of solutions for recommending driving route [21], discovering popular routes [22], or recommending modification of existing routes/introducing new routes [9]. The MaxRNNT query was proposed by Wang et al. [5], which focus on constructing an optimal bus route based on a Reverse NN trajectory query. Lyu et al. [23] propose new bus routes by processing taxi trajectories while other works [24, 21] aimed at constructing bus routes by analyzing hotspots of user trajectories.
Variants of ride-sharing problems have also received considerable attention in literature. Ma et al. [25] present techniques to dynamically plan taxi ride-sharing. Given a set of location preferences, recommending a travel trajectory that passes through those locations have been extensively studied [26].
In contrast, our proposed MaxRRST and MaxCovRST queries focus on finding a subset of the query trajectories that serve the highest number of users locally and globally, respectively. So unlike some of the aforementioned works that find the best route offline, we can support online query processing.
VIII Conclusion
In this paper, we have proposed a novel index structure, the Trajectory Quadtree (-tree) that utilizes a Quadtree to hierarchically organize trajectories into different Quadtree nodes, and then applies a z-ordering to further organize the trajectories by spatial locality inside each node. We have demonstrated that such a structure is highly effective in pruning the trajectory search space for processing a new class of coverage queries for trajectory databases: (i) Maximizing Reverse Range Search on Trajectories (MaxRRST); and (ii) a Maximum Coverage Range Search on Trajectories (MaxCovRST). We have evaluated our algorithms through an extensive experimental study on several real datasets, and demonstrated that our -tree based algorithms outperform common baselines by two to three orders of magnitude in terms of processing the coverage queries on trajectory databases. In future, we will investigate the effectiveness of the -tree for other variants of queries on trajectory databases.
References
- [1] ”IEEE”, “Test autonomous ride sharing,” spectrum.ieee.org/cars-that-think/transportation/self-driving/driveai-partners-with-lyft-for-autonomous-ride-sharing-pilot, [Online; accessed 17-09-2017].
- [2] L. A. Tang, Y. Zheng, X. Xie, J. Yuan, X. Yu, and J. Han, “Retrieving k-nearest neighboring trajectories by a set of point locations,” in SSTD, 2011, pp. 223–241.
- [3] Y. Han, L. Chang, W. Zhang, X. Lin, and L. Wang, “Efficiently retrieving top-k trajectories by locations via traveling time,” in ADC, 2014, pp. 122–134.
- [4] S. Shang, R. Ding, K. Zheng, C. S. Jensen, P. Kalnis, and X. Zhou, “Personalized trajectory matching in spatial networks,” VLDB J., vol. 23, no. 3, pp. 449–468, 2014.
- [5] S. Wang, Z. Bao, J. S. Culpepper, T. K. Sellis, and G. Cong, “Reverse k nearest neighbor search over trajectories,” CoRR, abs/1704.03978, 2017.
- [6] H. Wang, K. Zheng, X. Zhou, and S. W. Sadiq, “Sharkdb: An in-memory storage system for massive trajectory data,” in SIGMOD, 2015, pp. 1099–1104.
- [7] F. M. Choudhury, J. S. Culpepper, T. Sellis, and X. Cao, “Maximizing bichromatic reverse spatial and textual k nearest neighbor queries,” Proc. VLDB Endow., vol. 9, no. 6, pp. 456–467, 2016.
- [8] U. Feige, “A threshold of ln n for approximating set cover,” J. ACM, vol. 45, no. 4, pp. 634–652, 1998.
- [9] Y. Liu, C. Liu, N. J. Yuan, L. Duan, Y. Fu, H. Xiong, S. Xu, and J. Wu, “Exploiting heterogeneous human mobility patterns for intelligent bus routing,” in ICDM, 2014, pp. 360–369.
- [10] C. Chen, D. Zhang, P. S. Castro, N. Li, L. Sun, and S. Li, “Real-time detection of anomalous taxi trajectories from GPS traces,” in MobiQuitous, 2011, pp. 63–74.
- [11] E. Frentzos, K. Gratsias, and Y. Theodoridis, “Index-based most similar trajectory search,” in ICDE, 2007, pp. 816–825.
- [12] L. Chen, M. T. Özsu, and V. Oria, “Robust and fast similarity search for moving object trajectories,” in SIGMOD, 2005, pp. 491–502.
- [13] H. Wang, H. Su, K. Zheng, S. W. Sadiq, and X. Zhou, “An E ectiveness study on trajectory similarity measures,” in ADC, 2013, pp. 13–22.
- [14] S. Shang, R. Ding, B. Yuan, K. Xie, K. Zheng, and P. Kalnis, “User oriented trajectory search for trip recommendation,” in EDBT, 2012, pp. 156–167.
- [15] S. Ranu, D. P, A. D. Telang, P. Deshpande, and S. Raghavan, “Indexing and matching trajectories under inconsistent sampling rates,” in ICDE, 2015, pp. 999–1010.
- [16] Q. Jianzhong, Z. Rui, L. Kulik, D. Lin, and X. Yuan, “The min-dist location selection query,” in ICDE, 2012, pp. 366–377.
- [17] D. Papadias, Q. Shen, Y. Tao, and K. Mouratidis, “Group nearest neighbor queries,” in ICDE, 2004, pp. 301–312.
- [18] R. C. Wong, M. T. Özsu, P. S. Yu, A. W. Fu, and L. Liu, “Efficient method for maximizing bichromatic reverse nearest neighbor,” PVLDB, vol. 2, no. 1, pp. 1126–1137, 2009.
- [19] Z. Zhou, W. Wu, X. Li, M. Lee, and W. Hsu, “Maxfirst for maxbrknn,” in ICDE, 2011, pp. 828–839.
- [20] C. Chen, D. Zhang, N. Li, and Z. Zhou, “B-planner: Planning bidirectional night bus routes using large-scale taxi GPS traces,” IEEE Trans. Intelligent Transportation Systems, vol. 15, no. 4, pp. 1451–1465, 2014.
- [21] C. Chen, D. Zhang, Z. Zhou, N. Li, T. Atmaca, and S. Li, “B-planner: Night bus route planning using large-scale taxi GPS traces,” in PerCom, 2013, pp. 225–233.
- [22] Z. Chen, H. T. Shen, and X. Zhou, “Discovering popular routes from trajectories,” in ICDE, 2011, pp. 900–911.
- [23] Y. Lyu, C. Chow, V. C. S. Lee, Y. Li, and J. Zeng, “T2CBS: mining taxi trajectories for customized bus systems,” in INFOCOM, 2016, pp. 441–446.
- [24] Y. Huang, F. Bastani, R. Jin, and X. S. Wang, “Large scale real-time ridesharing with service guarantee on road networks,” PVLDB, vol. 7, no. 14, pp. 2017–2028, 2014.
- [25] S. Ma, Y. Zheng, and O. Wolfson, “T-share: A large-scale dynamic taxi ridesharing service,” in ICDE, 2013, pp. 410–421.
- [26] C. Zhu, J. Xu, C. Liu, P. Zhao, A. Liu, and L. Zhao, “Efficient trip planning for maximizing user satisfaction,” in DASFAA, 2015, pp. 260–276.