Survey of Water and Ammonia in Nearby galaxies (SWAN): Resolved Ammonia Thermometry, and Water and Methanol Masers in IC 342, NGC 6946 and NGC 2146
Abstract
The Survey of Water and Ammonia in Nearby galaxies (SWAN) studies atomic and molecular species across the nuclei of four star forming galaxies: NGC 253, IC 342, NGC 6946, and NGC 2146. As part of this survey, we present Karl G. Jansky Very Large Array (VLA) molecular line observations of three galaxies: IC 342, NGC 6946 and NGC 2146. NGC 253 is covered in a previous paper. These galaxies were chosen to span an order of magnitude in star formation rates and to select a variety of galaxy types. We target the metastable transitions of ammonia NH3(1,1) to (5,5), the 22 GHz water (H2O) () transition, and the 36.1 GHz methanol (CH3OH) () transition. We show evidence for uniform heating across the central kpc of IC 342 with two temperature components for the molecular gas of 27 K and 308 K, and that the dense molecular gas in NGC 2146 a temperature 86 K. We identify two new water masers in IC 342, and one new water maser in each of NGC 6946 and NGC 2146. The two galaxies NGC 253 and NGC 2146, with the most vigorous star formation, host H2O kilomasers. Lastly, we detect the first 36 GHz CH3OH masers in IC 342 and NGC 6946. For the four external galaxies the total CH3OH luminosity in each galaxy suggests a correlation with galactic star formation rate, whereas the morphology of the emission is similar to that of HNCO, a weak shock tracer.
1 Introduction
Galaxy evolution models without feedback overestimate star formation rates and efficiencies (e.g., Kauffmann et al. 1999). Energy and momentum injected into the interstellar medium (ISM) by stars is the dominant mechanism for impeding the formation of future generations of stars. Supernovae, stellar winds, photoionization, and shock heating are a few methods by which energy is injected into the ISM. Without these effects the ISM tends to rapidly collapse under its own gravity and form stars in less than a dynamical time, while too much feedback can completely disrupt giant molecular clouds (GMCs) (e.g., Kauffmann et al. 1999; Krumholz et al. 2011; Hopkins et al. 2011). Murray et al. (2010) suggest that each of these mechanisms dominates at different times during the life of GMCs, and Hopkins et al. (2014) show that feedback mechanisms combine non-linearly so that no individual mechanism dominates. Therefore it is necessary to check the feedback prescription in cosmological simulations against observations.
Since star formation is largely correlated with dense molecular gas (Gao & Solomon, 2004), the effect of feedback should, in part, be traced by the state of the dense molecular ISM. Radio interferometric observations with the VLA of nearby galaxies provide access to 10-100 pc scales related to GMCs. By using diagnostically important molecular tracers, it is possible to reveal the properties of the ISM on these relevant scales and test feedback.
| Galaxy | Distance | SFR | Linear Scale | Vsys |
|---|---|---|---|---|
| (Mpc) | (M⊙ yr-1) | (pc/ ″) | ( km s-1) | |
| IC 342 | 3.28 | 2.8 | 16 | 35 |
| NGC 253 | 3.50 | 4.2 | 17 | 235 |
| NGC 6946 | 5.89 | 3.2 | 29 | 50 |
| NGC 2146 | 15.2 | 20 | 74 | 850 |
The “Survey of Water and Ammonia in Nearby galaxies” (SWAN) is a survey of molecular and atomic transitions at centimeter and millimeter wavelengths of four galaxies: NGC 253, IC 342, NGC 6946, and NGC 2146. These galaxies were chosen to span a range of galactic host properties. Here we present results for key diagnostic molecular transitions from this survey including the ammonia (NH3) metastable transitions J=K (1,1) to (5,5), the 22 GHz water (H2O) () maser, and the 36 GHz methanol (CH3OH) () maser across the nuclei.
measurements of the NH3 metastable transitions provide for calculations of the rotation temperature, and, via Large Velocity Gradient (LVG) models, it is possible to estimate kinetic temperatures with reasonable precision (e.g., Ho & Townes 1983, Walmsley & Ungerechts 1983, Lebrón et al. 2011, Ott et al. 2005, Ott et al. 2011, Mangum et al. 2013, G17).
The 22 GHz H2O masers are collisionally excited, coming from three environments. The stellar masers are associated with mass loss stages of Young Stellar Objects (YSO’s) and Asymptotic Giant Branch (AGB) stars and are the least luminous L⊙ (e.g., Palagi et al. 1993). The strongest masers (20 L⊙), classified as megamasers, are typical of nuclear activity (e.g., Braatz et al. 1996). They are often found in the nuclear tori of AGN (e.g., Reid et al. 2009). Kilomasers are of intermediate luminosity between the stellar and megamasers, and are associated with strong star formation activity (Hagiwara et al., 2001). These could consist of many stellar class masers or be the low luminosity tail of the megamaser class (Tarchi et al., 2011). We use these masers as signposts of shocked material related to star formation.
The Class I, collisionally excited, 36 GHz CH3OH masers are new in the extragalactic context. Before this paper Class I CH3OH masers had been detected outside the Milky Way only in NGC 253 (Ellingsen et al. 2014 and G17) and Arp220 (Chen et al., 2015), where they are orders of magnitude more luminous than typical galactic counterparts. . In G17 we performed NH3 thermometry, and analyzed H2O and 36 GHz CH3OH masers, in the central kpc of NGC 253 based on Karl G. Jansky Very Large Array (VLA)111The National Radio Astronomy Observatory is a facility of the National Science Foundation operated under cooperative agreement by Associated Universities, Inc. observations. We detected the NH3(1,1) to (5,5) lines, and the (9,9) line. Using the same analysis we will use in this paper we uncovered a cool 57 K component and a warm 130 K component uniformly distributed across the molecular disk. There is no apparent correlation of temperature with tracers of dominant forms of feedback (weak or strong shocks, and Photon Dominated Regions (PDRs)). Within the centermost 100 pc there is evidence for NH3(3,3) masers, similar to NGC 3079 (Miyamoto et al., 2015). The strongest water maser in NGC 253 contains many components and shows evidence for an extension along the minor axis. This suggests a relationship with the outflow, in addition to the masers’ strong blueshifted velocity components. We also resolved the first detected extragalactic 36 GHz masers (Ellingsen et al., 2014) into five different sources. The emission is concentrated around the edges of expanding superbubbles. The morphology of the emission is similar to HNCO(), a weak shock tracer (Meier et al., 2015), suggesting the two molecules trace similar conditions.
In this paper we carry out a similar analysis across the other galaxies in the SWAN sample (IC 342, NGC 6946, and NGC 2146).
In §2 we describe the observational setups, and the data reduction and imaging process. In §3 we report our measurements of the NH3, H2O, and CH3OH lines for each galaxy individually. In §4 we discuss the analysis of the NH3 lines and derived temperatures for each galaxy where possible; in addition we generate LVG models for IC 342. We also discuss the H2O and CH3OH masers in each galaxy. In §5 we incorporate the results from G17 and discuss the relevance of the survey as a whole. Finally, in §6 we summarize our findings.
2 Observations and Data Reduction
IC 342 and NGC 6946 were observed with identical frequency setups of the VLA (project code: 10B-161). The correlator was set up to cover frequency ranges 21.922.3 GHz, 23.623.7 GHz, and 24.124.5 GHz with 500 kHz wide channels (K-band receiver), and 26.827.9 GHz and 36.037.0 GHz with 1 MHz wide channels (Ka-band receiver). The galaxy NGC 6946 was observed with two pointings with the same RA(J2000): 20h 35m 52.336s and different DEC(J2000): +60° 09’ 32.2100” and +60° 08’ 56.210”. The galaxy NGC 2146 was observed with the same correlator setup as NGC 253 in G17 (project code: 13A-375), with 250 kHz channels, but was not observed in Ka-band. All three galaxies were observed in the C configuration of the VLA. As in G17 we target the metastable NH3 lines from J=K (1,1) to (5,5), the 22.2351 GHz H2O() maser, and the 36.1693 GHz CH3OH() maser. NGC 2146 did not get observed in Ka-band, so no analysis of the 36 GHz CH3OH maser is presented for this galaxy.
We calibrated and imaged the data in the Common Astronomy Software Applications (CASA) package version 4.6.0 (McMullin et al., 2007). For all three galaxies J0319+4130 was observed as a bandpass calibrator. For the complex gain and flux density calibrators we used J0304+6821 and 3C147 for IC 342, J2022+6136 and 3C48 for NGC 6946, and J6726+7911 and 3C147 for NGC 2146. Continuum subtraction was performed in the domain by selecting line free channels in each sub-band to define the continuum model. Image cubes were made with natural weighting, CLEANed to rms noise, primary beam corrected, and smoothed to common spatial and spectral resolutions per galaxy. All velocities in this paper will be in the LSRK frame unless otherwise stated. .
| Transition | Rest Frequency |
|---|---|
| (GHz) | |
| H2O() | 22.2351 |
| NH3 (1,1) | 23.6945 |
| NH3 (2,2) | 23.7226 |
| NH3 (3,3) | 23.8701 |
| NH3 (4,4) | 24.1394 |
| NH3 (5,5) | 24.5330 |
| CH3OH () | 36.1693 |
| Molecule | Spatial Resolution | Spectral Resolution | RMS noise |
|---|---|---|---|
| ″ | km s-1 | mJy beam-1 channel-1 | |
| IC 342 | |||
| H2O & NH3 | 1.2 | 7 | 0.31 |
| CH3OH | 1.0 | 7 | 0.45 |
| NGC 6946 | |||
| H2O & NH3 | 1.5 | 7 | 0.30 |
| CH3OH | 1.0 | 7 | 0.42 |
| NGC 2146 | |||
| H2O & NH3 | 1.5 | 4 | 0.70 |
3 Results
We report the results from each galaxy separately in the sections below. Our analysis will focus only on NH3, H2O, and CH3OH lines . We identified the emission by peaks in the peak flux maps. We have chosen a conservative detection threshold with an integrated flux of 20 K km s-1. NH3 emission was primarily identified using the NH3(3,3) peak flux maps as NH3(3,3) is usually the strongest line. We also search the NH3(1,1) peak flux map for emission, because being the lowest energy transition it is the easiest to excite.
3.1 IC 342
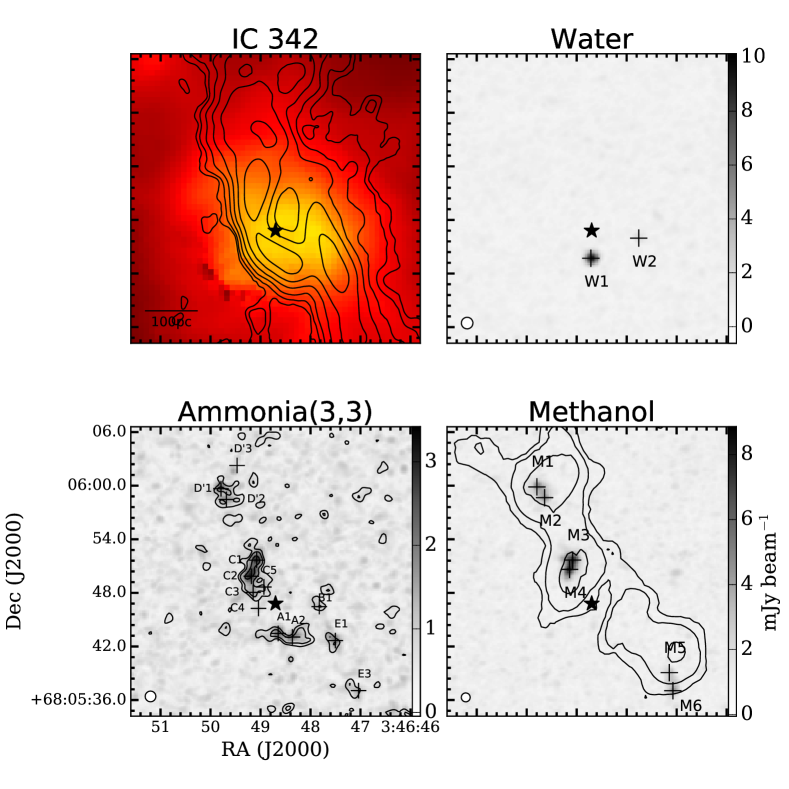
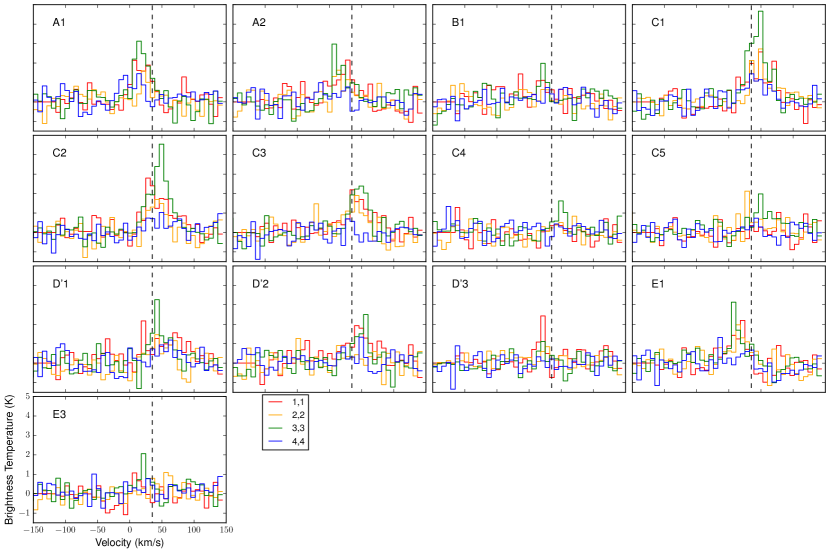
The central kpc of IC 342 consists of two molecular spiral arms that terminate in a central molecular ring (Figure 1). Six main molecular clouds have been identified and discussed in the linterature: A, B, C, D, D′, and E (e.g., Downes et al., 1992, Meier et al., 2000, Meier & Turner, 2005), and these are all detected in NH3 in our observations. The northern arm consists of the C, D, and D′ clouds, spanning velocities from 44 km s-1 to 62 km s-1, and the southern arm consists of the A, B, and E clouds, spanning velocities from 13 km s-1 to 27 km s-1. In some clouds we have observed substructure resulting in multiple peaks in the NH3(3,3) peak flux map (Figure 1). The NH3 spectra are shown in Figure 2. We utilize the NH3(3,3) line for identification because it is often the strongest transition. In cases where we do not detect NH3(3,3) we use the NH3(1,1) line. We do not detect the NH3(5,5) line and not all metastable transitions J=K 4 are detected in all locations. We have extracted spectra from each of these peaks and fit single Gaussians to the spectra. We do not detect the hyperfine NH3 lines. We adopt the naming convention from Meier & Turner (2001). We do not detect the E2 region from Meier et al. (2011) in NH3, however we detect a few new peaks in the A, C, D′, and E clouds. Their positions and extracted integrated flux, line center, FWHM, and peak flux are tabulated in Table 4.

We have identified two water masers in IC 342: IC 342-W1 in the A cloud and IC 342-W2 in the B cloud (Figure 1). The spectra are shown in Figure 3. Water masers in IC 342 have already been investigated by Tarchi et al. (2002). They found a single narrow water maser to the east of the B cloud ( = 03h46m46.3s, =+68°05′46″, with a positional uncertainty of ″). We do not detect this maser. It is likely variable as they observed a peak flux increase of 100% over 20 days. Our masers have narrow spectral profiles, being almost single channel (7 km s-1) detections, and have isotropic luminosities of 0.02L⊙. The spectrum of W1 was Hanning smoothed to reduce Gibbs ringing. The properties of the spectral profiles are listed in Table 5.
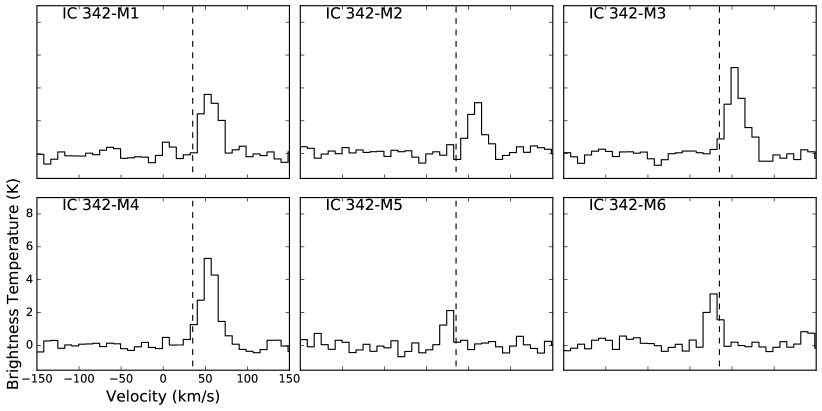
We now add IC 342 to the list of galaxies with detected 36 GHz CH3OH emission. We detect six spatially resolved 36 GHz CH3OH sites in IC 342. There are two in each of the D, C, and E clouds (Figure 1). The spectra are shown in Figure 4 and the extracted properties are shown in Table 6. These masers have isotropic luminosities of order 10-2 L⊙, about 10-100 times less luminous than the masers in NGC 253 (G17).
3.2 NGC 6946
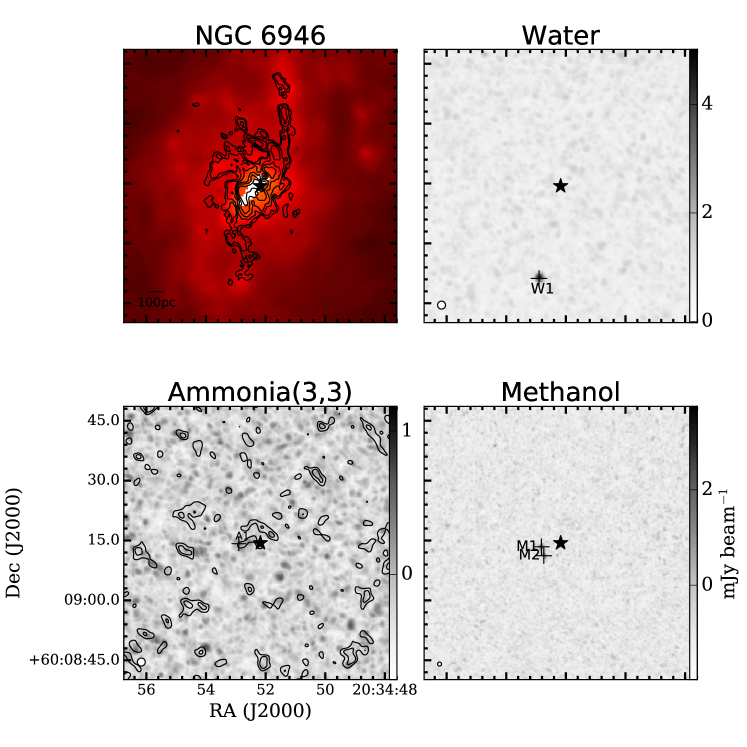
The molecular gas in the central kpc of NGC 6946 (Figure 5) shows spiral structure with a nuclear bar that feeds the nuclear starburst, and three clumps near the dynamical center (Schinnerer et al., 2006). These structures are not detected in our NH3 observations. Our only detection is the NH3(3,3) line 4.5″ from the dynamical center (Figure 5). The integrated line intensity is 21.83.8 K km s-1, just above our specified detection threshold. The line properties are listed in Table 4 and the spectrum is shown in Figure 6.
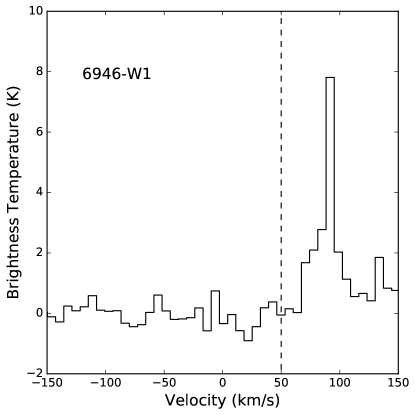
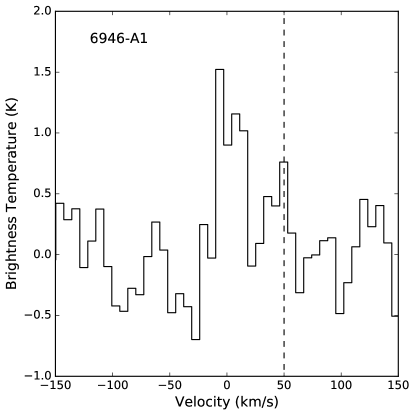
We observe a single water maser in NGC 6946. The spectrum is narrow with a fitted FWHM of 11 km s-1 and an isotropic luminosity of 0.042 L⊙ (Figure 7). It is located 22″ from the center of the galaxy in the southern spiral arms (Figure 5). Its spectral properties are collated in Table 5.
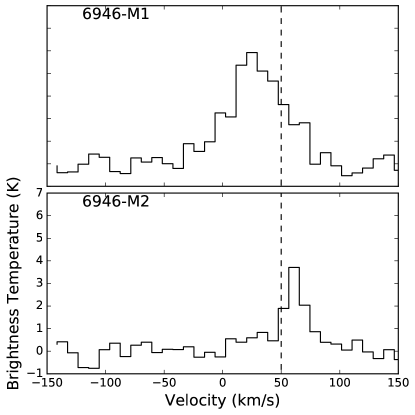
We also expand the detections of extragalactic 36 GHz CH3OH masers to include NGC 6946. There are two masers located in the southern clump identified by Schinnerer et al. (2006). Their spectral properties are available in Table 6 and the spectra are shown in Figure 8. They are one order of magnitude more luminous than the masers in IC 342, more comparable to the ones found in NGC 253.
3.3 NGC 2146
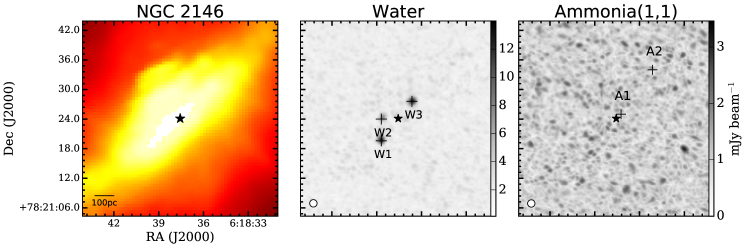
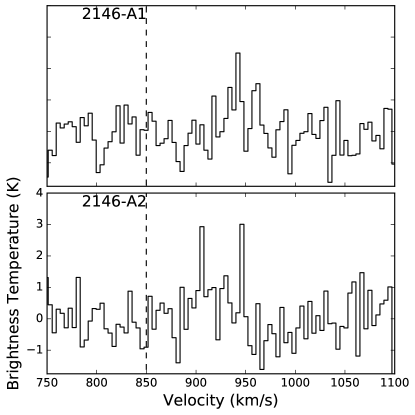
This peculiar spiral galaxy (Figure 9) has the strongest star formation activity in our survey (20 M⊙ yr-1; Gao & Solomon (2004)). We detect the NH3(1,1) line in two locations about the center of the galaxy (tabulated in Table 4). The spectra are shown in Figure 10. The peaks (Figure 9) do not coincide with the molecular outflow or superbubbles found by Tsai et al. (2009).
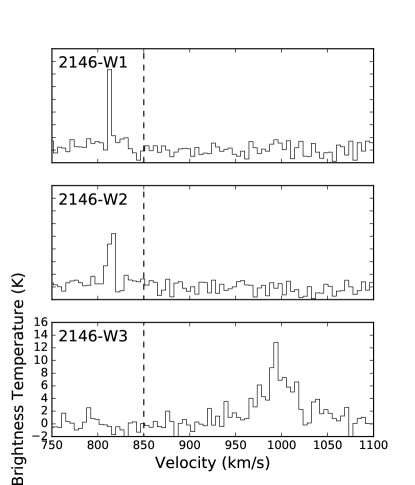
There are three distinct locations with H2O masers, all within 7″ from the 22 GHz continuum peak (Figures 9 and 11). Masers 2146-W1 and 2146-W2 are narrow, almost single channel (10 km s-1 FWHM), detections whereas 2146-W3 has a broad profile with a FWHM of 48 km s-1. The H2O masers in NGC 2146 are more luminous than those in the other galaxies. Each maser’s luminosity is 0.1L⊙, classifying them as kilomasers. 2146-W3 is the most luminous at 2.1 L⊙. The fitted line profiles are listed in Table 5. 2146-W2 and 2146-W3 were observed by Tarchi et al. (2002b) (labeled respectively 2146-A and 2146-B; Tarchi et al., 2002b ) and are spatially coincident with optically thick H ii regions. 2146-W1 has not been previously detected. The dense, warped molecular ring within 2 kpc of the center has rotation velocities spanning 250 km s-1 about the systemic velocity of 850 km s-1 (Tsai et al., 2009). W1 has a velocity of 831 km s-1, W2 has a velocity of 832 km s-1, and W3 has a velocity of 1013 km s-1. All three masers have velocities consistent with the molecular ring.
4 Discussion
4.1 Temperature Determination of the Dense Molecular Gas
The metastable NH3 lines are close in frequency with less than 5% difference between the (1,1) and (5,5) lines. This means that the relative amount of resolved out flux among states is negligible if they trace the same gas, and that we probe similar sensitivities and spatial scales. If the gas is optically thin, a column density of the upper state can be calculated from the main beam brightness temperature (Tmb), frequency in GHz (), and J,K angular momentum quantum numbers:
| (1) |
Rotational temperatures can then be determined from any pair of metastable transitions J and J′ assuming differences in excitation temperatures between states are negligible (e.g., Henkel et al., 2000, Ott et al., 2005, Mangum et al., 2013 and G17):
| (2) |
Where (J,J) is the column density of the upper inversion state of the (J,J) transition in cm-2, is the difference in energy between J and J′ states in Kelvin, and is the statistical weight of the NH3 species. = 1 for para-NH3 where Jn (where n is an integer), and = 2 for ortho-NH3, where J=3n with the (0,0) state belonging to ortho-NH3.
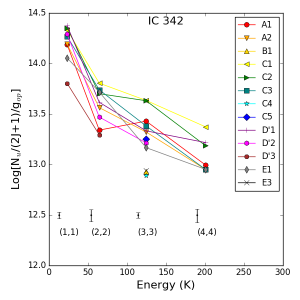
A Boltzmann diagram plots the log of the weighted column densities on the y-axis versus the energy above ground state in Kelvin on the x-axis. The slopes between transitions then represent the inverse of the rotational temperature of the gas with colder gas represented by steeper slopes (Equation 2). IC 342 is the only galaxy in our sample where we have enough NH3 detections to construct a Boltzmann diagram, shown in Figure 12. We do not construct Boltzmann diagrams for NGC 6946 and NGC 2146. In NGC 2146 we detect only the NH3(1,1) transition. Toward NGC 6946 we detect only the NH3(3,3) line near the center.
The rotational temperature serves as a lower limit to the true, i.e., kinetic temperature, of the gas. To estimate the kinetic temperature, we apply the approximation to Large Velocity Gradient models (LVG) by Ott et al. (2005) for the (1,1) and (2,2) line ratio, and from G17 for the (2,2) and (4,4) line ratio. In cases where we have only one measured transition we provide an upper limit (Table 7).
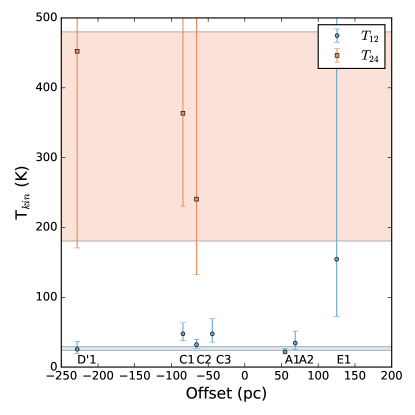
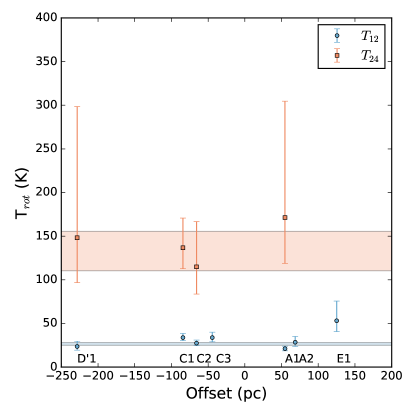
Figure 12 plots the rotational temperatures versus the distance from the dynamical center ( = 03:46:48.7, = +68 05 46.8; Turner et al., 1992). We fit a single temperature across all locations weighted by the larger of the 1 asymmetric uncertainties from the individual temperatures. The blue and red shaded areas represent the average best fit temperatures weighted by the larger of the asymmetric errors across all detected regions from the (1,1) to (2,2) and (2,2) to (4,4) ratios, respectively. In IC 342 the best fit rotational temperatures are T12=262 K and T24=13222 K. Following the method from G17 we convert to kinetic temperatures, finding Tkin12=273 K and Tkin24=308171 K. Tkin24 for A1 is not included as we can only determine a lower limit. This is because the conversion to Tkin exceeds the bounds of the rotation-to-kinetic temperature fit: the conversion factor from rotation to kinetic temperatures were fit using collisional coefficients from =0 to 300 K, with the fits then extrapolated out to =500 K (Ott et al., 2005 and G17).
Similar to NGC 253 there are two representative temperature components and there appears to be no spatial gradient in temperatures across the central kpc. In Figure 13 we plot the kinetic temperatures as a function of offset from the dynamical center. The cool 27 K component is evenly distributed across the disk. The 308 K component also appears to be uniformly distributed across the disk, however the large uncertainties may hide a gradient, and in many locations we do not detect the NH3(4,4) line so the warm component is poorly sampled.
Meier et al. (2011) . They analyze the dense gas in IC 342 using HC3N . They first attempt to explain the dense gas conditions with a uniform density and temperature. These models drastically over-predict the amount of dense gas in IC 342 by 300%400% for uniform cold dense gas with T 30 K. In order to reproduce the observed masses derived from an optically thin isotopologue of CO, C18O, they invoke a two-density component model of the gas.. For simplicity they assume that Tkin is the same for both components (30 K). They find that the ratio of dense gas to total gas is (MM) 0.7 concentrated in a dense, low filling factor component. We have measured two temperature components in the center of IC 342, 273 K and 308171 K, with an average, weighted by the average column densities per location of the estimated NH3(0,0) and NH3(4,4) lines (respectively 3.0 cm-2 and 6 cm-2), of 7433 K . If the cold dense component has a temperature of 27 K, then there must be more gas in the warm diffuse component to arrive at an average temperature of 74 K. For a single temperature of 70 K Meier et al. (2011) predict a dense gas fraction of 0.09
Compared to NGC 253 (G17) there appears to be a larger difference between the cold and warm temperature components in IC 342. The cool gas is cooler (IC 342: 273 K vs. NGC 253: 574 K) and the warm gas is the same temperature within the errors (IC 342: 308171 K vs. NGC 253: 1348 K) . Both galaxies show an even distribution of temperatures across the central kpc.
The kinetic temperatures in NGC 2146 are only upper limits. Using a detection threshold of 20 K km s-1 for NH3(2,2) line, for the A1 cloud we derive an upper limit of 89 K and for the A2 cloud, 23 K. Without detections of the other NH3 lines we cannot constrain the temperature of the gas any further. There may also be a warmer component we cannot see. More sensitive observations are necessary in order to derive temperatures via NH3 thermometry.
4.1.1 Possible NH3(3,3) masers in IC 342
4.1.2 IC 342 LVG Fitting with RADEX
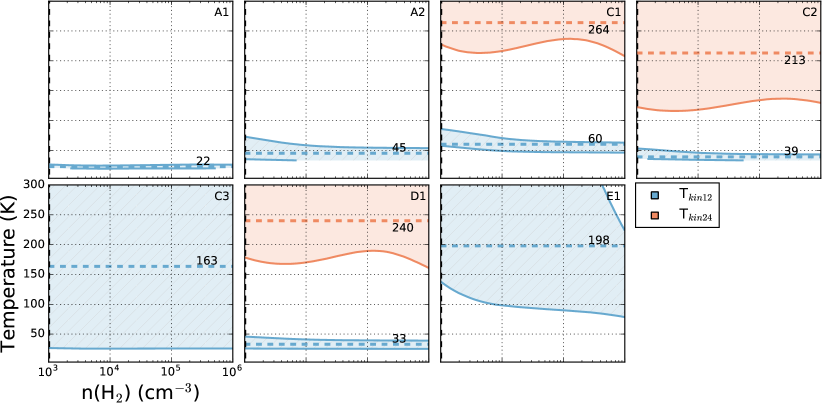
We can also perform direct fitting of LVG models in IC 342 following the procedure from G17. We perform this as a check of the approximations to LVG models described earlier. We use RADEX (van der Tak et al., 2007) with collisional coefficients from the LAMBDA database (Schöier et al., 2005). We generate a grid from 0 to 300 K in steps of 3 K and sample the collider density (H2) logarithmically from 103 to 106 cm-3 with 100 steps. The LVG approximation to radiative transfer accepts as the third axis (column density divided by line width). We use a line width of 34 km s-1 for IC 342 and sample the column density from 1013 to 1017 cm-2 with 100 steps. The fits were carried out where we made detections of the NH3(1,1), (2,2) and (4,4) lines. The results are shown in Figure 14. Following G17 we plot the median temperature with a solid dashed line surrounded by 1 confidence contours. The cool component derived from the (1,1) to (2,2) ratio is shown in blue, and the warm component from the (2,2) to (4,4) line ratio is shown in red. The fits are unconstrained along the density axis (x-axis) in tune with NH3 not being a good density probe. The fit to the (2,2) to (4,4) ratio is unconstrained along the temperature axis, therefore we can only provide a lower limit for those locations of 115 K. The sites C3 and E1 are also unconstrained along the temperature axis, therefore they are removed from the calculation of the average temperature from the (1,1) to (2,2) ratio. The average temperature, weighted by the larger of the asymmetric errors, is 272 K. These results are broadly consistent with the previous subsection.
4.2 H2O Masers
Water masers span a large range of luminosities and can be variable on time scales of weeks (e.g., Palagi et al., 1993, Claussen et al., 1996 and Braatz et al., 1996). The water masers in all three galaxies are narrow, single peak spectral features with FWHM of 10 km s-1. In IC 342 and NGC 6946 the isotropic luminosities of the masers are of order 0.01 L⊙. These are likely individual YSO or AGB stars (e.g., Palagi et al., 1993). The more luminous of the two masers seen in IC 342 (W1) is located in the A cloud close to A1 and the other (W2) is located in the B cloud close to B1. The B cloud is a site of a young star forming region (Meier & Turner, 2005), supporting a possible origin of a YSO. The A cloud is a weaker site of star formation and is dominated by PDRs, so it is likely in a slightly more evolved state (Meier & Turner, 2005). Therefore the W2 maser may be either a stray YSO or an AGB star. Neither of these masers has been previously observed, though this is likely due to low sensitivity or variability (10 mJy rms in Tarchi et al., 2002).
In NGC 6946 the maser is located in the southern spiral arm about 350 pc from the galaxy center. The luminosity is 0.042 L⊙, which is consistent with stellar maser rather than kilomaser luminosities. Stellar H2O masers are highly variable (e.g Claussen et al., 1996) and can be found in nuclear regions and spiral arms of galaxies. The lack of detections in the center of NGC 6946 is thus unsurprising.
NGC 2146 has the most luminous masers in our sample of galaxies. All three of these masers have luminosities greater than 0.1 L⊙ classifying them as kilomasers. Observed in June of 2001, masers W2 and W3 had luminosities of 0.5 L⊙ and 1.5 L⊙ respectively, while W1 was not detected (Tarchi et al., 2002). We observed these masers in July of 2013. We report isotropic luminosities of 0.455 L⊙ and 2.087 L⊙ for 2146-W2 and 2146-W3 respectively, an increase of 33% for 2146-W3, whereas 2146-W2 has the same flux as in 2002, but was variable before that (Tarchi et al., 2002b). We calculate a luminosity of 0.351 L⊙ for 2146-W1. The appearance of this maser indicates that it is variable. Including the masers from NGC 253 (G17), the galaxies with the most vigorous star formation host the kilomaser class of H2O masers (253-W1, 2146-W2) while the lower luminosity stellar masers are more ubiquitous in the SWAN sample (253-W3, IC342-W1 and W2, and 6946-W1).
4.3 CH3OH Masers
The 36 GHz CH3OH() maser was first detected in an extragalactic context by Ellingsen et al. (2014) in NGC 253. These masers were resolved in G17 and evidence was given for correlation with weak shocks as the emission is morphologically similar to HNCO, which is unique compared to other molecular tracers (Meier et al., 2015). We have expanded the set of galaxies with 36 GHz CH3OH masers to include IC 342 and NGC 6946.
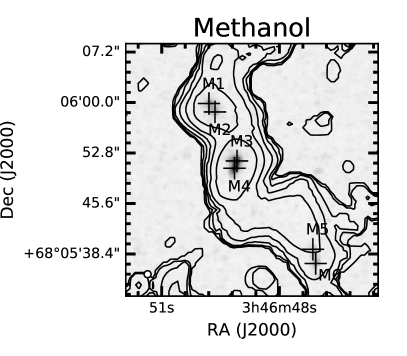
There are six sites with 36 GHz CH3OH emission in IC 342 coincident with the D′, C and E clouds. The CH3OH emission is two orders of magnitude less luminous than the strongest emission found in NGC 253 (G17). As shown in Figure 1, similar to NGC 253, the morphology of the masers roughly matches that of HNCO emission mapped by Meier & Turner (2005), where they argue for weak shocks along the leading edges of the spiral arms. The morphological similarity to HNCO in NGC 253 and IC 342 implies that these two molecules are related.
We compare with the thermal methanol lines at 96 GHz from Meier & Turner (2005) in Figure 15. The similarity of the morphology of the 36 GHz lines with thermal lines is curious and might suggest that we are observing thermal 36 GHz emission. The strongest maser found in a survey of the inner 100 pc of the Milky Way by Yusef-Zadeh et al. (2013) (number 164) is 470 Jy km s-1. The most luminous site in IC 342 is M4 with a luminosity of 0.08 L⊙. At the distance of the galactic center ( 8 kpc) this would equate to a 33,000 Jy km s-1 source, suggesting that this is indeed strong maser emission. Hence, if 36 GHz CH3OH is masing, as the brightness suggests, then both thermal and masing CH3OH must trace elevated overall CH3OH abundances, likely associated with weak shocks (e.g., Meier & Turner, 2005)
There are two sites with 36 GHz CH3OH masers in NGC 6946. These lie in the southern clump described in Schinnerer et al. (2006). The two masers are an order of magnitude more luminous than those in IC 342, and of similar luminosity to the masers in NGC 253. It is possible that some portion of the emission is thermal, however because they are more luminous it is likely that these are masers. The association with weak shocks in NGC 253 and IC 342 suggests that the southern clump is shocked by the inflow of material along the bar.
5 The Nature of Galaxy Nuclei from SWAN
We have observed the central kpc of four star forming galaxies, NGC 253, IC 342, NGC 6946, and NGC 2146 in NH3, H2O, and CH3OH. These lines have shed light on the heating and cooling balance in the dense molecular ISM, the nature of class I masers (H2O and CH3OH) in an extragalactic context, and star formation feedback effects on 10’s of pc scales.
5.1 Heating and Cooling Balance
Individual feedback effects (e.g shocks, PDRs) do not appear to dominate the heating and cooling balance of the ISM on GMC scales. The uniformity of the two temperature distributions in NGC 253 and IC 342 show that shocks and PDRs do not cause variations in the temperature of the dense molecular ISM across kpc scales. It is important to note that the NH3 molecule could be destroyed where feedback dominates (NH3 is photodissociated at 4.1 eV Suto & Lee 1983), thus we would not be able to use NH3 as a temperature probe. The edge of the C cloud and the B cloud in IC 342 may be good examples of this. We do not detect the edge of the C cloud closest to the PDRs or the B cloud in NH3(1,1), (2,2) or (4,4). NH3(3,3) is a stronger emission line and more easily detected. We can see that there is NH3 in the clouds but it may be depleted by ionizing photons,
Should the NH3 molecule survive in these environments it presents a picture where the heating and cooling balance of the molecular ISM is dominated by larger scale effects. Perhaps the distribution of temperatures is governed by cosmic rays or turbulent heating. In NGC 253 the FWHM of the line is more or less constant over the central kpc (e.g. G17 and Leroy et al. 2015) giving credence to the idea that the gas might be turbulently heated as the temperature is also evenly distributed. In IC 342 the FWHMs of the NH3 lines change drastically from cloud to cloud, from 20 km s-1 in the A cloud to 60 km s-1 in the D cloud. If turbulent heating is a dominant factor we might naively assume that the D cloud would be warmer, however the temperatures remain roughly the same from cloud to cloud in IC 342.
Ginsburg et al. (2016) analyzed the temperatures of the dense molecular gas in the central 300 pc of the Milky Way using the H2CO (formaldehyde) line ratio. Here we use this study as a lens to understand our dense gas temperatures. As they have only a single line ratio they do not measure two temperature components per location. H2CO also has a higher critical density than NH3, cm-3 compared to cm-3, meaning we are more sensitive to intermediate densities. They show that cosmic ray ionization rates (CRIRs) must be relatively low for cold gas ( 60 K) to survive and that temperatures in the Milky Way can be explained by turbulent heating alone. They describe the temperature distribution as mostly uniform with temperatures 50-120 K, with temperatures generally increasing towards denser clouds.
Nine of 13 galaxies show multiple temperature and velocity components in Mangum et al. (2013). They used single pointings from the Green Bank Telescope to detect NH3 lines. The two component gas model appears to prevail in star forming galaxies. These galaxies appear to have uniform distributions of temperatures (e.g Ginsburg et al. 2016, G17, and this paper), though not all of these galaxies have been observed with GMC scale resolution. Meier et al. (2011) presents evidence for two density components in IC 342. Considering these studies we imagine two pictures. One, where our galaxies are dominated by turbulent heating, having diffuse (n cm-3) molecular gas temperatures less than 60 K and warmer dense clumps, and the CRIR does not dominate the heating and cooling balance. Two, there is a cold dense component that cosmic rays cannot penetrate (e.g. Clark et al. (2013)) and a warm diffuse component (n cm-3) heated by cosmic rays. This may vary from cloud to cloud and galaxy to galaxy and would be revealed by resolving clump substructure
The difference in the two temperature components changes fairly drastically between galaxies. In NGC 253, the difference between the cool and warm component is 7712 K and in IC 342 it is 281 174K. Perhaps increased turbulence in NGC 253 driven by the enhanced star formation mixes the two temperature components. Though if this were the case, then we might expect to see warmer gas in NGC 2146 which has the highest star formation rate of our survey. This may also be a resolution effect: the larger the physical scale of the beam the more sensitive we are to diffuse gas (Figure 11 in Ginsburg et al. 2016). More sensitive observations are needed to do proper NH3 thermometry in NGC 2146.
5.2 Maser Luminosities and Star Formation
In Figure 16 we plot luminosities of all the water masers against the star formation rate surface density (SFRD), calculated from the corresponding pixel in the 22m WISE Atlas images. (Jarrett et al., 2013). A single WISE pixel represents the beam averaged emission at that location. The FWHM of the point spread function of the WISE Atlas images is 11.99″11.65″. We do not observe a general increase in H2O maser luminosity with increased SFRD.
We observe two classes of masers, the stellar masers and the kilomasers. The kilomasers exist in the galaxies classified as starbursts. The kilomasers have luminosities 0.1 L⊙ and can have many spectral components. They also correspond with the sources with larger star formation rates. The stellar masers are more evenly distributed across the sample of galaxies and have narrow single velocity components with luminosities 0.1 L⊙. Our results are consistent with the current classification of H2O masers (Hagiwara et al., 2001). We do not observe any megamasers as none of our galaxies hosts an AGN. In G17 we show evidence for a possible extension of water masers in NGC 253 along the minor axis. The extension is likely due to star formation and not an AGN.
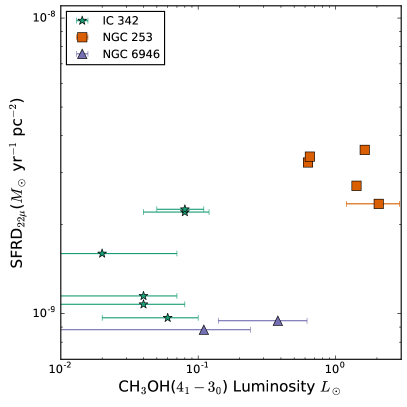

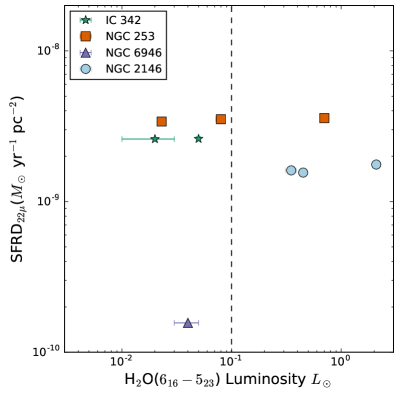
In the three extragalactic cases where 36 GHz CH3OH emission was targeted it was detected. The ubiquitous detections open up a new possibility for probing shocked environments in the extragalactic context. As shown in Figure 17, the luminosity of an individual maser does not apparently scale with local SFRD. However, as shown in Figure 17, for all galaxies external to the Milky Way with detected 36 GHz masers, we plot the global star formation rate versus the total 36 GHz CH3OH luminosity. There appears to be a close relationship between the total luminosity of the 36 GHz line and the global star formation rate, albeit we have only four galaxies. This is perhaps unsurprising as these galaxies have large reservoirs of molecular gas, but the result also suggests little variability of the masers.
Yusef-Zadeh et al. (2013), Ellingsen et al. (2014) and Chen et al. (2015) discuss the possibility that cosmic rays release CH3OH into the ISM resulting in higher abundances towards a galaxy’s center as the cosmic ray density increases, however if the cosmic ray density is too high CH3OH molecules will be destroyed. Should the cosmic ray density be highest in the center of galaxies, the concentration of masers at the edge of the molecular bar in NGC 253 (Ellingsen et al., 2014 and G17) and IC 342 would be consistent with this idea. However in Arp 220 Chen et al. (2015) observe a CH3OH X-ray correlation. They take X-ray emission to reflect the cosmic ray density. If ture, this would suggest that CH3OH is not destroyed in regions where the cosmic ray density is high. At this point then, this idea is difficult to test via extragalactic CH3OH observations.
The similar morphology of the HNCO emission and CH3OH masers in NGC 253 and IC 342 further supports a different generating mechanism as the HNCO molecule appears to be anti-correlated with PDRs. Meier & Turner (2005) and Meier et al. (2015) suggest that weak shocks and/or ice mantle evaporation are related to the HNCO and CH3OH emission. In IC 342 they suggest the emission is reflective of shocks along the leading edge of the molecular bar. Because of the morphological similarities between HNCO and 36 GHz CH3OH, the physical conditions that give rise to emission are likely related. In Arp220 the CH3OH is correlated with the X-ray plume generated by a starburst super-wind (Chen et al., 2015). It is possible that the CH3OH is related to the shocks driven by the wind. In G17 we suggest the CH3OH masers are related to shocks in expanding superbubbles. So far, a relationship between 36 GHz CH3OH emission with weak shocks would be a more consistent picture across all galaxies.
It is not yet known what fraction of the emission in these galaxies is thermal vs. non-thermal (maser). It’s possible there are multiple conditions that give rise to 36 GHz emission or that separate conditions give rise to thermal versus maser emission. More in-depth studies are critical to uncover the pumping of the maser and the nature of the 36 GHz CH3OH line in the extragalactic context.
6 Summary
With this paper we complete the analysis of the H2O, NH3, and CH3OH lines in the Survey of Water and Ammonia in Nearby galaxies (SWAN). The primary results are:
-
1.
We have detected metastable NH3 transitions in IC 342, NGC 6946, and NGC 2146. In IC 342 the two molecular spiral arms and the central molecular ring are traced in NH3(1,1) to (4,4). We make only one detection of the NH3(3,3) line in NGC 6946 near the center
- 2.
-
3.
We detect a uniform 273 K dense molecular gas component across the central kpc of IC 342. We also detect a 308171 K component with indications of a uniform distribution. The direct LVG models are consistent with our LVG approximation. The temperatures of the clouds do not appear to be affected by the nuclear PDRs given the flat temperature distribution across the C cloud. We also provide evidence for weak NH3(3,3) masers in the A and C clouds. The dense molecular gas in NGC 2146 must be fairly cold, with T K, and there is no evidence for a hot component.
-
4.
We have detected two new stellar H2O masers in IC 342, one in NGC 6946, and three H2O kilomasers in NGC 2146 of which one was previously undetected. Across the entire SWAN sample the kilomasers are found in the two starburst galaxies NGC 253 and NGC 2146, while the lower luminosity stellar masers are found more uniformly across the sample.
-
5.
We report the first detection of 36 GHz CH3OH in IC 342 and NGC 6946. This expands the number of galaxies beyond the Milky Way with 36 GHz CH3OH emission to four including Arp220 (Chen et al., 2015). The morphology in IC 342 and NGC 253 is similar to HNCO emission, implying that weak shocks may pump the maser. It is possible there is a mixture of thermal and non-thermal (maser) emission that high resolution observations will separate. The luminosity of the emission appears to roughly scale with the global strength of the star formation activity.
| Source | Transition | RA (J2000) | DEC (J2000) | |||||
|---|---|---|---|---|---|---|---|---|
| hh:mm:ss | ° ′ ″ | (K km s-1) | ( km s-1) | ( km s-1) | (K) | |||
| IC 342 | ||||||||
| A1 | (1,1) | 03:46:48.6 | 68:05:43.4 | 70.55.0 | 21.62.1 | 32.54.9 | 2.00.3 | |
| (2,2) | 22.33.8 | 26.81.6 | 12.53.9 | 1.70.5 | ||||
| (3,3) | 86.74.3 | 21.81.5 | 28.13.5 | 2.90.2 | ||||
| (4,4) | 22.13.9 | 18.61.9 | 14.04.4 | 1.50.4 | ||||
| A2 | (1,1) | 03:46:48.4 | 68:05:43.0 | 71.16.7 | 26.23.3 | 43.57.8 | 1.50.2 | |
| (2,2) | 37.27.1 | 22.32.8 | 27.48.9 | 1.30.4 | ||||
| (3,3) | 67.65.5 | 19.02.4 | 32.05.6 | 2.00.3 | ||||
| B1 | (3,3) | 03:46:47.8 | 68:05:46.4 | 27.53.7 | 25.41.6 | 13.03.4 | 2.00.5 | |
| C1 | (1,1) | 03:46:49.0 | 68:05:51.7 | 98.77.6 | 51.33.4 | 51.08.1 | 1.80.3 | |
| (2,2) | 65.04.6 | 51.01.9 | 30.24.5 | 2.00.3 | ||||
| (3,3) | 139.04.5 | 47.51.3 | 33.63.1 | 3.90.3 | ||||
| (4,4) | 52.87.1 | 44.84.0 | 42.09.4 | 1.20.2 | ||||
| C2 | (1,1) | 03:46:49.2 | 68:05:49.9 | 103.36.7 | 45.82.8 | 47.26.7 | 2.10.3 | |
| (2,2) | 51.15.5 | 45.42.5 | 27.45.9 | 1.80.3 | ||||
| (3,3) | 138.03.6 | 50.41.1 | 35.32.6 | 3.70.2 | ||||
| (4,4) | 34.49.9 | 53.57.8 | 50.918.3 | 0.60.2 | ||||
| C3 | (1,1) | 03:46:49.1 | 68:05:48.0 | 84.95.5 | 49.02.7 | 50.06.3 | 1.60.2 | |
| (2,2) | 55.87.2 | 42.83.6 | 35.18.5 | 1.50.3 | ||||
| (3,3) | 77.64.1 | 49.81.5 | 28.23.5 | 2.60.3 | ||||
| C4 | (3,3) | 03:46:49.0 | 68:05:46.3 | 25.23.4 | 53.81.5 | 14.83.4 | 1.60.3 | |
| C5 | (3,3) | 03:46:48.9 | 68:05:48.7 | 57.76.0 | 57.93.3 | 42.87.7 | 1.30.2 | |
| D′1 | (1,1) | 03:46:49.8 | 68:05:59.7 | 108.416.4 | 61.68.7 | 90.822.9 | 1.10.2 | |
| (2,2) | 42.08.8 | 50.85.2 | 36.712.2 | 1.10.3 | ||||
| (3,3) | 69.45.5 | 47.72.1 | 27.14.9 | 2.40.4 | ||||
| (4,4) | 36.99.5 | 61.96.3 | 39.914.8 | 0.90.3 | ||||
| D′2 | (1,1) | 03:46:49.7 | 68:05:58.4 | 89.48.1 | 49.04.1 | 57.79.8 | 1.50.2 | |
| (3,3) | 52.85.4 | 54.02.3 | 25.25.4 | 2.00.4 | ||||
| D′3 | (1,1) | 03:46:49.4 | 68:06:02.0 | 29.12.3 | 23.70.9 | 11.01.9 | 2.50.4 | |
| E1 | (1,1) | 03:46:47.5 | 68:05:42.7 | 51.95.6 | 18.32.5 | 27.96.0 | 1.70.3 | |
| (2,2) | 53.26.6 | 21.03.4 | 34.37.9 | 1.50.3 | ||||
| (3,3) | 47.33.3 | 12.91.1 | 15.52.5 | 2.90.4 | ||||
| E3 | (3,3) | 03:46:47.0 | 68:05:37.1 | 28.03.2 | 25.31.4 | 13.52.0 | 1.90.4 | |
| NGC 6946 | ||||||||
| AI | (3,3) | 20:34:52:9 | 60:09:14.4 | 21.83.8 | 7.92.7 | 26.96.4 | 0.80.2 | |
| NGC 2146 | ||||||||
| AI | (1,1) | 06:18:37.2 | 78.21.25.1 | 17.2 0.8 | 944.31.0 | 6.51.7 | 2.50.6 | |
| AII | (1,1) | 06:18:35.1 | 78.31.34.1 | 44.7 5.9 | 916.33.7 | 39.38.7 | 1.10.2 | |
| Source | RA (J2000) | DEC (J2000) | Luminosity | ||||
|---|---|---|---|---|---|---|---|
| hh:mm:ss | ° ′ ″ | (K km s-1) | ( km s-1) | ( km s-1) | (K) | L⊙ | |
| IC 342 | |||||||
| IC342-W1 | 03:46:48.7 | 68 05 43.7 | 97.932.8 | 26.50.2 | 13.00.5 | 7.00.2 | 0.0170.006 |
| IC342-W2 ∗ | 03:46:47.7 | 68 05 45.9 | 29.111.0 | 20.01.0 | 9.12.7 | 3.00.3 | 0.0050.003 |
| NGC 6946 | |||||||
| 6946-W1 | 20:34:52.9 | 60 08 51.3 | 58.32.2 | 94.80.6 | 11.01.1 | 5.00.4 | 0.0420.002 |
| NGC 2146 | |||||||
| 2146-W1 | 06:18:38.7 | 78 21 19.7 | 72.69.3 | 831.40.8 | 4.51.3 | 15.24.0 | 0.3510.045 |
| 2146-W2 | 06:18:38.7 | 78 21 24.3 | 94.13.8 | 831.90.5 | 9.71.1 | 9.10.9 | 0.4550.018 |
| 2146-W3 | 06:18:36.6 | 78 21 27.6 | 431.57.6 | 1013.31.4 | 48.03.4 | 8.40.5 | 2.0870.037 |
Note. — ∗ not deconvolved from the spectral resolution
| Source | RA (J2000) | DEC (J2000) | Luminosity | ||||
|---|---|---|---|---|---|---|---|
| hh:mm:ss | ° ′ ″ | (K km s-1) | ( km s-1) | ( km s-1) | (K) | L⊙ | |
| IC 342 | |||||||
| IC 342-M1 | 03:46:49.8 | 68 05 59.9 | 140.493.6 | 51.90.8 | 24.21.9 | 5.50.4 | 0.0610.041 |
| IC 342-M2 | 03:46:49.6 | 68 05 58.7 | 94.591.7 | 54.50.9 | 19.72.1 | 4.50.4 | 0.0410.039 |
| IC 342-M3 | 03:46:49.1 | 68 05 51.7 | 176.983.3 | 49.90.6 | 23.51.5 | 7.10.4 | 0.0770.036 |
| IC 342-M4 | 03:46:49.1 | 68 05 50.6 | 186.560.5 | 50.60.5 | 23.21.1 | 7.60.3 | 0.0810.026 |
| IC 342-M5 | 03:46:47.1 | 68 05 39.1 | 43.0118.8 | 21.31.1 | 11.63.1 | 3.50.7 | 0.0190.052 |
| IC 342-M6 | 03:46:47.1 | 68 05 37.0 | 83.277.9 | 23.10.8 | 16.61.7 | 4.70.4 | 0.0360.033 |
| NGC 6946 | |||||||
| 6946-M1 | 20:34:52.8 | 60 09 13.4 | 269.6149.7 | 33.31.5 | 56.13.5 | 4.50.2 | 0.3760.208 |
| 6946-M2 | 20:34:52.7 | 60 09 11.2 | 82.398.3 | 66.01.1 | 22.42.6 | 3.50.4 | 0.1150.137 |
| Source | ||||
|---|---|---|---|---|
| (K) | (K) | (K) | (K) | |
| IC 342 | ||||
| A1 | 21 | 171 | 22 | 259 |
| A2 | 29 | 96 | 34 | 170 |
| C1 | 34 | 137 | 48 | 363 |
| C2 | 27 | 115 | 32 | 240 |
| C3 | 34 | 75 | 48 | 113 |
| D′1 | 24 | 148 | 26 | 452 |
| D′2 | 18 | 28 | ||
| D′3 | 35 | 51 | ||
| E1 | 53 | 77 | 154 | 126 |
| NGC 2146 | ||||
| AI | 44 | 89 | ||
| AII | 21 | 23 | ||
| Location | N | N | Abundance |
|---|---|---|---|
| 1022(cm-2) | 1014(cm-2) | 10-9(N/N) | |
| A1 | 143 | 136 | 94 |
| A2 | 153 | 186 | 124 |
| B1 | 113 | 136 | 115 |
| C1 | 173 | 156 | 83 |
| C2 | 153 | 206 | 144 |
| C3 | 123 | 136 | 125 |
| C4 | 123 | … | … |
| C5 | 93 | 96 | 106 |
| D1 | 73 | 146 | 219 |
| D2 | 83 | 166 | 218 |
| D′3 | 73 | 136 | 188 |
| E1 | 153 | 56 | 34 |
| E2 | 73 | … | … |
Note. — Molecular abundance of NH3. Note that these measurements are made with a 2.7″ beam and therefore not all locations are spatially independent.
References
- Braatz et al. (1996) Braatz, J. A., Wilson, A. S., & Henkel, C. 1996, ApJS, 106, 51
- Bradford et al. (2003) Bradford, C. M., Nikola, T., Stacey, G. J., et al. 2003, ApJ, 586, 891
- Chen et al. (2015) Chen, X., Ellingsen, S. P., Baan, W. A., et al. 2015, ApJ, 800, L2
- Clark et al. (2013) Clark, P. C., Glover, S. C. O., Ragan, S. E., Shetty, R., & Klessen, R. S. 2013, ApJ, 768, L34
- Claussen et al. (1996) Claussen, M. J., Wilking, B. A., Benson, P. J., et al. 1996, ApJS, 106, 111
- Downes et al. (1992) Downes, D., Radford, S. J. E., Guilloteau, S., et al. 1992, A&A, 262, 424
- Ellingsen et al. (2014) Ellingsen, S. P., Chen, X., Qiao, H.-H., et al. 2014, ApJ, 790, L28
- Gao & Solomon (2004) Gao, Y., & Solomon, P. M. 2004, ApJ, 606, 271
- Ginsburg et al. (2016) Ginsburg, A., Henkel, C., Ao, Y., et al. 2016, A&A, 586, A50
- Goddi et al. (2015) Goddi, C., Henkel, C., Zhang, Q., Zapata, L., & Wilson, T. L. 2015, A&A, 573, A109
- Gorski et al. (2017) Gorski, M., Ott, J., Rand, R., et al. 2016, ApJ, 2017
- Greve et al. (2006) Greve, A., Neininger, N., Sievers, A., & Tarchi, A. 2006, A&A, 459, 441
- Hagiwara et al. (2001) Hagiwara, Y., Henkel, C., Menten, K. M., & Nakai, N. 2001, ApJ, 560, L37
- Ho & Townes (1983) Ho, P. T. P., & Townes, C. H. 1983, ARA&A, 21, 239
- Henkel et al. (2000) Henkel, C., Mauersberger, R., Peck, A. B., Falcke, H., & Hagiwara, Y. 2000, A&A, 361, L45
- Hopkins et al. (2014) Hopkins, P. F., Kereš, D., Oñorbe, J., et al. 2014, MNRAS, 445, 581
- Hopkins et al. (2011) Hopkins, P. F., Quataert, E., & Murray, N. 2011, MNRAS, 417, 950
- Jarrett et al. (2013) Jarrett, T. H., Masci, F., Tsai, C. W., et al. 2013, AJ, 145, 6
- Karachentsev et al. (2013) Karachentsev, I. D., Makarov, D. I., & Kaisina, E. I. 2013, AJ, 145, 101
- Kauffmann et al. (1999) Kauffmann, G., Colberg, J. M., Diaferio, A., & White, S. D. M. 1999, MNRAS, 303, 188
- Kennicutt (1998) Kennicutt, R. C., Jr. 1998, ARA&A, 36, 189
- Krumholz et al. (2011) Krumholz, M. R., Klein, R. I., & McKee, C. F. 2011, ApJ, 740, 74
- Lebrón et al. (2011) Lebrón, M., Mangum, J. G., Mauersberger, R., et al. 2011, A&A, 534, A56
- Leroy et al. (2015) Leroy, A. K., Bolatto, A. D., Ostriker, E. C., et al. 2015, ApJ, 801, 25
- Levine et al. (1994) Levine, D. A., Turner, J. L., & Hurt, R. L. 1994, IAU Colloq. 140: Astronomy with Millimeter and Submillimeter Wave Interferometry, 59, 339
- Mangum et al. (2013) Mangum, J. G., Darling, J., Henkel, C., et al. 2013, ApJ, 779, 33
- McMullin et al. (2007) McMullin, J. P., Waters, B., Schiebel, D., Young, W., & Golap, K. 2007, Astronomical Data Analysis Software and Systems XVI, 376, 127
- Meier et al. (2000) Meier, D. S., Turner, J. L., & Hurt, R. L. 2000, ApJ, 531, 200
- Meier & Turner (2001) Meier, D. S., & Turner, J. L. 2001, ApJ, 551, 687
- Meier & Turner (2005) Meier, D. S., & Turner, J. L. 2005, ApJ, 618, 259
- Meier et al. (2011) Meier, D. S., Turner, J. L., & Schinnerer, E. 2011, AJ, 142, 32
- Meier et al. (2015) Meier, D. S., Walter, F., Bolatto, A. D., et al. 2015, ApJ, 801, 63
- Miyamoto et al. (2015) Miyamoto, Y., Nakai, N., Seta, M., et al. 2015, PASJ, 67, 5
- Murray et al. (2010) Murray, N., Quataert, E., & Thompson, T. A. 2010, ApJ, 709, 191
- Ott et al. (2011) Ott, J., Henkel, C., Braatz, J. A., & Weiß, A. 2011, ApJ, 742, 95
- Ott et al. (2005) Ott, J., Weiss, A., Henkel, C., & Walter, F. 2005, ApJ, 629, 767
- Palagi et al. (1993) Palagi, F., Cesaroni, R., Comoretto, G., Felli, M., & Natale, V. 1993, A&AS, 101, 153
- Perley & Butler (2013) Perley, R. A., & Butler, B. J. 2013, ApJS, 206, 16
- Radburn-Smith et al. (2011) Radburn-Smith, D. J., de Jong, R. S., Seth, A. C., et al. 2011, ApJS, 195, 18
- Reid et al. (2009) Reid, M. J., Braatz, J. A., Condon, J. J., et al. 2009, ApJ, 695, 287
- Schinnerer et al. (2006) Schinnerer, E., Böker, T., Emsellem, E., & Lisenfeld, U. 2006, ApJ, 649, 181
- Schöier et al. (2005) Schöier, F. L., van der Tak, F. F. S., van Dishoeck, E. F., & Black, J. H. 2005, A&A, 432, 369
- Strong et al. (1988) Strong, A. W., Bloemen, J. B. G. M., Dame, T. M., et al. 1988, A&A, 207, 1
- Suto & Lee (1983) Suto, M., & Lee, L. C. 1983, J. Chem. Phys., 78, 4515
- Takano et al. (2002) Takano, S., Nakai, N., & Kawaguchi, K. 2002, PASJ, 54, 195
- Takano et al. (2005) Takano, S., Nakai, N., Kawaguchi, K., et al. 2005, Highlights of Astronomy, 13, 875
- Tarchi et al. (2002) Tarchi, A., Henkel, C., Peck, A. B., & Menten, K. M. 2002, A&A, 385, 1049
- Tarchi et al. (2002b) Tarchi, A., Henkel, C., Peck, A. B., & Menten, K. M. 2002b, A&A, 389, L39
- Tarchi et al. (2011) Tarchi, A., Castangia, P., Columbano, A., Panessa, F., & Braatz, J. A. 2011, A&A, 532, A125
- Tsai et al. (2009) Tsai, A.-L., Matsushita, S., Nakanishi, K., et al. 2009, PASJ, 61, 237
- Turner et al. (1992) Turner, J. L., & Hurt, R. L. 1992, ApJ, 384, 72
- Ungerechts et al. (1986) Ungerechts, H., Winnewisser, G., & Walmsley, C. M. 1986, A&A, 157, 207
- van der Tak et al. (2007) Van der Tak, F.F.S., Black, J.H., Sch ier, F.L., Jansen, D.J., van Dishoeck, E.F., 2007, A&A, 468, 627-635
- Walmsley & Ungerechts (1983) Walmsley, C. M., & Ungerechts, H. 1983, A&A, 122, 164
- Weiß et al. (2001) Weiß, A., Neininger, N., Henkel, C., Stutzki, J., & Klein, U. 2001, ApJ, 554, L143
- Wilson & Mauersberger (1990) Wilson, T. L., & Mauersberger, R. 1990, A&A, 239, 305
- Whiting (1999) Whiting, A. B. 1999, AJ, 117, 202
- Yusef-Zadeh et al. (2013) Yusef-Zadeh, F., Cotton, W., Viti, S., Wardle, M., & Royster, M. 2013, ApJ, 764, L19