Anisotropic Gilbert damping in perovskite La0.7Sr0.3MnO3 thin film
Abstract
The viscous Gilbert damping parameter governing magnetization dynamics is of primary importance for various spintronics applications. Although, the damping constant is believed to be anisotropic by theories. It is commonly treated as a scalar due to lack of experimental evidence. Here, we present an elaborate angle dependent broadband ferromagnetic resonance study of high quality epitaxial La0.7Sr0.3MnO3 films. Extrinsic effects are suppressed and we show convincing evidence of anisotropic damping with twofold symmetry at room temperature. The observed anisotropic relaxation is attributed to the magnetization orientation dependence of the band structure. In addition, we demonstrated that such anisotropy can be tailored by manipulating the stain. This work provides new insights to understand the mechanism of magnetization relaxation.
A introduction
The magnetization relaxation process determines the speed of magnetization relaxation and the energy required for current-induced magnetization reversal (Slonczewski, 1996; Katine et al., 2000; Ikeda et al., 2010; Ralph and Stiles, 2008; Brataas et al., 2012; Watanabe et al., 2018). Understanding the mechanism and controlling of magnetization relaxation (Brataas et al., 2008; Tserkovnyak et al., 2002; Schoen et al., 2016; Heinrich et al., 2011; Okada et al., 2017; Gilmore et al., 2007), including intrinsic Gilbert damping and extrinsic effects, pave the way for ultra-low power and high performance spintronic devices based on spin transfer and spin orbit torques (Locatelli et al., 2014; Urazhdin et al., 2014; Avci et al., 2017). It has been demonstrated that Gilbert damping constant () can be tuned effectively by engineering the density of states and spin orbit coupling (SOC) (Schoen et al., 2016; Kubota et al., 2009; He et al., 2013; Lee et al., 2017). In addition, magnetization relaxations subjected to finite size and interfacial effects have also been extensively investigated (Tserkovnyak et al., 2002; Moriyama et al., 2008; Nembach et al., 2013). However, it is still an open question that if magnetic damping is anisotropic. In principle, is magnetization orientation dependent and should be a 33 tensor in the phenomenological Gilbert equation (Gilbert, 1955; Steiauf and Fähnle, 2005), yet it is often treated as a scalar (isotropic). In the case of polycrystalline thin films prepared by sputtering, such treatment is reasonable due to the smearing of long range structural order. Whereas for single crystal thin films, it is still difficult to draw a conclusion due to the lack of convincing experimental evidence. From the view of theories, the Gilbert damping is determined by two scattering processes, the interband resistivity-like scattering and the intraband conductivity-like scattering (Gilmore et al., 2007). Both terms vary with temperature through their dependence on electron relaxation time. The interband scattering which dominates damping in most ferromagnets becomes isotropic at room temperature (Gilmore et al., 2010). Therefore, anisotropic linewidth in 3d magnetic metals was only observed at low temperature(Rudd et al., 1985). From the aspect of experimental technique, Seib et al. have predicted that the precession trajectory of magnetization in a ferromagnetic resonance (FMR) measurement (standard technique for measuring damping) may partially average out the anisotropy (Seib et al., 2009). Hence, detecting the anisotropy in Gilbert damping is extremely difficult. Furthermore, the existence of several angle dependent extrinsic contributions to damping in most materials further hinders the determination of a possible weak anisotropic damping (Woltersdorf and Heinrich, 2004; Arias and Mills, 1999; Körner et al., 2013; Okada et al., 2017). We note that in a ferromagnet with nearly half-metallic band structure, the isotropic interband term is suppressed (Liu et al., 2009) and the damping can be dominated by the anisotropic intraband contribution(Gilmore et al., 2010). Recent reports have claimed the observation of anisotropic damping in half-metallic Heusler alloy(Kasatani et al., 2014; Yilgin et al., 2007). However, unavoidable chemical disorder (Wen et al., 2014; Kumar et al., 2017)of Heusler alloy introduces extrinsic effects such as spin wave scattering hence complicates the verification procedure of such anisotropy.
La0.7Sr0.3MnO3 (LSMO) is an oxide perovskite material exhibited half-metallic band structure and ultra-low damping at room temperature (Park et al., 1998; Qin et al., 2017). In this work, we studied the magnetization relaxation of LSMO films deposited on (NGO) (110) substrates using angle-resolved broadband ferromagnetic resonance. The purpose of choosing NGO (110) substrates is to utilize its non-equal and axis value. Such asymmetry will potentially lead to non-spherical Fermi surface. Two types of high quality samples with different static magnetic anisotropies were investigated. The normal LSMO film (hereafter denoted as S-LSMO) exhibited weak uniaxial magnetic anisotropy whereas the other with modulated strain relaxation mode (hereafter denoted as W-LSMO) have both uniaxial and cubic anisotropy fields. The angle dependence of the in-plane intrinsic Gilbert damping showed two-fold symmetry in both type of samples. Strikingly, the orientation of minimum damping differs 90 degree. This work provided strong evidence of anisotropic nature of magnetization relaxation and demonstrated the tuning of anisotropy in damping through stress relaxation engineering.
B Results
Epitaxial growth of LSMO
Pulsed laser deposition (PLD) was used to deposit LSMO thin films with a thickness of 25 nm on (110) NGO substrates. The energy and repetition frequency of KrF laser (248 nm) were 225 mJ and 2 Hz, respectively. During deposition, the substrate temperature was fixed at 950. The oxygen pressure was 225 mTorr for S-LSMO and 200 mTorr for W-LSMOAfter deposition, S-LSMO was cooled down to room temperature at 10K/min under the oxygen pressure of 1 Torr, whereas W-LSMO at 5 K/min under the oxygen pressure of 100 Torr in order to promote the modification of strain hence micro-structurestructure.
Crystalline quality analysis
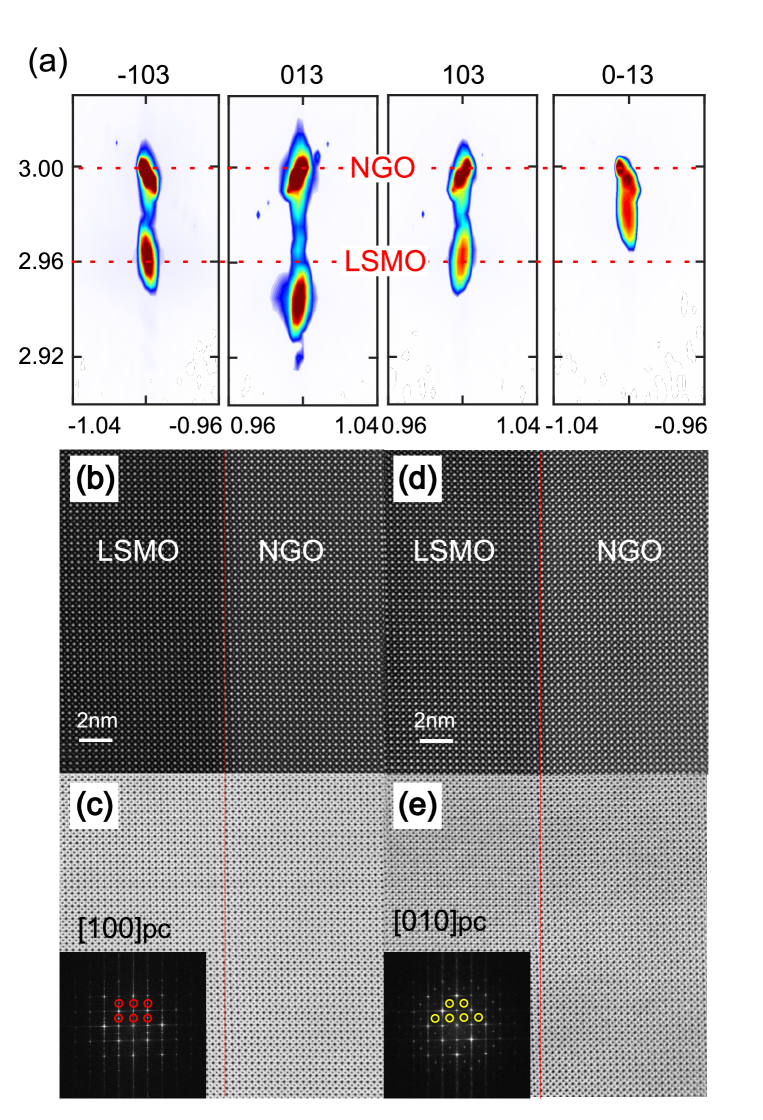
The crystallographic structures of the films were characterized by synchrotron high resolution X-ray diffraction. Reciprocal space maps (RSMs) taken at room temperature around {013} (here the subscript pc stands for pseudocubic) reflections confirm the epitaxial growth of LSMO layers on the NGO substrate as shown in Fig. 1 (a). The vertical alignment of LSMO and NGO reciprocal lattice point clearly shows that the LSMO film is completely strained on the NGO substrate. Lattice mismatch along [100] and [010] are 1.03% and 0.8%, respectively. Considering the position of the LSMO reciprocal lattice point in the {013} mappings, equal values of (103) and (-103) indicates the perpendicular relation between vector and in the lattice, whereas different L values for (013) and (0-13) shows that the angle between and is not equal to 90°. Thus, the LSMO is monoclinic phase which is consistent with previous reports (Vailionis et al., 2011). The good crystalline quality was further verified by aberration-corrected scanning transmission electron microscopy (AC-STEM). Fig. 1 (b, c) are the simultaneously acquired high angle annular dark field (HAADF) and annular bright field (ABF) images of S-LSMO along [100]pc direction, while Fig. 1 (d, e) are for [010] direction. The measurement directions can be differentiated from the diffraction of NGO substrate: 1/2[010] superlattices for [100] direction (inset of Fig. 1(c)) and 1/2[101] superlattices for [100] direction (inset of Fig. 1(e)). High quality single crystalline films are essential for the present purposes because high density of defects will result in spin wave scattering (Woltersdorf and Heinrich, 2004).
Magnetic anisotropy fields
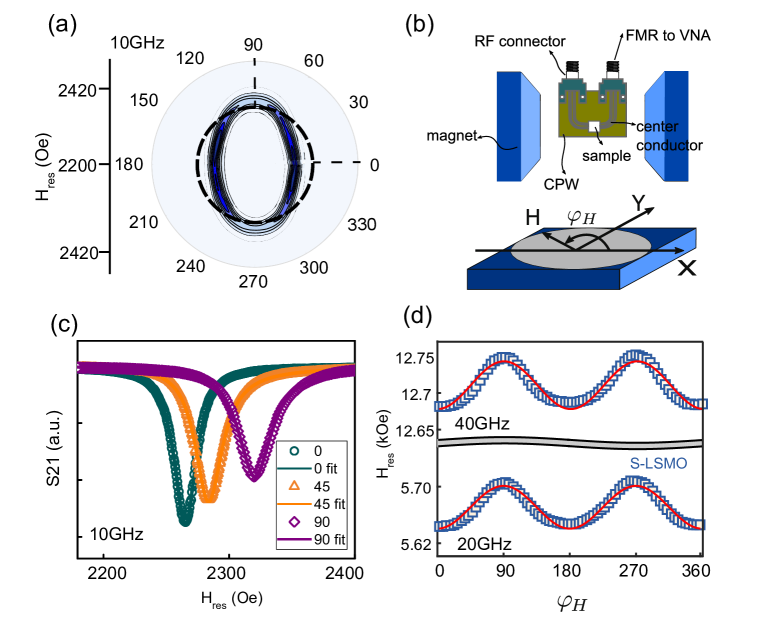
The magnetic dynamic properties were investigated by a home-built angle-resolved broadband FMR with magnetic field up to 1.5 T. All measurements were performed at room temperature. Shown in Fig. 2(a) is the color-coded plot of the transmission coefficient S21 of the S-LSMO sample measured at 10 GHz. is the in-plane azimuth angle of the external magnetic field counted from [010] direction (Fig. 2(b)). This relative orientation was controlled by a sample mounting manipulator with a precision of less than 0.1∘. The olive shape of the color region indicates the existence of anisotropy field, whereas the very narrow field region of resonances is an evidence of low damping. Three line cuts at =0, 45 and 90 degrees are plotted in Fig. 2(c), showing the variation of both FMR resonance field () and line shape with . All curves are well fitted hence both the and resonance linewidth H are determined. The dependence of H at two selected frequencies (20 and 40 GHz) are shown in Fig. 2(d) for S-LSMO. The angle dependencies of the resonance field is calculated starting from the total energy (Farle, 1998):
| (1) |
where and are the polar angle and the azimuth angle of the magnetization (), , , , are the uniaxial and cubic out-fo-plane and in-plane anisotropy fields. The easy axes of in-plane anisotropies are along and , respectively. According to Smit-Beljers equation the resonance condition for is (Smit and Beljers, 1955):
| (2) |
Here, and are second partial derivatives of the total energy with respect to the polar and azimuth angles. =1.76107s-1G-1 denotes the gyromagnetic ratio, is the effective magnetization. The resonance field of S-LSMO shows pronounced minimum at , indicating the existence of uniaxial magnetic anisotropy with easy axis along or [010] direction. Cubic anisotropy is negligible hence =0. Such uniaxial anisotropy observed in S-LSMO is consistent with previous reports (Boschker et al., 2009), which is attributed to anisotropic strain produced by the NGO(110) substrate (Suzuki et al., 1998; Boschker et al., 2011; Tsui et al., 2000). Compared to the resonance fields in our measurement, the magnetic anisotropy fields are orders of magnitude smaller. Therefore, the calculated difference between and are always smaller than and is assumed in the following discussion.
Magnetization orientation dependence of Gilbert damping
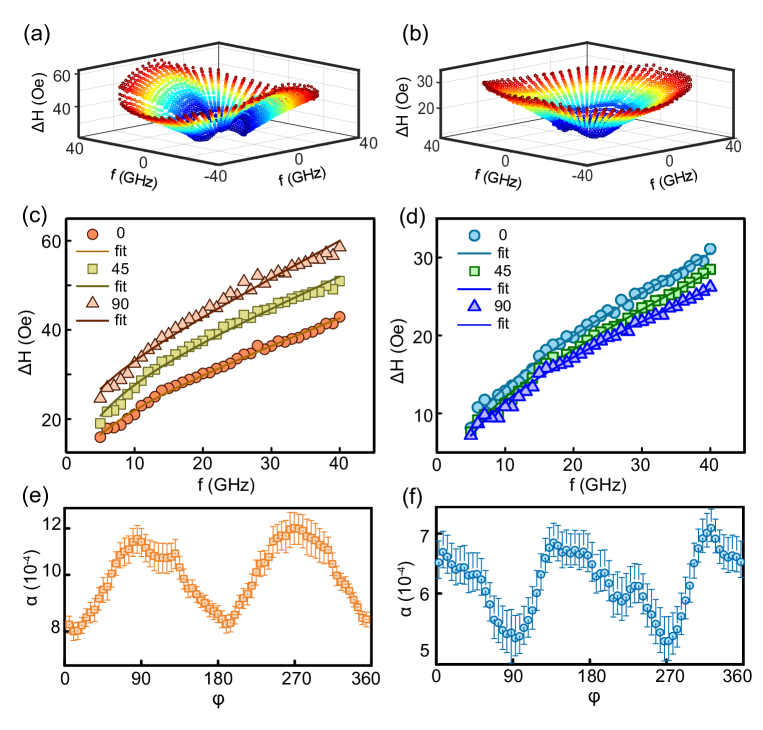
In order to study the symmetry of magnetization relaxation of the sample. The FMR linewidth for a matrix of parameter list (72 field orientations and 36 frequency values) are extracted. The results are shown by 3-D plots in Fig. 3(a) . Here, axis is and , axes are and , respectively. The figure clearly shows that the linewidth depends on magnetization orientation. At a given frequency, the linewidth is maximum (minimum) at () for S-LSMO. Fig. 3(c) shows the versus frequency for three field orientations. The FMR linewidth due to intrinsic magnetic damping scales linearly with frequency according to Laudau-Lifshitz-Gilbert phenomenological theory (He and Panagopoulos, 2016; Celinski and Heinrich, 1991). However, a weak non-linearity in the low frequency range can be identified. In general, extrinsic linewidth contributions such as inhomogeneity and magnon scattering will broaden the FMR spectrum hence result in additional linewidth contributions scales non-linearly with frequency (Schoen et al., 2016; Okada et al., 2017). The interfacial magnon scattering is suppressed due to relative large film thickness (25 nm) and the bulk magnon scattering contribution to the linewidth is negligible in our samples with very good atomic order. However, the static magnetic properties of the thin film may vary slightly in the millimeter scale. Since the FMR signal is an averaged response detected by the coplanar waveguide (5 mm long), a superposition of location resonance modes broadens the FMR spectrum. Such well-known contribution to linewidth, defined as , are generally treated as a constant (Schoen et al., 2016; Celinski and Heinrich, 1991; Shaw et al., 2011). However, it is frequency dependent for in-plane configuration and need to be treated carefully for samples with ultra-low damping. Here, we fit the data with , taking into account the frequency and orientation dependence of . As can be seen from Fig. 3(c), the data are well reproduced for every field orientations. Hence, the magnetization orientation dependence of intrinsic damping constant is determined and plotted in Fig. 3(e). Remarkably, the damping constant shows two-fold symmetry. The lowest damping of S-LSMO with in-plane magnetization, observed at and , is and comparable to the value measured under a perpendicular field (Tbl. 1). The maximum damping at and is about 25% higher.
Since the magnetization damping and resonance field of the S-LSMO sample exhibited identical symmetry (Fig. 2 (d) and Fig. 2(e)), it seems that the observed anisotropic damping is directly related to crystalline anisotropy. Therefore, we prepared the W-LSMO sample with slightly different structure and hence modified static magnetic anisotropy properties. The W-LSMO sample exhibited 1D long range atomic wave-like modulation (Vailionis et al., 2011) (twining domain motif) along [100] axis near the interface between substrate and film. Due to different strain relaxation mechanism as compared to S-LSMO, the dependence of for the W-LSMO have additional features and can only be reproduced by including both Oe) and Oe) terms. The easy axis of the uniaxial anisotropy (=0 ) is the same as S-LSMO whereas the additional cubic anisotropy is minimum at =45°. The magnetization orientation dependence of the FMR linewidth for W-LSMO is significantly different (Fig. 3(b)) as compared to S-LSMO. Such change in trend can be clearly identified from the frequency dependence of linewidth for selected magnetization orientations shown in Fig. 3(d). Magnetization damping values are extracted using the same procedure as S-LSMO because the spin wave contribution is excluded. The damping constant again showed two-fold in-plane symmetry. However, in contrast to S-LSMO, the maximum damping value of W-LSMO is observed at and .
C Discussion
Anisotropy in linewidth at low temperatures have been reported decades ago, however, data in most early publications were taken at a fixed frequency in a cavity-based FMR (Rudd et al., 1985; Vittoria et al., 1967). Due to lack of frequency dependence information, it is not clear if the anisotropy in linewidth is due to intrinsic damping or extrinsic effects (Dubowik et al., 2011; Wegscheider et al., 2011; Platow et al., 1998). In this study, besides wide range of frequencies, we also adopted samples with effective anisotropy orders of magnitude smaller than the external field. Therefore, the field dragging effect and mosaicity broadening, both of which are anisotropic in natur e(Zakeri et al., 2007), are negligibly small and the Gilbert damping constant is determined reliably. Furthermore, the mechanism in this simple system is different from previous reports related to interfacial exchange coupling and spin pumping(Le Graët et al., 2010; Baker et al., 2016). Since both S-LSMO and W-LSMO exhibited in-plane uniaxial magnetic anisotropy, the opposite trends observed in these two samples exclude the existence of a direct link between anisotropic damping and effective field. Both magnetic anisotropy and damping are related to the band structure but in quite different ways. According to perturbation theory, the magnetic anisotropy energy is determined by the matrix elements of the spin-orbit interaction between occupied states. Hence, the contributions from all the filled bands must be considered to calculate the absolute value of magnetic anisotropy. On the other hand, the magnetic damping is related to the density of states at the Fermi level.
| (T) | (Oe) | (Oe) | () | |||
|---|---|---|---|---|---|---|
| S-LSMO | 0.32800.0011 | 37 | 0 | |||
| W-LSMO | 0.36200.0025 | 13.9 | 11.8 |
The damping term in the Landau-Lifshitz-Gilbert equation of motion is , therefore, anisotropy in damping can have two origins, one related to the equilibrium orientation of magnetization (orientation anisotropy) and the other depends on the instantaneous change in magnetization (rotational anisotropy). In FMR experiments the magnetization vector rotates around its equilibrium position, therefore, the rotational anisotropy may be smeared out (Seib et al., 2009). The orientation anisotropy is described by both interband and intraband scattering process. According to Gilmore et al.(Gilmore et al., 2010), the latter is isotropic at sufficiently high scattering rates at room temperature. We suspect that the anisotropic damping in LSMO is due to its half-metallic band structure. As a result of high spin polarization, interband scattering is suppressed and the room temperature damping is dominated by intraband scattering. The intraband contribution to damping exhibit anisotropy for all scattering rates (Gilmore et al., 2010) which agree well with our experiments. The suppression of interband scattering is evidenced by the ultra-low damping in the order of . Notably, the absolute value of the observed anisotropy, 2.610-4 for S-LSMO and 1.210-4 for W-LSMO, is so small that could not be identified reliably for a material with typical damping values between 510-3 to 210-2.
In a microscopic picture, the Gilbert damping is proportional to the square of SOC constant () and density of states at the Fermi level, . The shape of the Fermi surface depends on the orientation of the magnetization due to SOC. Hence, the anisotropy can be attributed to the angle dependence of which is in turn induced by the substrate. The trend reversal in the damping anisotropy of the two LSMO samples can be explained by the modification of the Fermi surface and thus by strain relaxation. During the preparation of this paper, we noticed a similar work in ultra-thin Fe layers deposited on GaAs substrate(Chen et al., 2018). There, the anisotropy is attributed to interfacial SOC. This work suggests that anisotropic damping can exist in bulk samples.
Acknowledgements.
The research is supported by the Singapore National Research Foundation under CRP Award No. NRF-CRP10-2012-02. P. Yang is supported from SSLS via NUS Core Support C-380-003-003-001. S.J.P is grateful to the National University of Singapore for funding.References
- Slonczewski (1996) J. C. Slonczewski, Journal of Magnetism and Magnetic Materials 159, L1 (1996).
- Katine et al. (2000) J. A. Katine, F. J. Albert, R. A. Buhrman, E. B. Myers, and D. C. Ralph, Physical Review Letters 84, 3149 (2000).
- Ikeda et al. (2010) S. Ikeda, K. Miura, H. Yamamoto, K. Mizunuma, H. D. Gan, M. Endo, S. Kanai, J. Hayakawa, F. Matsukura, and H. Ohno, Nat Mater 9, 721 (2010).
- Ralph and Stiles (2008) D. C. Ralph and M. D. Stiles, Journal of Magnetism and Magnetic Materials 320, 1190 (2008).
- Brataas et al. (2012) A. Brataas, A. D. Kent, and H. Ohno, Nat Mater 11, 372 (2012).
- Watanabe et al. (2018) K. Watanabe, B. Jinnai, S. Fukami, H. Sato, and H. Ohno, Nat Commun 9, 663 (2018).
- Brataas et al. (2008) A. Brataas, Y. Tserkovnyak, and G. E. W. Bauer, Physical Review Letters 101, 37207 (2008).
- Tserkovnyak et al. (2002) Y. Tserkovnyak, A. Brataas, and G. E. W. Bauer, Physical Review Letters 88, 117601 (2002).
- Schoen et al. (2016) M. A. W. Schoen, D. Thonig, M. L. Schneider, T. J. Silva, H. T. Nembach, O. Eriksson, O. Karis, and J. M. Shaw, Nat Phys 12, 839 (2016).
- Heinrich et al. (2011) B. Heinrich, C. Burrowes, E. Montoya, B. Kardasz, E. Girt, Y.-Y. Song, Y. Sun, and M. Wu, Physical Review Letters 107, 66604 (2011).
- Okada et al. (2017) A. Okada, S. He, B. Gu, S. Kanai, A. Soumyanarayanan, S. Ter Lim, M. Tran, M. Mori, S. Maekawa, and F. Matsukura, Proceedings of the National Academy of Sciences 114, 3815 (2017).
- Gilmore et al. (2007) K. Gilmore, Y. U. Idzerda, and M. D. Stiles, Phys. Rev. Lett. 99, 027204 (2007).
- Locatelli et al. (2014) N. Locatelli, V. Cros, and J. Grollier, Nat Mater 13, 11 (2014).
- Urazhdin et al. (2014) S. Urazhdin, V. E. Demidov, H. Ulrichs, T. Kendziorczyk, T. Kuhn, J. Leuthold, G. Wilde, and S. O. Demokritov, Nature Nanotechnology 9, 509 (2014).
- Avci et al. (2017) C. O. Avci, A. Quindeau, C. F. Pai, M. Mann, L. Caretta, A. S. Tang, M. C. Onbasli, C. A. Ross, and G. S. Beach, Nat Mater 16, 309 (2017).
- Kubota et al. (2009) T. Kubota, S. Tsunegi, M. Oogane, S. Mizukami, T. Miyazaki, H. Naganuma, and Y. Ando, Applied Physics Letters 94, 122504 (2009).
- He et al. (2013) P. He, X. Ma, J. W. Zhang, H. B. Zhao, G. Lüpke, Z. Shi, and S. M. Zhou, Phys. Rev. Lett. 110, 077203 (2013).
- Lee et al. (2017) A. J. Lee, J. T. Brangham, Y. Cheng, S. P. White, W. T. Ruane, B. D. Esser, D. W. McComb, P. C. Hammel, and F. Yang, Nature Communications 8, 234 (2017).
- Moriyama et al. (2008) T. Moriyama, R. Cao, X. Fan, G. Xuan, B. K. Nikolić, Y. Tserkovnyak, J. Kolodzey, and J. Q. Xiao, Physical Review Letters 100, 67602 (2008).
- Nembach et al. (2013) H. T. Nembach, J. M. Shaw, C. T. Boone, and T. J. Silva, Physical Review Letters 110, 117201 (2013).
- Gilbert (1955) T. L. Gilbert, Phys. Rev. 100, 1243 (1955).
- Steiauf and Fähnle (2005) D. Steiauf and M. Fähnle, Physical Review B 72, 64450 (2005).
- Gilmore et al. (2010) K. Gilmore, M. D. Stiles, J. Seib, D. Steiauf, and M. Fähnle, Physical Review B 81, 174414 (2010).
- Rudd et al. (1985) J. M. Rudd, K. Myrtle, J. F. Cochran, and B. Heinrich, Journal of Applied Physics 57, 3693 (1985).
- Seib et al. (2009) J. Seib, D. Steiauf, and M. Fähnle, Physical Review B 79, 92418 (2009).
- Woltersdorf and Heinrich (2004) G. Woltersdorf and B. Heinrich, Phys. Rev. B 69, 184417 (2004).
- Arias and Mills (1999) R. Arias and D. L. Mills, Physical Review B 60, 7395 (1999).
- Körner et al. (2013) M. Körner, K. Lenz, R. A. Gallardo, M. Fritzsche, A. Mücklich, S. Facsko, J. Lindner, P. Landeros, and J. Fassbender, Physical Review B 88, 054405 (2013).
- Liu et al. (2009) C. Liu, C. K. A. Mewes, M. Chshiev, T. Mewes, and W. H. Butler, Applied Physics Letters 95, 022509 (2009).
- Kasatani et al. (2014) Y. Kasatani, S. Yamada, H. Itoh, M. Miyao, K. Hamaya, and Y. Nozaki, Applied Physics Express 7, 123001 (2014).
- Yilgin et al. (2007) R. Yilgin, Y. Sakuraba, M. Oogane, S. Mizukami, Y. Ando, and T. Miyazaki, Japanese Journal of Applied Physics 46, L205 (2007).
- Wen et al. (2014) Z. Wen, H. Sukegawa, T. Furubayashi, J. Koo, K. Inomata, S. Mitani, J. P. Hadorn, T. Ohkubo, and K. Hono, Adv Mater 26, 6483 (2014).
- Kumar et al. (2017) A. Kumar, F. Pan, S. Husain, S. Akansel, R. Brucas, L. Bergqvist, S. Chaudhary, and P. Svedlindh, Phys. Rev. B 96, 224425 (2017).
- Park et al. (1998) J. H. Park, E. Vescovo, H. J. Kim, C. Kwon, R. Ramesh, and T. Venkatesan, Nature 392, 794 (1998).
- Qin et al. (2017) Q. Qin, S. He, W. Song, P. Yang, Q. Wu, Y. P. Feng, and J. Chen, Applied Physics Letters 110, 112401 (2017).
- Vailionis et al. (2011) A. Vailionis, H. Boschker, W. Siemons, E. P. Houwman, D. H. A. Blank, G. Rijnders, and G. Koster, Phys. Rev. B 83, 064101 (2011).
- Farle (1998) M. Farle, Reports on Progress in Physics 61, 755 (1998).
- Smit and Beljers (1955) J. Smit and H. G. Beljers, Philips Res. Rep 10, 31 (1955).
- Boschker et al. (2009) H. Boschker, M. Mathews, E. P. Houwman, H. Nishikawa, A. Vailionis, G. Koster, G. Rijnders, and D. H. A. Blank, Physical Review B - Condensed Matter and Materials Physics 79, 1 (2009).
- Suzuki et al. (1998) Y. Suzuki, H. Y. Hwang, S.-w. Cheong, T. Siegrist, R. B. van Dover, A. Asamitsu, and Y. Tokura, Journal of Applied Physics 83, 7064 (1998).
- Boschker et al. (2011) H. Boschker, M. Mathews, P. Brinks, E. Houwman, A. Vailionis, G. Koster, D. H. Blank, and G. Rijnders, Journal of Magnetism and Magnetic Materials 323, 2632 (2011).
- Tsui et al. (2000) F. Tsui, M. C. Smoak, T. K. Nath, and C. B. Eom, Applied Physics Letters 76, 2421 (2000).
- He and Panagopoulos (2016) S. He and C. Panagopoulos, Review of Scientific Instruments 87, 43110 (2016).
- Celinski and Heinrich (1991) Z. Celinski and B. Heinrich, Journal of Applied Physics 70, 5935 (1991).
- Shaw et al. (2011) J. M. Shaw, H. T. Nembach, and T. J. Silva, Applied Physics Letters 99, 1 (2011).
- Vittoria et al. (1967) C. Vittoria, R. Barker, and A. Yelon, Physical Review Letters 19, 792 (1967).
- Dubowik et al. (2011) J. Dubowik, K. Załȩski, H. Głowiński, and I. Gościańska, Physical Review B 84, 184438 (2011).
- Wegscheider et al. (2011) M. Wegscheider, G. Käferböck, C. Gusenbauer, T. Ashraf, R. Koch, and W. Jantsch, Phys. Rev. B 84, 054461 (2011).
- Platow et al. (1998) W. Platow, A. N. Anisimov, G. L. Dunifer, M. Farle, and K. Baberschke, Phys. Rev. B 58, 5611 (1998).
- Zakeri et al. (2007) K. Zakeri, J. Lindner, I. Barsukov, R. Meckenstock, M. Farle, U. von Hörsten, H. Wende, W. Keune, J. Rocker, S. S. Kalarickal, K. Lenz, W. Kuch, K. Baberschke, and Z. Frait, Physical Review B 76, 104416 (2007).
- Le Graët et al. (2010) C. Le Graët, D. Spenato, S. P. Pogossian, D. T. Dekadjevi, and J. Ben Youssef, Physical Review B 82, 1 (2010).
- Baker et al. (2016) A. A. Baker, A. I. Figueroa, C. J. Love, S. A. Cavill, T. Hesjedal, and G. van der Laan, Phys Rev Lett 116, 047201 (2016).
- Chen et al. (2018) L. Chen, S. Mankovsky, S. Wimmer, M. A. W. Schoen, H. S. Körner, M. Kronseder, D. Schuh, D. Bougeard, H. Ebert, D. Weiss, and C. H. Back, Nature Physics (2018).