The Role of Crystal Orientation in the Dissolution of UO2 Thin Films
Abstract
Epitaxial thin films have been utilised to investigate the radiolytic dissolution of uranium dioxide interfaces. Thin films of UO2 deposited on single crystal yttria stabilised zirconia substrates have been exposed to water in the presence of a high flux, monochromatic, synchrotron x-ray source. In particular, this technique was applied to induce dissolution of three UO2 thin films, grown along the principle UO2 crystallographic orientations: (001), (110) and (111). Dissolution of each film was induced for 9 accumulative corrosion periods, totalling 270 s, after which XRR spectra were recorded to observe the change in morphology of the films as a function of exposure time. While the (001) and (110) oriented films were found to corrode almost linearly and at comparable rates, the (111) film was found to be significantly more corrosion resistant, with no loss of UO2 material being observed after the initial 90s corrosion period. These results distinctly show the effect of crystallographic orientation on the rate of x-ray induced UO2 dissolution. This result may have important consequences for theoretical dissolution models, as it is evident that orientation dependence must be taken into consideration to obtain accurate predictions of the dissolution behaviour of UO2.
I INTRODUCTION
Understanding the corrosion behaviour of nuclear reactor fuels throughout the fuel cycle is key to assessing safety considerations He et al. (2012). In particular, investigating the interaction of fuel in the presence of water is an important scenario that has been widely studied Shoesmith (2000); Sunder et al. (1997); Matzke (1992); Shoesmith (2007), given it’s potential to occur both within the reactor under accident conditions and during the storage of spent nuclear fuel.
The most commonly used nuclear fuel, uranium dioxide, has a low solubility in water, given that the uranium exists in the (IV) oxidation state Shoesmith and Sunder (1992). However, in the presence of radiation fields, water undergoes radiolysis to produce a wide range of highly oxidising species, including: H2O2, OH∙, O, HO and O2 Le Caër (2011); Spinks and Woods (1990); Shoesmith (2007). In the presence of these species, UO2 is readily converted to the uranyl ion (UO) via the oxidation of U(IV) to U(VI), which has a solubility several orders of magnitude greater than UO2 Shoesmith and Sunder (1992); Bailey et al. (1985). This process can lead to the accelerated dissolution of the fuel matrix and potential release of radionuclides Shoesmith (2007).
Studying the dissolution of spent nuclear fuel in an aqueous environment is challenging, owing to the complex nature of both the fuel itself and the unique environments present throughout the fuel cycle. A large body of work has been conducted internationally to investigate the dissolution of UO2 under a vast range of conditions Sunder et al. (2004); Shoesmith and Sunder (1991); Shoesmith et al. (1989); Sunder et al. (1991); Bailey et al. (1985); Clarens et al. (2005); Shoesmith (2007); Ekeroth et al. (2006); Eriksen et al. (2012), however, understanding the isolated effect of individual parameters is difficult, and single variable studies are required. In this regard, thin films offer considerable potential, providing highly versatile, idealised samples that can be readily engineered to explore a wide range of material properties. Conducting nuclear material research on these systems presents the opportunity to begin with a model surface, and gradually introduce complexity such that a more fundamental understanding of fuel material properties can be obtained. This approach has particular advantages in supporting theoretical models, as such studies are typically performed on idealised surfaces, for which long-term simulations can be tested. In contrast with experiments conducted on complex bulk oxide materials or simulated fuels, our studies bridge the gap between theory and realistic conditions, with the aim of obtaining a more fundamental understanding of interactions at the fuel-water interface.
With recent developments in the growth of single crystal UO2 thin films Strehle et al. (2012); Bao et al. (2013), experimental studies on these idealised surfaces are now being performed Springell et al. (2015); Teterin et al. (2016); Popel et al. (2017). In particular, we have utilised synchrotron radiation to induce dissolution at the UO2 /ẇater interface. This approach Springell et al. (2015), successfully induced radiolytic dissolution of UO2, and enabled the change in the surface morphology of the film to be subsequently probed using synchrotron x-ray reflectivity (XRR) measurements. The work presented here, builds on our previous work to investigate the effect of crystallographic orientation on the dissolution of UO2.
II EXPERIMENTAL DETAILS
II.1 Sample Growth
Epitaxial UO2 thin films were grown at the University of Bristol using DC magnetron sputtering. An argon plasma sustained using a gas pressure of P 7.210-3 mbar was utilised to sputter atoms from a uranium metal target in an oxygen partial pressure of P 210-5 mbar, enabling UO2 to be deposited. Under these conditions, UO2 was sputtered at a rate of 1.6 Å / s onto substrates held at a temperature of 1000C; where the thermal energy was provided to improve the crystallinity of the film.
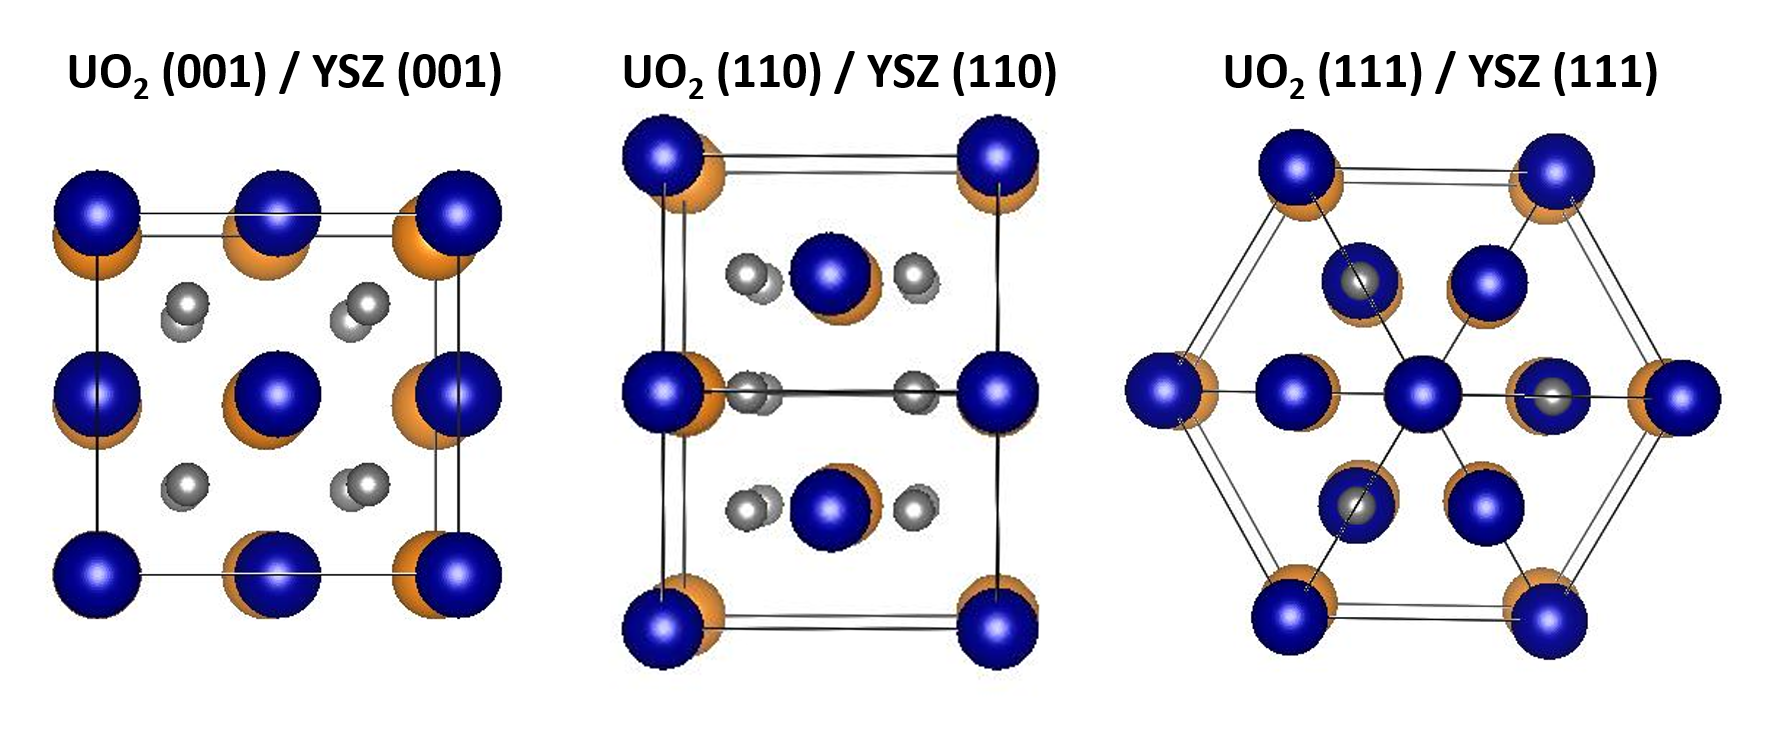
To investigate the effect of crystallographic orientation on UO2 dissolution, epitaxial UO2 thin films were grown for each principal crystal orientation: (001), (110), and (111); where the orientation was determined through the choice of substrate. Given both UO2 and yttria stabilized zirconia (YSZ) posses the cubic fluorite crystal structure with similar bulk lattice parameters of 5.47 Å and 5.15 Å respectively, a direct epitaxial match can be obtained for each principle orientation, Fig 1 Strehle et al. (2012). Atomically polished, 10 10 0.5 mm, YSZ (001), (110) and (111) crystals obtained commercially from MTI corp., were therefore selected as substrates on to which epitaxial UO2 thin films, of approximately 80 Å in thickness, were deposited.
II.2 Radiolytically Induced Dissolution
To simulate radiolytic dissolution of UO2 fuel, epitaxial UO2 thin films were exposed to a layer of pure (MilliQ) water in the presence of a synchrotron x-ray beam. Experiments were conducted on the I07 beamline at the Diamond Light Source, utilising a 17.116 keV x-ray beam focussed in both the horizontal and vertical directions to give a beam size of 100 m 100 m and a flux of 1x10¹⁴ m-2s-1 at the sample position. The beam energy was specifically selected to be 50 eV below the U L3 absorption edge in order to prevent excitations in the UO2 surface. Slit conditions were chosen to produce a square beam profile, limiting the variation in x-ray intensity across the irradiated region.
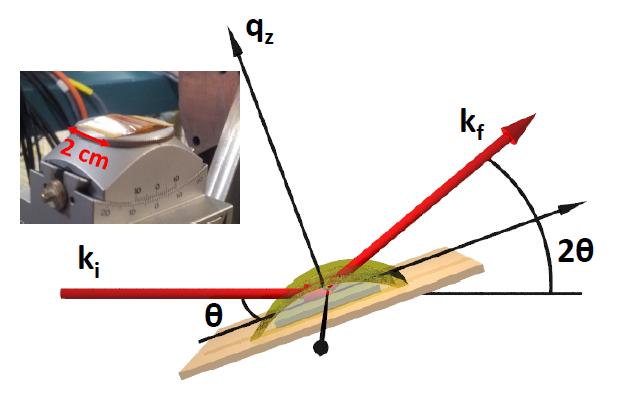
To maintain a fixed volume of water over the sample surface, the film was held within a thin layer surface tension cell, as depicted in Fig. 2. The cell comprises a domed Kapton film extended over the thin film sample, secured to a stainless steel stub using an adhesive tape. MilliQ water was introduced beneath the Kapton film, such that the entire UO2 film surface was in contact with the MilliQ water solution. With the film entirely covered by a layer of water, an intense, monochromatic x-ray beam was directed at the sample surface, inducing water radiolysis and stimulating the production of the oxidation products required for the dissolution process to occur.
In addition to providing the intense radiation fields required to induce water radiolysis, this technique additionally utilises the x-rays to monitor the change in morphology of the UO2 surface. This dual source-probe approach, utilises x-ray reflectivity (XRR) in a specular geometry. These surface sensitive techniques allow for changes in the electron density, surface roughness, interface structure, crystallinity and eventual dissolution of the UO2 film to be probed as a function of exposure time. The ability to access such a wide range of information, enables detailed observation of the dissolution process as it unfolds at the surface of the UO2 film. This level of detail cannot be observed using a bulk UO2 sample; considering a typical energy range for a synchrotron single crystal diffraction beamline (10 - 20 keV) and the angles of incidence required to measure the associated reflections for UO2, the penetration of the x-ray beam into the UO2 is of the order of several microns. Therefore, any changes that occur on the surface of the sample, where the dissolution is concentrated, will be masked by the signal generated from the unchanging bulk. However, by conducting such experiments on a UO2 thin film sample, with a thickness in the order of 100 Å, any changes occurring on the surface of the film will be evident. Implementing a thin film approach therefore provides unique sensitivity to any induced structural changes taking place at the UO2 surface. This, coupled with the ability to utilise epitaxial thin films to isolate the effect of crystallographic orientation, makes this developed methodology particularly advantageous for conducting UO2 dissolution studies.
III RESULTS
III.1 Sample Characterisation
Prior to the dissolution experiment, XRR was used to determine the starting layer thickness and roughness for each sample. The recorded XRR spectra were fitted using the GenX computer program Björck and Andersson (2007), which generates theoretically calculated reflectivity profiles using the Parratt recursion method of calculating transmitted and reflected wave fields Parratt (1954). The calculated profiles are fitted to the experimental data using a differential evolution algorithm; in order to avoid local minima, a problem that is regularly encountered when modelling x-ray reflectivity spectra. The fits presented here use the ‘simplex best 1 bin’ fitting method and a figure of merit (FOM) of LogR1 Björck and Andersson (2007).
| Sample | t (Å) | (Å) | t (Å) | (Å) |
|---|---|---|---|---|
| (001) UO2 | 68.8(3) | 7(1) | 11.4(8) | 4(1) |
| (110) UO2 | 71.0(1) | 8(1) | 15.0(3) | 6(2) |
| (111) UO2 | 69.0(6) | 3.4(1) | 7.0(1) | 4(1) |
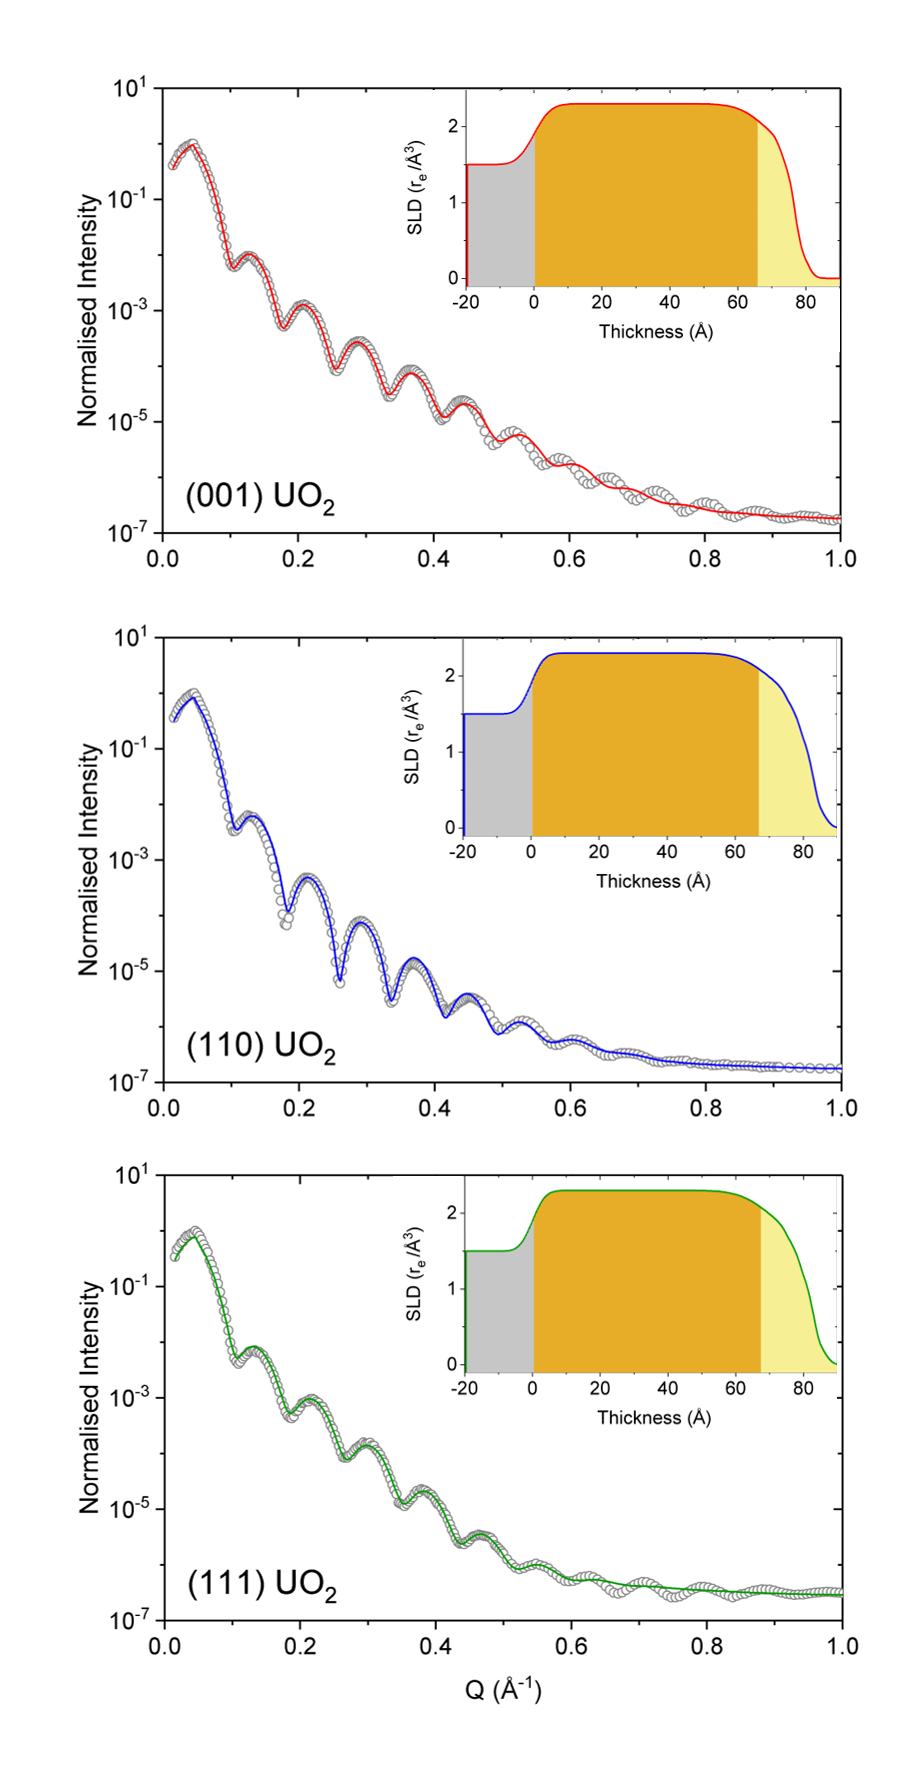
Figure 3 shows the XRR profiles recorded for the (001), (110) and (111) UO2 thin films, where the data are shown as open grey circles and the fits are displayed as solid red, blue and green lines, respectively. The corresponding inset for each reflectivity spectra displays the scattering length density (SLD) profile. As shown, sample was modelled as three distinct layers: the YSZ substrate (grey), UO2 film (dark yellow), and a higher oxide UOX phase (light yellow), with the UOX layer consisting of a series of UO2 monolayer slices. Each layer is defined by the material density (rsub, r, r) given in molecules per Å3, the layer thickness (tsub, t, t) in ngstroms, and the roughness of each interface (sub, , ), measured as the root mean squared of the fluctuations in the height of the layer (Å).
The layer densities of the substrate and stoichiometric UO2 layer were fixed at theoretical values of 0.0266 molecules per Å3 and 0.02445 molecules per Å3 respectively, whereas the density of the slices comprising the UOX layer were allowed to vary, each having a lower density than the stoichiometric UO2 value and decreasing in value on approach to the film surface. This process was applied for each of the three samples; he corresponding fit parameters are given in Table 1, where the quoted thickness parameter for the UOX layer assumes half the density of UO2, the average between the bulk value and air, to give an average layer thickness.
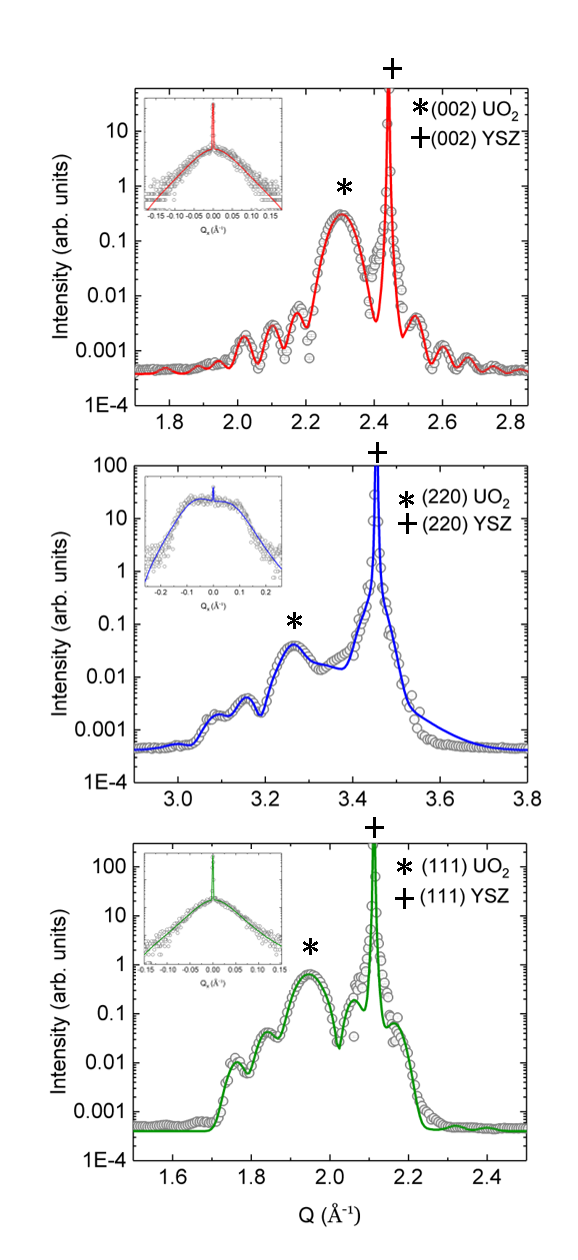
In addition to XRR, the structural properties of each film were also characterised using longitudinal , rocking curve and off-specular XRD measurements, enabling the film epitaxy to be determined in both the specular direction and in the plane of the films. Figure 4 displays the longitudinal spectra recorded for each sample. The data are fitted with a series of Gaussian peaks to model the Laue fringes extending out from the Bragg peak, and an asymmetrical Lorentzian squared term to reproduce the sharp substrate Bragg peak. Using these fits, the central Bragg peak positions were extracted, enabling the lattice spacing, d(hkl), of both the film and substrate to be determined. These values are given in Table 2 alongside the corresponding film strain and percentage deviation from bulk lattice spacings. Although not shown here, off-specular diffraction scans, were also performed to ensure the films were epitaxial in the plane of the film in addition to the specular direction. Although the films demonstrated in-plane epitaxy, only a limited number of off-specular peaks were explored and as such in-plane lattice parameters were not well characterised and are therefore not reported here.
The corresponding rocking curve measurement taken at the specular UO2 Bragg peak for each sample is displayed in the inset of Fig. 4. For the (001) and (111) oriented films, a two component rocking curve profile is observed, where the broad component has been fitted with a Lorentzian squared term and the narrow component with a Gaussian function.
For the (110) film surface, the mosaic is different. Although the overall roughness in the specular direction is similar to the (001) surface, the off-specular intensity can no longer be fit with just a simple Lorentzian squared peak centered at Qx = 0. The central sharp component is much smaller for this surface than for the other two principle directions, and the scattered intensity falls off much slower. This could reflect a more complicated surface structure, that may perhaps be related to the (110) surface being the only polar UO2 surface investigated.
| Sample | dUO2 (Å) | bulk dev. | dYSZ (Å) | bulk dev. |
|---|---|---|---|---|
| (001) UO2 | 5.47(2) | -0.4 | 5.15(2) | |
| (110) UO2 | 3.82(2) | - 1.2 | 3.45(2) | +4.8 |
| (111) UO2 | 3.22(2) | +2.0 | 2.97(1) | +0.4 |
III.2 UO2 Dissolution
Prior to exposing the sample to the x-ray beam, XRR measurements were initially recorded both before and after exposing the sample to water. No change in the reflectivity profiles were observed, demonstrating that any changes in the surface morphology is a response of radiolytic dissolution through exposure of the water to the synchrotron beam.
To induce radiolysis of the water, the thin film surface tension cell was exposed to the synchrotron x-ray beam for a selected exposure time. During this exposure, it is necessary to fix a low incident beam angle, such that the footprint of the beam extends across the entire sample in the direction parallel to the beam. Given the beam was focussed to 100 m in the vertical direction, the incident beam angle , was fixed at 0.5 ∘ such that the footprint extended to 11.5 mm, entirely covering the length of the film. To ensure the volume of water between the Kapton film and the sample surface remained constant during all measurements, a series of procedures were followed. Firstly, on aligning each sample the beam was positioned centrally along both x and y dimensions of the sample. Once aligned, the Kapton dome was constructed parallel to the x-ray beam as shown in Fig. 2. This ensured that the volume of water above the sample surface varied only in the direction perpendicular to the beam and not parallel, such that the volume remains constant at all points along the beam footprint. Additionally, during repeat experiments of increasing exposure times, the Kapton dome was identically reconstructed using fixed markers placed on the stainless-steel stub.
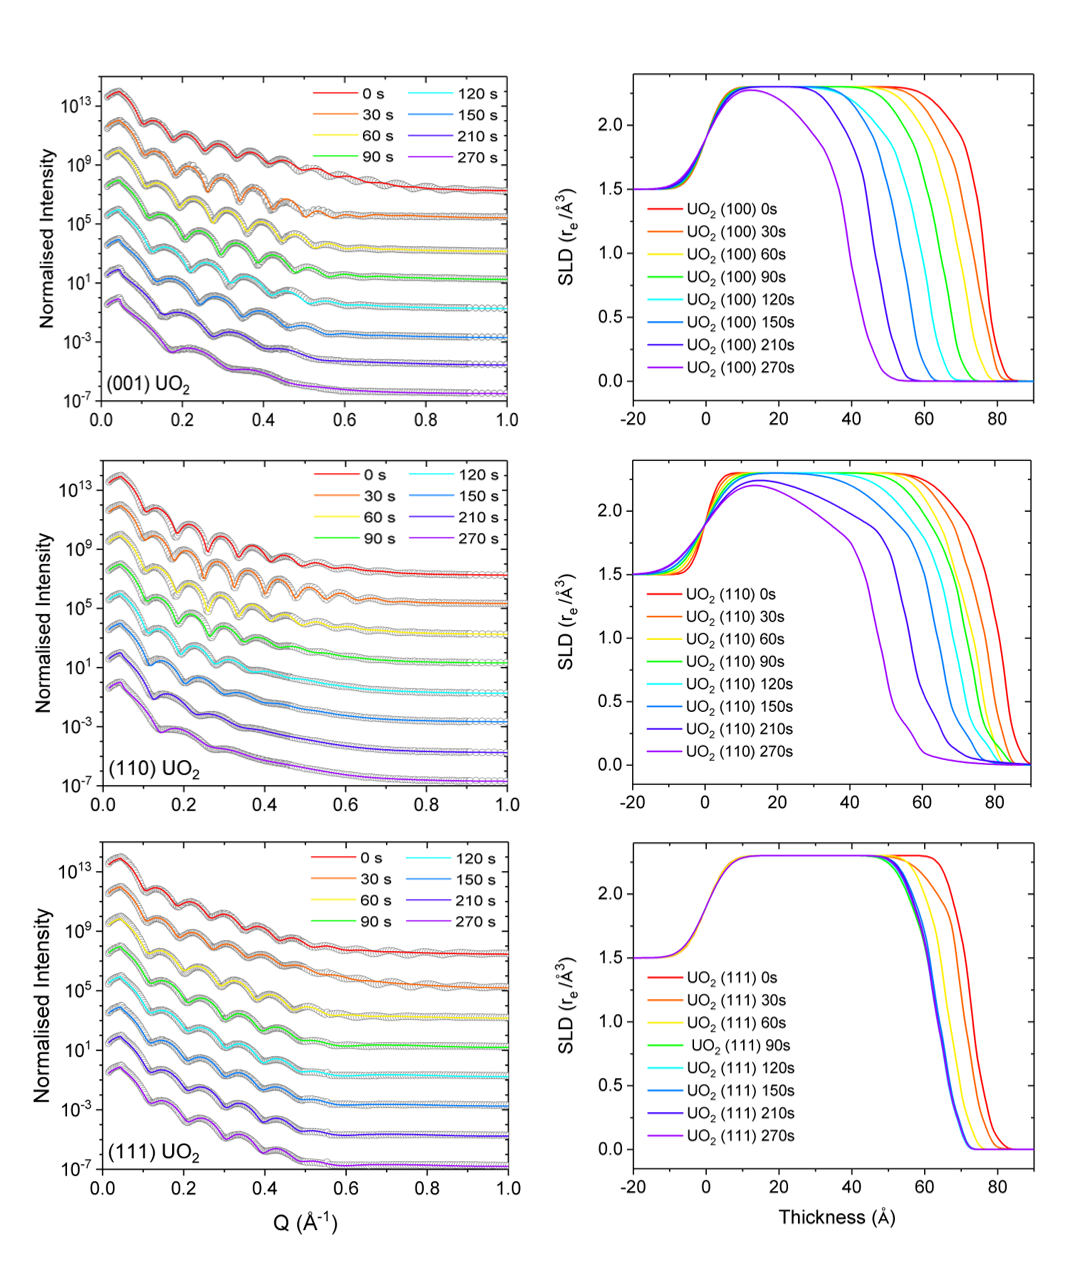
The effect of crystal orientation on the dissolution of epitaxial UO2 thin films has been investigated for three principle orientations: (001), (110), and (111). Figure 5 shows the x-ray reflectivity spectra (left) and associated SLD plots (right) for each film, after corrosion times of 0s, 30s, 60s, 90s, 120s, 150s, 210s and 270s. The data are shown as open grey circles, and the fitted calculations are given by the solid red, orange, yellow, green, light blue, blue, dark blue, and purple lines,for increasing corrosion times. All XRR profiles (Fig. 5(left)) are shown to vary as a function of corrosion, with the Kiessig fringes both increasing in separation and becoming further dampened, indicating a reducing film thickness and increasing film roughness as a function of corrosion time. The corresponding SLD profiles (Fig. 5(right)) depict this behaviour more clearly, with the total film thickness reducing over the course of the corrosion, and the electron density profile becoming more graduated between the UO2 and UOX boundary.
IV DISCUSSION
IV.1 Effect of Crystallographic Orientation
Characterisation of the (001), (110) and (111) UO2 films by x-ray reflectivity prior to the dissolution experiments, showed the films to have similar UO2 starting thicknesses of approximately 70 Å. Each sample was additionally found to comprise an oxidised surface layer, UOX, however, a variation in thickness of this layer was observed across the different orientations. As detailed in Table 1, the thickness varied from 7 Å to 15 Å, with the thinnest UOX layer found on the (111) surface.
The observed differences in starting UOX thickness (Table 1) may be attributed to the surface terminations of each film orientation. As the (110) oriented film is the only polar, stoichiometric UO2 surface investigated, we suggest that the enhanced surface oxidation is caused by the increased exposure of uranium atoms at the film/air interface. This is in contrast to the non-polar, oxygen terminated (111) and (001) surfaces, where the uranium atoms are buried. The (111) surface is however known to be significantly more stable than the (001) Bottin et al. (2016), which in fact is not predicted to be stable by theoretical calculations. The higher surface energy of the (001) surface may therefore account for the increased UOX thickness observed for the (001) film compared with the more stable (111).
X-ray diffraction measurements of the specular reflections for each film, enabled the specular lattice spacings, d(hkl), to be determined, from which the percentage deviation from the bulk lattice parameter was calculated, Table II. These induced strains showed slight variations across the different orientations, however, the differences are not believed to have significant effect on the corrosion rates.
To induce radiolytic dissolution of the UO2 films, each sample was exposed to MilliQ water in the presence of the x-ray beam for a series of exposure times, after which XRR profiles were collected. For the (001) and (110) oriented films, the separation of the reflectivity fringes is shown to significantly increase over the 270 s corrosion timescale, indicating a decrease in the film thickness as demonstrated by the SLD profiles in Fig. 5 (right) However, the profiles displayed for the (111) film, show a less significant change over the same exposure times, suggesting that the (111) orientation of UO2 is less susceptible to the radiolytic environment.
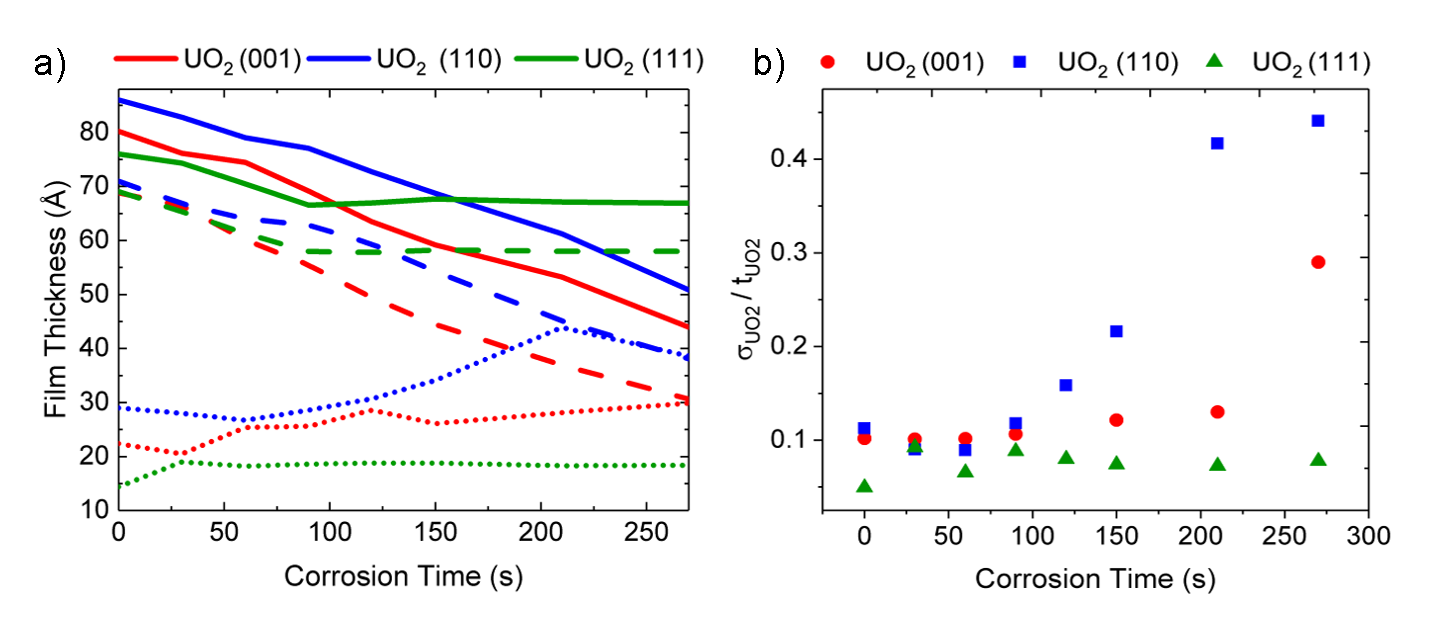
Through analysing the XRR spectra after each recorded corrosion interval, the thickness parameters of both the UO2 and UOX layers were extracted in order to compare the rate of dissolution for each film orientation. Figure 6(a) displays the layer thicknesses comprising the (001), (110), and (111) oriented thin film samples as a function of corrosion time, represented by the red, blue, and green lines. The UO2 and UOX thicknesses are shown as dashed and solid lines, respectively. Shown as dotted points are the change of the ‘dissolution thickness’, which we define as the sum of the UO2 roughness, plus the thickness and roughness of the UOX layer as a function of exposure. As shown, between 0 and 90 s, each UO2 orientation is observed to corrode at an approximately comparable rate, however after 90 s a distinct difference is observed in the corrosion profiles. While the (001) and (110) orientations continue to corrode at an approximately linear rate, further corrosion of the (111) oriented film is not observed.
For the (111) oriented UO2 film, a total of 9.6 Å of material is found to have been removed from surface after 90 s of corrosion. This thickness approximately correlates with the loss of one (111)-UO2 monolayer. This suggests that after the removal of the surface layer, which may be more susceptible to dissolution as a result of surface defects or oxidation, the (111) UO2 thin film is prevented from further corrosion as a result of surface termination.
Additionally, Fig. 6(b) highlights the change in roughness, by plotting the roughness of the UO2 layer, normalised by the thickness of the remaining UO2 layer.
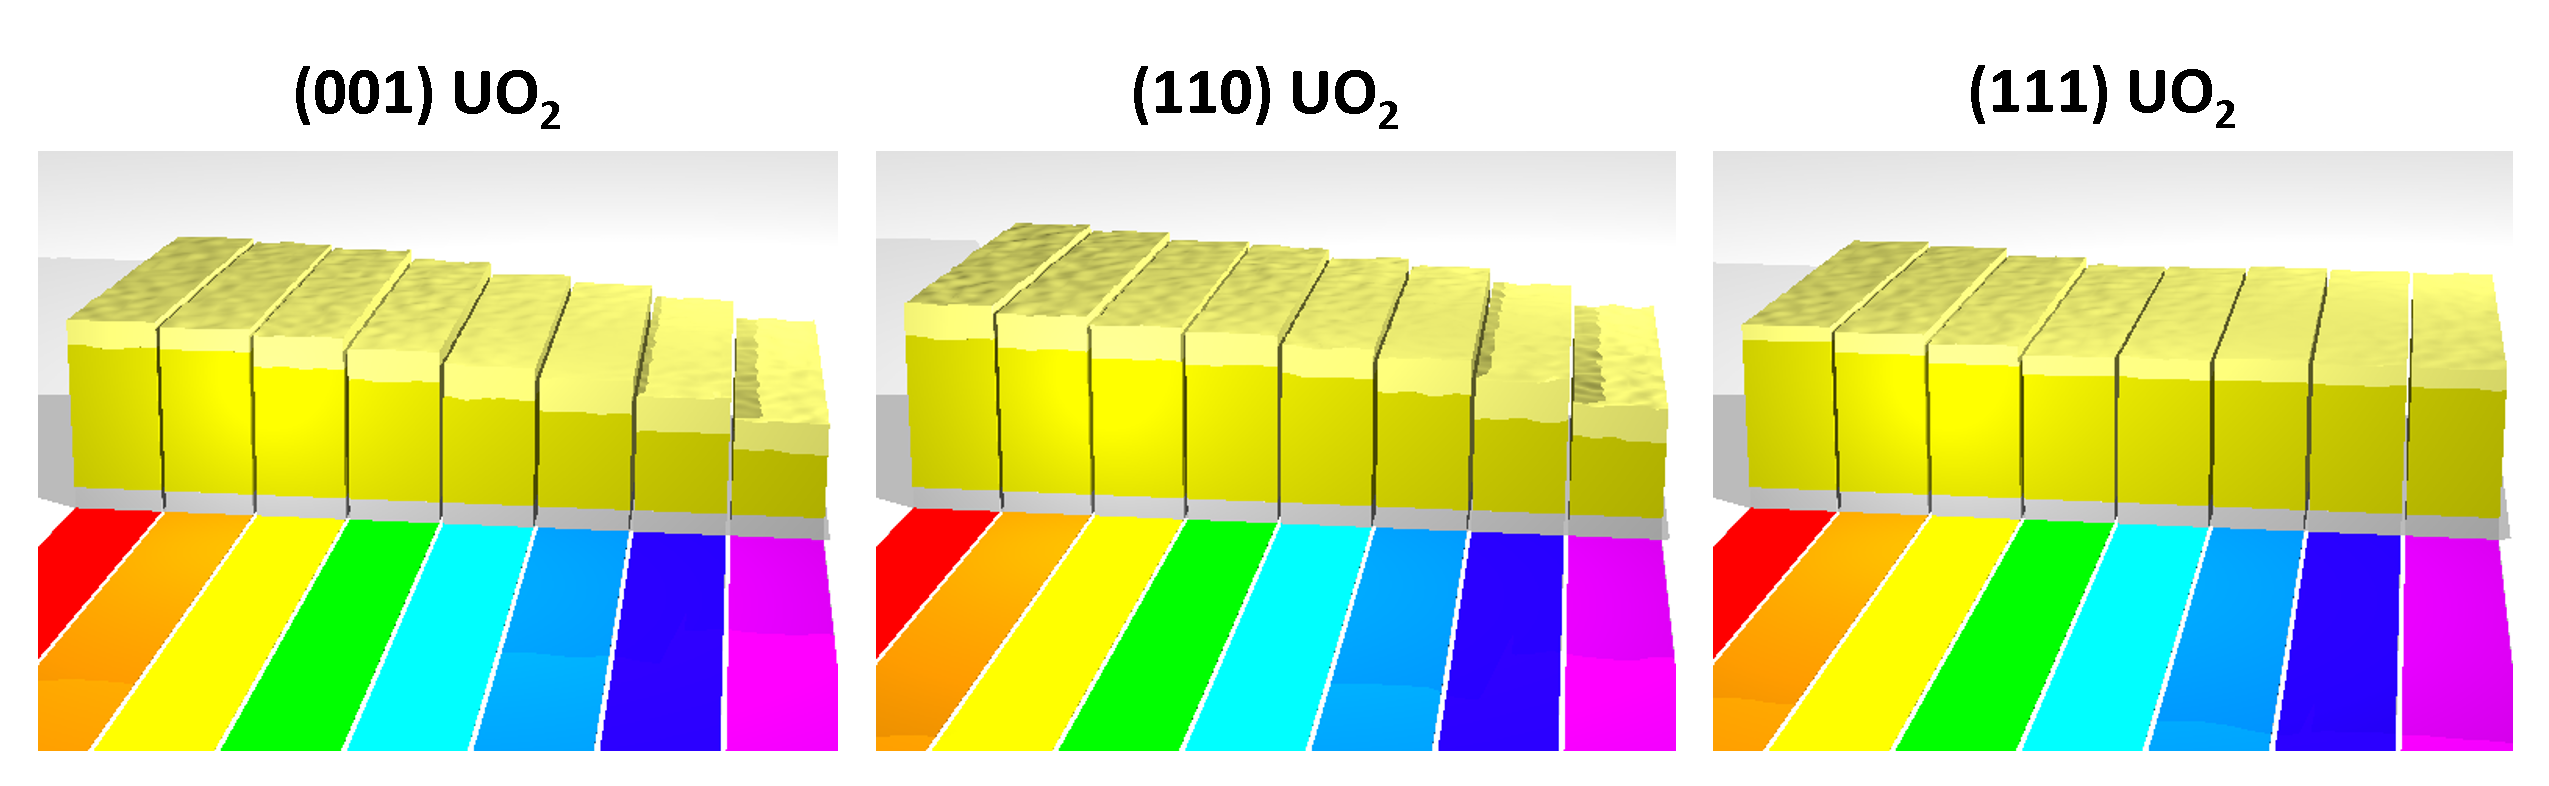
Combining the extracted layer thickness and roughness values extracted from the XRR analysis, it is possible to build up a model of the films morphology as a function of corrosion time, this is shown schematically in Fig. 7, where the dissolution is shown to progress from left to right, and the substrate, UO2 and UOX layers are again displayed in grey, dark yellow and light yellow respectively.
As the UO2 (111) surface is well known to be entirely oxygen terminated Bottin et al. (2016); Ellis and Taylor (1980), and the most stable of the principal crystallographic orientations, it is perhaps unsurprising that the (111) UO2 film is less susceptible to corrosion in comparison with the (110) and (001) orientations. However, although the (111) UO2 surface may be anticipated to undergo dissolution at a slower rate than the (001) and (110) surfaces, the observation that the corrosion is completely halted after the loss of the initial surface layer is significant. This result may have important consequences for theoretical dissolution models, as it is evident that orientation dependence must be taken into consideration when modelling rate of dissolution of UO2 surfaces.
It is clear that a UO2+x layer is present on all surfaces prior to dissolution, however determining how this layer changes as a function of corrosion in challenging. As Fig. 6(a) shows, the thickness of the dissolution zone increases for the (001) and (110) surfaces. The density of the top layers are certainly below that of UO2.00 (see Fig. 5), however XRR cannot determine the exact stoichiometry of the UO2+x layer. XPS measurements have been attempted, but the changes in the spectra are small, leaving an uncertainty in this approach Rennie . One problem is the lack of reliable standards for XPS spectra in the different valence states in the uranium oxides.
IV.2 X-ray induced radiolysis
Within this study x-rays were utilised to induce water radiolysis, however it is noted that the vast majority of UO2 dissolution studies are primarily concerned with replicating radiolytic conditions induced by alpha radiation Shoesmith (2000); Sunder et al. (2004, 1997); Bailey et al. (1985); Wren et al. (2005). This is because these studies focus on the radiolytic environments predicted to occur thousands of years into long term spent nuclear fuel storage, i.e. when the and fields have significantly decayed. Given that there is potential for UO2 fuel to come into contact with water earlier in the fuel cycle, it is important to additionally assess the effect of gamma radiation, which x-ray radiation more accurately represents.
| Radiation | G(-H2O) | G(H2) | G(H2O2) | G(e) | G(H∙) | G(OH∙) | G(HO) |
|---|---|---|---|---|---|---|---|
| , fast | -0.43 | 0.047 | 0.073 | 0.28 | 0.062 | 0.28 | 0.0027 |
| 12MeV | -0.294 | 0.115 | 0.112 | 0.0044 | 0.028 | 0.056 | 0.007 |
In particular, it is important for the effect of alternate types of radiation to be studied in isolation, in order to determine whether different ionising species affect the rate and mechanism of UO2 dissolution. Table 3 highlights significant differences in radiolytic yields, known as G values determined by Choppin et al. Choppin et al. (1995), for both radiation and 12 MeV particles. As shown, for radiation, H2O2 is the most dominant radiolytic species, whereas for radiation OH∙ becomes more important. Although the different oxidants all act to drive UO2 dissolution, the mechanism for oxidation and thus the rate of dissolution, is dependent upon the radiolytic species.
A significant body of work has been conducted to investigate UO2 dissolution under a range of radiolytic conditions, however the role of individual oxidants is not well understood Ekeroth et al. (2006). Studies performed by Ekeroth et. al Ekeroth et al. (2006), show that despite the increased yield of OH∙ and HO for radiolysis, the short lifetimes of these species result in significantly higher steady state concentrations of H2O2 and O2. Even considering the increased oxidation rate of UO2 for the radical species, it is predicted that under gamma radiation H2O2 and O2 are the key drivers of UO2 dissolution Ekeroth et al. (2006).
However, as discussed in our previous publication Springell et al. (2015), the corrosion observed within our x-ray induced dissolution experiments is distinctly confined within the path of the x-ray beam. This may suggest that the shorter lived radical species, which are confined within the beam path, have a much more significant effect on the dissolution mechanism.
To further investigate the role of short lived species in greater detail, it is necessary to isolate the effect of individual corrosion species, however, conducting such experiments is increasingly complex. Information on the relative concentrations of oxidant species could be obtained through compositional analysis of the water, however given the short lifetimes of some of the generated oxidants, in-situ analysis would be required. While this in itself presents a significant experimental challenge, the additional limitation of having a very small area of water irradiated by the x-ray beam makes performing such measurements on the I07 beamline impossible. An alternative experimental method would be to introduce a chemical species to the water solution such that specific oxidant species are scavenged and thus do not contribute to the dissolution. However, introducing additional chemical species to scavenge alternate oxidant products would significantly alter the chemistry of the water solution, introducing an additional experimental parameter that would make the results more difficult to interpret.
An alternative approach would be to conduct a comparative set of dissolution experiments whereby water radiolysis is induced using alpha radiation. In this way, corrosion rates can be generated for two distinct water chemistries, comprising vastly different oxidant compositions, and thus producing a set of simultaneous rate equations allowing the influence of individual parameters to be determined. With the advent of high energy irradiation beamlines, high fluxes of alpha particles can be produced so that such experiments could be conducted.
V CONCLUSIONS
The effect of crystallographic orientation on the radiolytic dissolution rate of UO2 has been investigated using (001), (110) and (111) oriented UO2 thin films exposed to water in the presence of a high flux synchrotron x-ray beam. Analysis of x-ray reflectivity measurements recorded over a total corrosion time of 270s enabled the film morphologies to be determined as a function of exposure time. Initially, corrosion is observed to progress at comparable rate for each crystallographic orientation, however after 90 s of exposure, no further corrosion is observed for the (111) orientated UO2 thin film. This contrasts with the (001) and (110) oriented films that are observed to continually corrode at an approximately linear rate. The stark contrast in dissolution behaviour of the (111) oriented film is attributed to the surface termination. This result may have important consequences for theoretical dissolution models, as it is evident that orientation dependence must be taken into consideration to obtain accurate long-term predictions of the dissolution behaviour of UO2. While it has been demonstrated that both the x-rays and the water interface are essential to induce corrosion, obtaining a full understanding of the mechanisms responsible for UO2 dissolution requires further investigation. This topic remains a broad field of research, and the results presented here highlight the need to understand the role of individual oxidant species on the corrosion mechanism.
VI REFERENCES
References
- He et al. (2012) H. He, M. Broczkowski, K. O. Neil, D. Ofori, and D. Shoesmith, NWMO TR-2012-09, Tech. Rep. (NSERC, NWMO and Western University, 2012).
- Shoesmith (2000) D. W. Shoesmith, Journal of Nuclear Materials 282, 1 (2000).
- Sunder et al. (1997) S. Sunder, D. Shoesmith, and N. Miller, Journal of Nuclear Materials 244, 66 (1997).
- Matzke (1992) H. J. Matzke, Journal of Nuclear Materials 190, 101 (1992).
- Shoesmith (2007) D. W. Shoesmith, NWMO TR-2007-03, Tech. Rep. (The University of Western Ontario, 2007).
- Shoesmith and Sunder (1992) D. W. Shoesmith and S. Sunder, Journal of Nuclear Materials 190, 20 (1992).
- Le Caër (2011) S. Le Caër, Water 3, 235 (2011).
- Spinks and Woods (1990) J. Spinks and R. Woods, An Introduction to Radiation Chemistry, 3rd ed. (John Wiley & Sons, Ltd, New York, 1990).
- Bailey et al. (1985) M. Bailey, L. Johnson, and D. Shoesmith, Corrosion Science 25, 233 (1985).
- Sunder et al. (2004) S. Sunder, N. H. Miller, and D. W. Shoesmith, Corrosion Science 46, 1095 (2004).
- Shoesmith and Sunder (1991) D. W. Shoesmith and S. Sunder, SKB Technical Report (1991).
- Shoesmith et al. (1989) D. Shoesmith, S. Sunder, M. Bailey, and G. Wallace, Corrosion Science 29, 1115 (1989).
- Sunder et al. (1991) S. Sunder, D. Shoesmith, R. Lemire, M. Bailey, and G. Wallace, Corrosion Science 32, 373 (1991).
- Clarens et al. (2005) F. Clarens, J. de Pablo, I. Casas, J. Giménez, M. Rovira, J. Merino, E. Cera, J. Bruno, J. Quiñones, and A. Martínez-Esparza, Journal of Nuclear Materials 345, 225 (2005).
- Ekeroth et al. (2006) E. Ekeroth, O. Roth, and M. Jonsson, Journal of Nuclear Materials 355, 38 (2006).
- Eriksen et al. (2012) T. E. Eriksen, D. W. Shoesmith, and M. Jonsson, Journal of Nuclear Materials 420, 409 (2012).
- Strehle et al. (2012) M. M. Strehle, B. J. Heuser, M. S. Elbakhshwan, X. Han, D. J. Gennardo, H. K. Pappas, and H. Ju, Thin Solid Films 520, 5616 (2012).
- Bao et al. (2013) Z. Bao, R. Springell, H. C. Walker, H. Leiste, K. Kuebel, R. Prang, G. Nisbet, S. Langridge, R. C. C. Ward, T. Gouder, R. Caciuffo, and G. H. Lander, Physical Review B 88, 134426 (2013).
- Springell et al. (2015) R. Springell, S. Rennie, L. Costelle, J. Darnbrough, C. Stitt, E. Cocklin, C. Lucas, R. Burrows, H. Sims, D. Wermeille, J. Rawle, C. Nicklin, W. Nuttall, T. Scott, and G. Lander, Faraday Discuss. 180, 301 (2015).
- Teterin et al. (2016) Y. A. Teterin, A. J. Popel, K. I. Maslakov, A. Yu Teterin, K. E. Ivanov, S. N. Kalmykov, R. Springell, T. B. Scott, and I. Farnan, Inorg. Chem. 55, 8059 (2016).
- Popel et al. (2017) A. J. Popel, V. G. Petrov, V. A. Lebedev, J. Day, S. N. Kalmykov, R. Springell, T. B. Scott, and I. Farnan, Journal of Alloys and Compounds 721, 586 (2017).
- Bottin et al. (2016) F. Bottin, G. Geneste, and G. Jomard, Physical Review B 93, 115438 (2016).
- Momma and Izumi (2011) K. Momma and F. Izumi, J. Appl. Cryst 44, 1272 (2011).
- Björck and Andersson (2007) M. Björck and G. Andersson, J. Appl. Cryst. 40, 1174 (2007).
- Parratt (1954) L. G. Parratt, Physical Review 95, 359 (1954).
- Ellis and Taylor (1980) W. P. Ellis and T. N. Taylor, Surface Science 91, 409 (1980).
- (27) S. Rennie, Unpublished .
- Wren et al. (2005) J. C. Wren, D. W. Shoesmith, and S. Sunder, Journal of The Electrochemical Society 152, B470 (2005).
- Choppin et al. (1995) G. Choppin, J. Liljenzin, and J. Rydberg, Radiochemistry and Nuclear Chemistry, 3rd ed. (Butterworth-Heinemann Ltd., Oxford, 1995).