Spectroscopic Constraints on UV Metal Line Emission at : The Nature of Ly Emitting Galaxies in the Reionization-Era
Abstract
Recent studies have revealed intense UV metal emission lines in a modest sample of Lyman- emitters, indicating a hard ionizing spectrum is present. If such high ionization features are shown to be common, it may indicate that extreme radiation fields play a role in regulating the visibility of Ly in the reionization era. Here we present deep near-infrared spectra of seven galaxies with Ly emission at (including a newly-confirmed lensed galaxy at ) and three bright photometric targets. In nine sources we do not detect UV metal lines. However in the galaxy EGSY8p7, we detect a 4.6 emission line in the narrow spectral window expected for NV1243. The feature is unresolved (FWHM90 km s-1) and is likely nebular in origin. A deep H-band spectrum of EGSY8p7 reveals non-detections of CIV, He II, and OIII]. The presence of NV requires a substantial flux of photons above 77 eV, pointing to a hard ionizing spectrum powered by an AGN or fast radiative shocks. Regardless of its origin, the intense radiation field of EGSY8p7 may aid the transmission of Ly through what is likely a partially neutral IGM. With this new detection, five of thirteen known Ly emitters at have now been shown to have intense UV line emission, suggesting that extreme radiation fields are commonplace among the Ly population. Future observations with JWST will eventually clarify the origin of these features and explain their role in the visibility of Ly in the reionization era.
keywords:
galaxies – high-z –reionization1 Introduction
The reionization of the intergalactic medium (IGM) is a pivotal milestone in the early universe, marking the point at which almost every baryon has been impacted by structure formation. Over the past two decades, substantial efforts have been devoted to improving our understanding of the process. While our knowledge remains very limited, a picture describing the most basic details of reionization has emerged. Measurement of the optical depth to electron scattering of the cosmic microwave background photons (Planck Collaboration et al., 2016) and deep spectra of high redshift quasars (e.g., McGreer et al. 2015) indicate that the process is underway by and is completed at or before . Deep imaging surveys with the Hubble Space Telescope (HST) have enabled the identification of large numbers of color-selected galaxies over this redshift range (e.g., McLure et al. 2013; Bouwens et al. 2015b; Finkelstein et al. 2015; Atek et al. 2015; Livermore et al. 2017; Ishigaki et al. 2018; for a review see Stark 2016), revealing that faint star forming galaxies may provide the dominant source of photons required for ionizing intergalactic hydrogen (e.g., Robertson et al. 2015; Bouwens et al. 2015a; Stanway et al. 2016).
Observational efforts are now focused on mapping the evolution of the IGM at , when the bulk of reionization is thought to occur. Most of what we currently know about the IGM at these redshifts comes from measurements of Ly emission from star forming galaxies. As the IGM becomes partially neutral, the damping wing absorption of intergalactic hydrogen begins to attenuate Ly emission, reducing the visibility of Ly emission in star forming galaxies. The decline of the Lyman- emitter (LAE) population can be probed by the luminosity function of narrowband-selected Ly emitters (e.g., Malhotra & Rhoads 2004; Kashikawa et al. 2006; Ouchi et al. 2010; Hu et al. 2010; Konno et al. 2018; Ota et al. 2017) or the evolution of the Ly equivalent width (EW) distribution in continuum-selected galaxies (e.g., Stark et al. 2010; Fontana et al. 2010; Ono et al. 2012; Schenker et al. 2014; Pentericci et al. 2014; Tilvi et al. 2014; Caruana et al. 2014; Schmidt et al. 2016). Both tests demonstrate that the visibility of Ly emitting galaxies drops significantly in the 170 Myr between and . To explain the magnitude of this drop, it is thought that the IGM must become significantly neutral () by (e.g., Dijkstra et al. 2014; Mesinger et al. 2015; Mason et al. 2017). While such results were initially met with skepticism, the first handful of quasars at have suggested similarly large neutral hydrogen fractions (e.g., Mortlock et al. 2011; Greig et al. 2017; Bañados et al. 2018; c.f.Bosman & Becker 2015).
Progress in identifying Ly at has recently begun to ramp up, revealing a more complex picture than described above. Much of the success has come from a photometric selection of four galaxies in the CANDELS fields (Roberts-Borsani et al. 2016; hereafter RB16). Each system is very bright (), massive ( M⊙ in stars), and red in Spitzer/IRAC [3.6]-[4.5] color, indicating the presence of very strong [OIII]+H emission. Follow-up Keck spectroscopy has shown that Ly emission is present in all four galaxies (Oesch et al. 2015; Zitrin et al. 2015; Stark et al. 2017; RB16), including record-breaking detections at (Oesch et al., 2015) and (Zitrin et al., 2015). The large Ly emitter fraction in the RB16 sample is greater than the success rates found in other galaxy samples at similar redshifts. How Ly emission can be transmitted so effectively from these four galaxies while being so strongly attenuated from most other systems at is still not clear.
The conventional explanation is that because of their high mass, the RB16 galaxies trace a clustered population within overdense regions which ionize their surroundings early. As a result, they should be situated in large ionized patches of the IGM, increasing the transmission of Ly (Mason et al., 2018). The visibility of Ly in high mass galaxies is also favored by the line profile of Ly that emerges following transfer through the circumgalactic medium. With both a larger line width and velocity offset than in lower mass galaxies (Erb et al., 2014; Stark et al., 2017), a larger fraction of Ly in high mass galaxies will be redshifted far enough away from line center to escape the strong damping wing absorption of the neutral IGM (Stark et al., 2017; Mason et al., 2017). Nevertheless surveys for Ly in other massive star forming galaxies at have been met with a much lower success rate than found in the RB16 sample (e.g. Schenker et al. 2014; Bian et al. 2015; Furusawa et al. 2016).
An alternative explanation that is gaining traction posits a link between Ly visibility at and the intensity of the galaxy ionizing spectrum. The large [OIII]+H emission of both the RB16 galaxies (and several other Ly emitters) signals an extreme radiation field that might indicate larger than average Ly production rates, boosting the likelihood of detection. The connection between Ly visibility and the hardness of the ionizing spectrum has been strengthened with the discovery of intense UV metal line emission (CIII], NV, He II) in two of the RB16 galaxies (Stark et al., 2017; Laporte et al., 2017) and two additional color-selected Ly emitters at (Stark et al., 2015b; Tilvi et al., 2016). Such intense high ionization features are extraordinarily rare at lower redshift, likely requiring the presence of an AGN or metal poor stellar population (Feltre et al., 2016; Gutkin et al., 2016; Jaskot & Ravindranath, 2016; Nakajima et al., 2017). These results indicate that variations in radiation field may play an important role in regulating Ly visibility at ; failure to account for such variations would lead to an incorrect IGM ionization state.
Here we present new constraints on the presence of high ionization features in Ly emitters at , including the first investigation of UV metal lines in the galaxy EGSY8p7. We aim to determine whether extreme radiation fields are present in all Ly emitters in the reionization-era and to better characterize the far-UV spectra of those systems with existing metal line detections. We detail the spectroscopic observations in §2 and describe the spectra of individual sources in §3. In §4, we discuss implications for the nature of Ly emitters and review what is known about the distribution of UV metal line equivalent widths at high redshift.
We adopt a -dominated, flat Universe with , and . All magnitudes in this paper are quoted in the AB magnitude system (Oke & Gunn, 1983), and all equivalent widths are quoted in the rest-frame.
2 Observations
| Source | Redshift | RA | DEC | Date of Observations | Filters | texp (hr) | UV lines targeted | Ref |
|---|---|---|---|---|---|---|---|---|
| Spectroscopic Targets | ||||||||
| EGSY8p7 | 8.683 | 14:20:08.50 | +52:53:26.6 | 29-30 Apr 2016 | H | 5.93 | CIV, He II, OIII] | [1],[2] |
| EGS-zs8-1 | 7.730 | 14:20:34.89 | +53:00:15.4 | 2-3 May 2016 | J | 4.53 | CIV | [1], [3],[4] |
| … | … | … | … | 31 Jul 2017 | J | 1.87 | CIV | [1], [3], [4] |
| EGS-zs8-2 | 7.477 | 14:20:12.09 | +53:00:27.0 | 2-3 May 2016 | J | 4.53 | CIV | [1], [4] |
| … | … | … | … | 31 Jul 2017 | J | 1.87 | CIV | [1], [4] |
| A1703-zd6 | 7.045 | 13:15:01.01 | +51:50:04.3 | 29 Apr 2016 | H | 2.47 | CIII] | [5],[6] |
| A383-2211 | 6.031 | 02:48:01.39 | -03:32:58.4 | 15,18,25 Dec 2013 | VIS | 4.78 | Ly | [7] |
| … | … | … | … | … | NIR | … | CIV, He II, OIII] , CIII] | [7] |
| Abell2218-S3.a | 5.576 | 16:35:51.96 | +66:12:45.9 | 08 Sep 2015 | J | 1.33 | CIII] | [8] |
| … | … | … | … | 29 Apr 2016 | J | 1.20 | CIII] | [8] |
| Abell2218-S3.b | 5.576 | 16:35:52.08 | +66:12:51.8 | 08 Sep 2015 | J | 1.33 | CIII] | [8] |
| … | … | … | … | 29 Apr 2016 | J | 1.20 | CIII] | [8] |
| J14144+5446 | 5.426 | 14:14:46.82 | +54:46:31.9 | 07 Apr 2015 | J | 1.08 | CIII] | [9] |
| Photometric Targets | ||||||||
| A1703-zD4 | 8.4 | 13:15:07.19 | 51:50:23.5 | 29 Apr 2016 | H | 2.47 | CIII] | [10] |
| A1703-zD1 | 6.7 | 13:14:59.42 | 51:50:00.8 | 29 Apr 2016 | H | 2.47 | CIII] | [10] |
| Abell2218-C1.b | 6.7 | 16:35:54.40 | 66:12:32.8 | 29 Apr 2016 | J | 1.20 | CIV, He II, OIII] | [11] |
| Abell2218-C1.c | 6.7 | 16:35:48.92 | 66:12:02.4 | 29 Apr 2016 | J | 1.20 | CIV, He II, OIII] | [11] |
We have obtained near-infrared spectroscopic observations of four spectroscopically confirmed Ly emitting galaxies at and an additional three at . We also have obtained deep spectra of three bright sources lacking Ly emission. Observations have been obtained with Keck, VLT, and the LBT. Below we describe the observational setup and data reduction procedure.
2.1 Keck/MOSFIRE spectroscopy
The majority of spectra presented in this paper were obtained using the multi-object spectrograph MOSFIRE (McLean et al., 2012) on the Keck I telescope. Over five different observing runs between 2015 and 2017, we targeted galaxies in the EGS, Abell 1703, and Abell 2218 fields. Details of the observations are summarized in Table 1.
The spectra constrain the strength of He II and UV metal emission lines in known galaxies. Our target selection is driven by the need for sources to have precise redshifts, bright continuum flux, and redshifts which place at least one of the strong UV lines at a wavelength with significant atmospheric transmission. We designed five separate masks which are described in more detail below. For each mask, we included 1 or 2 isolated stars to monitor seeing and to calculate the absolute flux calibration. Each mask is constructed with slit widths of 07. Below we briefly describe the observing conditions and key targets. More details on the physical properties of the sources will be provided in §3.
The EGS CANDELS area contains three of the thirteen galaxies with S/N5 Ly detections. We designed two masks to cover the three targets. The first mask was focused on EGSY8p7, the galaxy confirmed in Zitrin et al. (2015). At this redshift, we are able to probe CIV, He II, and OIII] in the H-band. The CIII] line is situated between the H and K-bands in a region of poor atmospheric transmission. We obtained 5.93 hrs of on-source integration in H-band on the mask on 29-30 April 2016. Conditions were clear with seeing of 08. The mask was filled with lower redshift () sources picked to have extreme equivalent width rest-frame optical emission lines in the H-band. We will discuss the spectra of the filler sources in a separate paper (Tang et al. 2018, in prep).
The other two Ly emitters in the EGS field, EGS-zs8-1 () and EGS-zs8-2 (), are close enough to fit on the same MOSFIRE mask. We previously obtained MOSFIRE H-band observations of both systems, revealing strong CIII] emission in EGS-zs8-1 and no CIII] emission in EGS-zs8-2 (Stark et al., 2017). Here we present new J-band observations aimed at constraining the strength of CIV emission in both galaxies. The OIII] and He II emission lines are situated between the J and H-bands where atmospheric transmission is low. As with our other EGS mask, we included extreme emission line galaxies as filler targets. We obtained a total of 6.4 hours of integration in J-band, with 4.53 hours secured over 2-3 May 2016 and an additional 1.87 hours on 31 July 2017. Conditions were clear for both runs with seeing of 07 (May 2016) and 09 (July 2017).
The Abell 1703 field has several bright gravitationally lensed galaxies that are ideal for spectroscopic study (Bradley et al., 2012), including a Ly emitter at zLyα=7.045 (A1703-zd6; Schenker et al. 2012) and six additional targets with photometric redshifts between and 8.8. We previously targeted the field in J-band, revealing nebular CIV emission in A1703-zd6 (Stark et al., 2015b). We now target CIII] emission in A1703-zd6 with H-band observations of the Abell 1703 field. We also include the photometric targets A1703-zd1 and A1703-zd4 on the mask, with the goal of constraining CIII] in the former and CIV, He II, OIII], and CIII] in the latter. Empty real estate on the mask was filled with targets detected with Herschel (Walth et al, in prep). Conditions were clear with seeing of 07 throughout the 2.47 hours of on-source integration time on 29 April 2016.
The Abell 2218 cluster field has two relevant sources for UV metal line follow-up: A2218-S3, a multiply-imaged Ly emitter at zLyα=5.576 (Ellis et al., 2001) and A2218-C1, a bright triply-imaged galaxy lacking Ly emission (Kneib et al., 2004; Egami et al., 2005). We designed a mask that includes the two images of the zLyα=5.576 galaxy (S3a, S3b) and two of the images of the source (C1b, C1c). We filled the mask with other lensed galaxies in the field: C2.a (; Richard et al. 2011a), C3.a (; Elíasdóttir et al. 2007), S2.1.a (; Ebbels et al. 1996), and S6.a (; Kneib et al. 1996). We observed the mask for a total of 1.2 hours in the J-band on 29 April 2016. For the zLyα=5.576 galaxy, we also added data from a previous program (PI: Zitrin) who observed the galaxy for 1.33 hours on 08 September 2015. Both nights were clear with seeing of 09 (September 2015) and 08 (April 2016).
Data were reduced using the publicly-available MOSFIRE Data Reduction Pipeline. The pipeline performs flat fielding, wavelength calibration and background subtraction. The reduction process outputs two dimensional reduced spectra along with a signal-to-noise map and error map for each slit on the mask. Finally, one-dimensional spectra were obtained using a boxcar extraction with an aperture size of 1.5 observed seeing, typically 6-8 pixels (108 - 144). The flux calibration was performed in two stages. The telluric correction was first applied using longslit observations of a spectrophotometric standard star that we targeted prior to the science observations. The absolute flux calibration was then calculated using the known fluxes and observed counts of the isolated stars on the mask. The spectral resolution is calculated by fitting the width of isolated sky lines. For our chosen slit widths, we derive an average FWHM of 3.8 Å in the J-band and 4.7 Å in the H-band.
2.2 VLT/X-Shooter spectroscopy
One additional source (A383-2211) was observed as a part of programme 092.A-0630(A) (PI: Richard) with the instrument X-Shooter (Vernet et al., 2011) on the Very Large Telescope (VLT). The observations were performed on the nights of 15, 18, and 25 December 2013 for 6 observing blocks (OBs) of 1 hour each. Each OB comprised three exposure of 955 seconds in the visible (VIS) arm and three exposures of 968 seconds in the near infrared (NIR) arm. The VIS arm provided wavelength coverage from 5336 Å to 10200 Å at a spectral resolution of 1.1 Å, whereas the NIR arm provides coverage from 9940 Å to 24750 Å at a spectral resolution of 2.1 Å. We used a slit of size oriented at a position angle of 90°. The observations were conducted using a dither sequence of 25 along the slit. The conditions were clear with an average seeing of 06.
The data reduction was performed using version 2.2.0 of the X-Shooter pipeline. The details of the procedure were presented in Stark et al. (2015a). The pipeline outputs 18 reduced exposures which we then combine using standard IDL and IRAC routines. A spectroscopic standard star was observed on the same night to calibrate flux of the spectrum. Multiple telluric stars were observed to calculate a median telluric correction for telluric absorption in the NIR arm.
2.3 LBT/LUCI spectrosocopy
We observed the Ly emitter J141446.82+544631.9 (hereafter J1414+5446; McGreer et al. 2017) on 2015 April 07 for 1.08 hours using the LUCI near-IR spectrograph on the Large Binocular Telescope (LBT). We used the N1.8 camera and 210_zJHK grating in longslit mode. The observations were conducted in the J-band with the goal of constraining the strength of the CIII] emission line. A slit width of 10 was used, resulting in a spectral resolution of 2.93 Å. A bright reference star (J=17.9) was placed along the slit to monitor seeing and calibrate the absolute flux scale. Data were taken with a standard ABBA dither sequence with a 70 offset between the A and B positions. Conditions were clear with seeing of 10 throughout the observations.
The reduction was performed using an IDL long slit reduction package for LUCI (see Bian et al. 2010 for details). The package provides flat fielding and sky subtraction using standard routines. The wavelength solution was calculated using night sky lines. The software outputs a fully reduced 2D spectrum which we visually examined for faint emission lines. We identified the spatial position of the galaxy on the spectrum using the trace of the reference star and the known angular offset between the star and galaxy. A one dimensional spectrum was created using a boxcar extraction with a 6 pixel (15) aperture. The extracted spectrum was corrected for telluric absorption using the A0V star spectrum, and the absolute flux scale of the extracted spectrum was then derived using the flux of the reference star on the slit.
3 Results
We describe new UV spectral line constraints for the targets presented in §2. For each source, we first summarize known physical properties and then detail the results of the newly-obtained spectra.
3.1 EGSY8p7
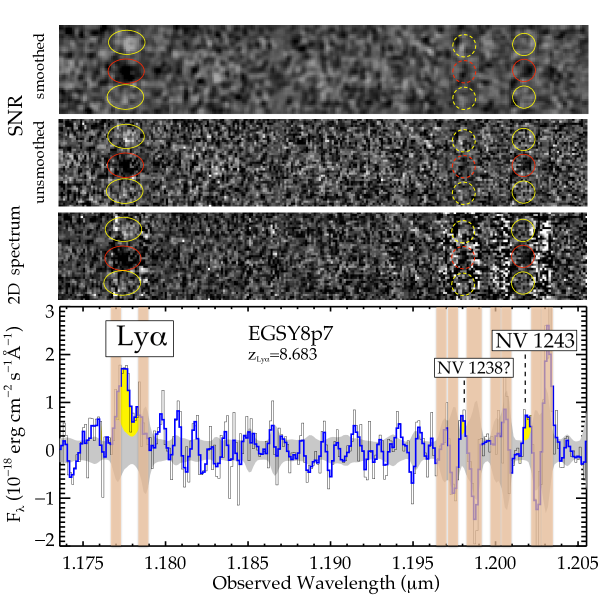
EGSY8p7 is a bright (H160=25.3) galaxy identified by RB16 and confirmed spectroscopically by Zitrin et al. (2015) via detection of Ly emission at in a J-band spectrum obtained with MOSFIRE (see Figure 1). The red IRAC color ([3.6]-[4.5]=0.76) is consistent with the presence of strong [OIII]+H emission in the [4.5] filter. A combined [OIII]+H rest-frame equivalent width of Å is required to explain the [4.5] flux excess relative to the underlying continuum (Stark et al., 2017).
The J-band spectrum and the new H-band spectrum cover 11530 Å to 13458 Å and 14587 Å to 17914 Å, respectively, corresponding to 1191 Å to 1390 Å and 1506 Å to 1850 Å in the rest-frame. In addition to Ly, this wavelength range allows constraints to be placed on NV, CIV, He II, and OIII]. We guide our search of these lines using the Ly redshift and the characteristic velocity offset of Ly from systemic. We consider Ly velocity offsets between 0 and 500 km s-1 (Erb et al., 2014; Stark et al., 2017), implying systemic redshifts in the range zsys=8.667 to 8.683 for EGSY8p7. Nebular He II, and OIII] are typically found to trace the systemic redshift (e.g., Shapley et al. 2003; Stark et al. 2014; Senchyna et al. 2017), so we predict a spectral window for each line using the range of systemic redshifts derived above. CIV is a resonant transition and is found at redshifts between systemic and that of Ly (Christensen et al., 2012; Stark et al., 2014, 2015b; Vanzella et al., 2016, 2017; Mainali et al., 2017; Laporte et al., 2017; Berg et al., 2018), so we consider a spectral window ranging from the lowest possible systemic redshift (zsys=8.667) and the Ly redshift ().
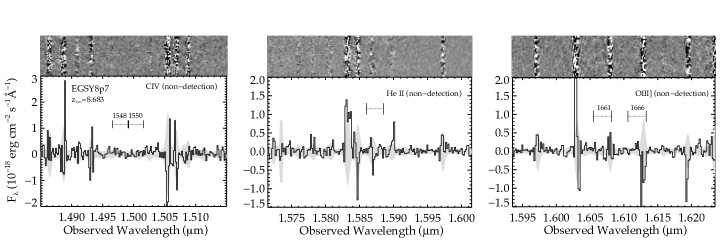
We first consider constraints on CIV, He II, and OIII] from the new H-band spectrum. Taking the range of possible systemic redshifts for EGSY8p7 that we derive above, we predict spectral windows for CIV1548 (14966 Å to 14991 Å), CIV1550 (14991 Å to 15016 Å), He II1640 (15860 Å to 15885 Å), OIII]1661 (16055 Å to 16082 Å), and OIII]1666 (16106 Å to 16133 Å). As can be seen in Figure 2, each window is mostly (80%) free from strong skylines. No significantly-detected emission lines are seen. We calculate typical 3 line flux limits in each spectral window by summing the error spectrum in quadrature over 10 Å (200 km s-1). As this is at the upper bound of line widths found for UV nebular emission lines other than Ly at these redshifts (e.g., Stark et al. 2014; Bayliss et al. 2014; James et al. 2014; Mainali et al. 2017), it provides a conservative estimate of our sensitivity to emission lines. To calculate the limits on the equivalent width, we compute the continuum flux density expected at the wavelength of each spectral line using the broadband SED fit in our previous studies (e.g., Zitrin et al. 2015; Stark et al. 2017). The measured limits on line flux and equivalent width are presented in Table 2. The non-detections place strong constraints on CIV and OIII], implying that the individual components of each doublet likely have rest-frame equivalent widths below 4.6 Å. Because He II is located in a somewhat noisier region, our constraints are less stringent. The non-detection implies a rest-frame equivalent width below 14.8 Å provided the He II feature is not obscured by the single skyline in the predicted spectral window (see Figure 2).
We now consider constraints on nebular NV in the J-band discovery spectrum from Zitrin et al. (2015). For redshifts between zsys=8.667 and zsys=8.683, we expect NV1238 and NV1243 to lie between 11975 and 11995 Å and 12017 to 12037 Å, respectively. An emission feature (S/N=4.6) is seen centered at 12019.5 Å (Figure 1), within the window where NV1243 would be expected. The feature is at the exact spatial position of the Ly line and is adjacent to but cleanly separated from skylines. The line is unresolved in the MOSFIRE spectrum (FWHM90 km s-1). We find that an aperture of 6 pixels ( the spectral resolution) maximizes the S/N. We directly integrate the object and error spectrum (the latter in the quadrature) over this window, revealing a line flux of 10-18 erg s-1 cm-2 and an error (1) of 10-18 erg s-1 cm-2. If the line is NV1243, the blue component of the doublet would be situated near two strong skylines (Figure 1) making detection difficult. Nevertheless we do detect positive emission at the precise wavelength predicted for the NV1238 feature (11981 Å), but the skylines prohibit accurate flux measurement.
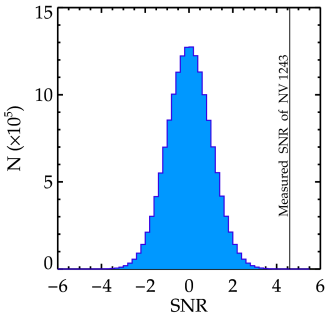
The odds of finding a 4.6 feature at the spatial position of Ly and within the narrow 500 km s-1 (16 pixel) spectral window defined above are exceedingly low. We can test this by generating a large number (106) of realizations of the error spectrum in the 16 pixel box surrounding the putative NV1243 detection. We find features with S/N in excess of 4.6 in only 32 of the 106 realizations, implying a very low probability (0.003%) that the line is not real (Figure 3). We further investigate the likelihood of the detection by looking at the significance of the emission in subsets of the stacked spectrum. The J-band data was obtained over two nights (see Zitrin et al. 2015 for details) with integration times of 158 min (night one) and 128 min (night two) contributing to the total stack. The data from the first night were obtained under significantly better conditions (seeing of 06) than the second night (08). As reported in Zitrin et al. (2015), the Ly detection significance is higher in the night one stack (S/N=6.0) than in the night two data (S/N=3.8), consistent with expectations given the longer integration time and improved seeing. The significance of the NV1243 feature is also found to be larger on night 1 (S/N=4.1) relative to night 2 (S/N=2.0). The increase in significance between night two and night one is consistent with that measured for Ly. The fact that the significance of the feature scales with atmospheric conditions in a manner consistent with Ly further bolsters confidence that the NV detection is real and associated with EGSY8p7.
The rest-frame equivalent width implied by the NV1243 detection is 4.20.9 Å. Here we derive the continuum flux (and associated error) from the broadband SED, as is standard at these redshifts. We include the error in the underlying continuum and line flux in the equivalent width, and we take care to not include filters contaminated by nebular emission in our derivation of the continuum flux. The uncertainty in the equivalent width is dominated by the line flux uncertainty which is . Using the standard theoretical flux ratio for the NV doublet (NV1238/NV1243=2; Bickel 1969; Torres-Peimbert & Pena 1984), we can estimate the total flux (8.410-18 erg cm-2 s-1) and rest-frame equivalent width (12.61.8 Å). The observed wavelength of the likely NV1243 feature would indicate a redshift of , implying a Ly velocity offset (from NV) of 362 km s-1. While NV is a resonant transition, it has been shown to trace the systemic redshift to within 20 km s-1 in another of the Ly emitters (Laporte et al., 2017; Pentericci et al., 2016). If the likely NV feature also traces the systemic redshift in EGSY8p7, it would indicate a large Ly velocity offset, consistent with other similarly massive sources at high redshift (e.g. Erb et al. 2014; Stark et al. 2017). Such a large velocity offset may aid in the escape of Ly through the IGM (Mason et al., 2017).
3.2 EGS-zs8-1 and EGS-zs8-2
Our second mask in the EGS contained EGS-zs8-1 and EGS-zs8-2 from RB16. Both are bright (H160=25.0 and 25.1, respectively) and have red IRAC [3.6]-[4.5] colors that suggest strong [OIII]+H emission (EW=911122 Å and 1610302 Å rest-frame, respectively (Stark et al., 2017). Detections of Ly in EGS-zs8-1 and EGS-zs8-2 confirm their redshifts to be =7.730 (Oesch et al., 2015) and 7.477 (RB16, Stark et al. 2017). H-band MOSFIRE observations presented in Stark et al. (2017) revealed CIII] emission in EGS-zs8-1 (rest-frame EW of Å) and a non-detection in EGS-zs8-2. The latter provides a 3 upper limit on the total CIII] EW in EGS-zs8-2 of Å. Our new J-band spectra allow us to constrain the strength of CIV emission in both sources. As with EGSY8p7, we predict the wavelength of CIV using estimates of the systemic redshift. The systemic redshift of EGS-zs8-1 (=7.723) is determined using the wavelength of the [CIII], CIII] doublet. For EGS-zs8-2 we consider systemic redshifts in the range =7.463 to 7.477, following the same approach as we took for EGSY8p7.
We consider NV redshifts between that of systemic and Ly. For EGS-zs8-1, this implies a spectral window of 10797 Å to 10815 Å (NV1238) and 10797 Å to 10815 Å (NV1243). These wavelengths are covered in the discovery Y-band MOSFIRE spectrum presented in Oesch et al. (2015). The NV1238 window is completely clear of skylines, while 37% of the NV1243 window is obscured. No emission lines are detected in either window, implying 3 upper limits on the equivalent width of NV1238 (7.4 Å) and NV1243 (29.6 Å). As NV1238 is the stronger of the two components, its absence in the Y-band spectrum confirms that NV is not present in EGS-zs8-1 at the same intensity as it is found in EGSY8p7. The redshift of EGS-zs8-1 makes detection of CIV difficult. The J-band spectrum covers 11530 Å to 13520 Å, corresponding to rest-frame wavelengths between 1320 Å and 1549 Å. This places CIV1548 at the red edge of the J-band where sensitivity is reduced and cuts out the 1550 component entirely. To predict the observed wavelength of CIV1548, we again consider CIV redshifts between that of systemic and Ly. This translates into a spectral window spanning 13493 Å to 13515 Å. No emission line is visible. For a 10 Å line width, we derive a 3 limiting flux (rest-frame EW) of 1.110-17 erg cm-2 s-1 (17 Å) for CIV1548. We can use the theoretical line ratio of CIV doublet components (CIV1548/CIV1550=2) to derive an upper limit on the total CIV doublet strength (1.710-17 erg cm-2 s-1), implying a rest-frame EW below 29 Å. The CIV non-detection places a 3 upper bound on the CIV/CIII] flux ratio in EGS-zs8-1 of less than 2.1. This is consistent with expectations for nebular lines powered by massive stars and AGN (e.g., Feltre et al. 2016; Jaskot & Ravindranath 2016; Byler et al. 2018). The lack of atmospheric absorption will enable JWST to extend these UV line measurements to deeper limits.
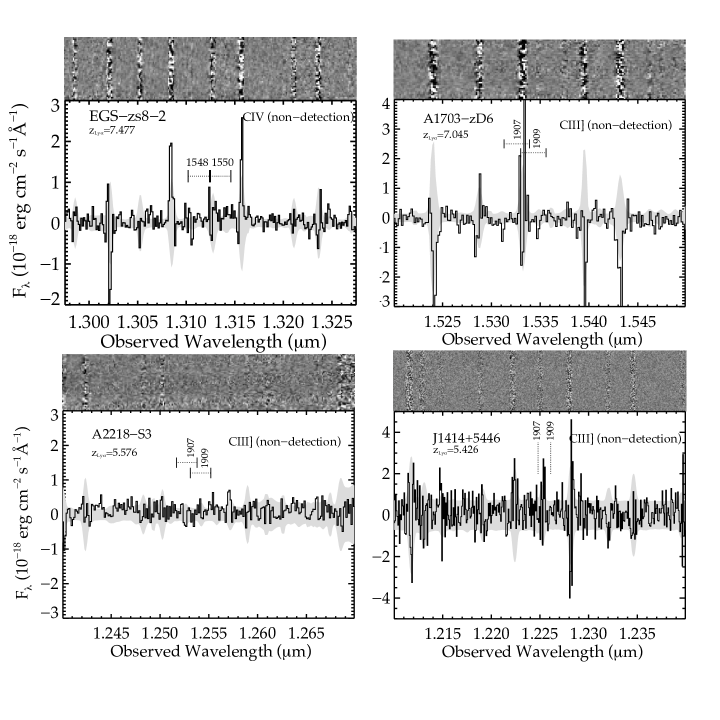
The J-band spectrum of EGS-zs8-2 (Figured 4a) probes rest-frame wavelengths between 1360 Å to 1596 Å, allowing constraints to be placed on the strength of nebular CIV. The absence of strong CIII] in EGS-zs8-2 could potentially reflect a hard ionizing spectrum that produces a large CIV/CIII] ratio. Following the same approach as above, we consider a window between 13102 Å to 13124 Å for CIV1548 and 13124 Å to 13146 Å for CIV1550. The CIV1548 window is free of strong skylines, but no convincing nebular emission is apparent. The non-detection of CIV1548 in this window allows us to place a 3 upper limit of 1.210-18 erg cm-2 s-1 and 2.4 Å for the line flux and rest-frame equivalent width, respectively. There is a skyline that covers 21% of the CIV1550 spectral window. While the red component of the doublet could be obscured by this sky feature, the blue component (stronger by a factor of two) would have been visible if CIV emission was strong. The non-detection of the doublet suggests that the total equivalent width of nebular CIV is below 4.8 Å (3) for EGS-zs8-2. We also consider the presence of NV in the Y-band Keck/MOSFIRE spectrum presented in Stark et al. (2017). No emission lines are seen in the predicted windows for NV1238 (10484 Å to 10501 Å) and NV1243 (10518 Å to 10535 Å). As both of these wavelength ranges are mostly free of strong skylines, the non-detection provides a 3 upper limit to the rest-frame equivalent width of NV1238 (2.2 Å) and NV1243 (4.5 Å). EGS-zs8-2 is thus the only of the four RB16 sources lacking a UV metal line detection, likely implying a less extreme radiation field.
3.3 Abell 1703
The top priority target on our Abell 1703 mask was A1703-zd6, a bright gravitationally lensed galaxy (H160=25.9) first identified by Bradley et al. (2012). Lyman- emission was detected at 9780 Å, indicating a redshift of =7.045 (Schenker et al., 2012). After correcting for cluster magnification (=5.2), the absolute magnitude of A1703-zd6 is relatively faint (MUV=19.3), providing a glimpse of the properties of a lower mass reionization-era system with visible Ly emission. A J-band spectrum obtained with MOSFIRE revealed strong CIV1548,1550 emission (EW=38 Å rest-frame) (Stark et al., 2015b), requiring a hard ionizing spectrum with 48 eV photons capable of triply ionizing carbon. Since CIV is a resonant line, we cannot use it to determine the systemic redshift. Using the same approach as for the EGS targets, we predict that the systemic redshift should be in a window spanning from =7.032 to 7.045.
The new H-band spectrum of A1703-zd6 (Figure 4b) probes 14560 Å to 17880 Å, corresponding to 1813 Å and 2214 Å in the rest-frame, allowing constraints to be placed on the strength of CIII] emission. By constraining the line ratio of CIV/CIII], we hope to better constrain the shape of the ionizing spectrum powering the intense nebular emission. The range of possible systemic redshifts situates [CIII]1907 at 15313 Å to 15339 Å and CIII]1909 at 15330 Å to 15356 Å. We detect no emission line in either window. While there is a skyline that covers 18% of each window, there is no configuration where both the 1907 and 1909 components are obscured. If one line is obscured, then the other component should be in a clean part of the spectrum. We calculate a 3 limiting flux (equivalent width) of 3.310-18 erg cm-2 s-1 (19.8 Å) for each component of the CIII]1907,1909 doublet, where we have again assumed a 10 Å FWHM for the line. The absence of CIII] suggests that A1703-zd6 has a CIV/CIII] line ratio of 1.2 (3), consistent with the CIV/CIII] flux ratios (1.3-6.6) seen in AGN at lower redshifts (e.g., Dors et al. 2014; Feltre et al. 2016). Metal poor galaxies with nebular CIV emission have also been observed with CIV/CIII] ratios in excess of 1.0 (e.g., Vanzella et al. 2016, 2017; Mainali et al. 2017), so the current limits do not rule out massive stars as a powering mechanism. Deep constraints on He II and NV provide the best path toward determining the origin of the CIV emission.
The MOSFIRE mask in Abell 1703 also allows us to place constraints on UV emission lines in two targets that lack spectroscopic redshifts. A1703-zd1 is one of the brightest (H=24.0) galaxies at . Using broadband photometry from HST, Bradley et al. (2012) derived a photometric redshift of . The galaxy is highly-magnified () implying an absolute UV magnitude of M. Deep z and J-band spectra have failed to reveal any emission lines in A1703-zd1, providing upper limits on the flux of Ly (Schenker et al., 2012) and CIV, He II, and OIII] (Stark et al., 2015b). By obtaining an H-band spectrum which covers 14500 Å to 17800 Å, we now constrain the strength of CIII] emission. The range of possible photometric redshifts places [CIII]1907 between 14493 Å and 15065 Å and CIII]1909 between 14508 and 15081 Å. The region is largely free of OH lines, with 59% of the wavelength range having a 5 flux limit of 5.310-18 erg cm-2 s-1. This corresponds to a rest-frame equivalent width of 6.8 Å for individual components of the [CIII], CIII] doublet after an aperture correction of 1.09 is applied to the line flux to account for the slit losses from this extended arc.
We apply a similar analysis to A1703-zd4, another bright (H160=25.4) galaxy with a photometric redshift of . The photometry allows a broader range of redshifts for this target, with acceptable solutions between and (Bradley et al., 2012). The source is magnified by implying an absolute UV magnitude of MUV=20.6. The J-band spectrum from Stark et al. (2015b) constrains Ly over and CIV over . The absence of emission lines in the J-band suggests a 5 EW limit of 6 Å for Ly and CIV lines situated between OH emission lines. The newly-acquired H-band spectrum samples wavelengths between 14810 Å and 18140 Å, and is sensitive to CIV at redshifts , He II at , OIII] at , and CIII] at . No emission is visible throughout the spectrum. For regions between sky lines (60% of the spectrum), we measure a 5 flux limit of 5.710-18 erg cm-2 s-1. This implies a rest-frame equivalent width limit of 20 Å for lines located in clean regions of the J-band spectrum.
| Object | zLyα | Line | Line Flux | Equivalent Width (W0) | Absolute Magnitude (MUV) | |
| (Å) | (10-18 erg cm-2 s-1) | (Å) | (AB) | |||
| Spectroscopic Targets | ||||||
| EGSY8p7 | 8.683 | NV | 1242.80 | 2.80.6 | 4.20.9 | -21.9 |
| … | CIV | 1548.19 | 1.6 | 4.6 | … | |
| … | … | 1550.77 | 1.6 | 4.6 | … | |
| … | He II | 1640.52 | 5.3 | 14.8 | … | |
| … | OIII] | 1660.81 | 1.5 | 4.6 | … | |
| … | … | 1666.15 | 1.5 | 4.6 | … | |
| EGS-zs8-1 | 7.730 | NV | 1238.82 | 6.0 | 7.4 | -22.1 |
| … | NV | 1242.80 | 24.3 | 29.6 | … | |
| … | CIV | 1548.19 | 11.0 | 17 | … | |
| EGS-zs8-2 | 7.477 | NV | 1238.82 | 1.7 | 2.2 | -21.9 |
| … | NV | 1242.80 | 3.6 | 4.5 | … | |
| … | CIV | 1548.19 | 1.2 | 2.4 | … | |
| … | … | 1550.77 | 1.2 | 2.4 | … | |
| A1703-zd6 | 7.045 | [CIII] | 1906.68 | 3.3 | 19.8 | -19.3 |
| … | CIII] | 1908.73 | 3.3 | 19.8 | … | |
| A383-2211 | 6.031 | Ly | 1215.67 | 16.41.4 | 21.12.8 | -20.9 |
| … | NV | 1238.82 | 3.8 | 4.9 | … | |
| … | NV | 1242.80 | 3.8 | 4.9 | … | |
| … | CIV | 1548.19 | 2.5 | 4.6 | … | |
| … | … | 1550.77 | 1.3 | 2.3 | … | |
| … | He II | 1640.52 | 5.3 | 12.2 | … | |
| … | OIII] | 1660.81 | 2.5 | 5.7 | … | |
| … | … | 1666.15 | 4.9 | 11.2 | … | |
| … | [CIII] | 1906.68 | 1.7 | 5.8 | … | |
| … | CIII] | 1908.73 | 1.2 | 4.1 | … | |
| Abell2218_S3 | 5.576 | [CIII] | 1906.68 | 3.2 | 15.6 | -16.9 |
| … | CIII] | 1908.73 | 3.2 | 15.6 | … | |
| J14144+5446 | 5.426 | [CIII] | 1906.68 | 12.0 | 7.3 | -21.1 |
| … | CIII] | 1908.73 | 8.4 | 5.2 | … | |
| Photometric Targets | ||||||
| A1703-zd4 | 8.4 | CIV, He II, OIII],CIII] | … | 5.7 | 20 | -20.6 |
| A1703-zD1 | 6.7 | CIII] | … | 5.3 | 6.8 | -20.5 |
| Abell2218-C1 | 6.7 | CIV, He II, OIII] | … | 7.1 | 5.5 | -19.4 |
3.4 Abell 2218
A2218-S3 is a multiply imaged Ly emitter at (Ellis et al., 2001). Both images (A2218-S3a and S3b) show Ly emission with an estimated rest-frame equivalent width of Å. The galaxy is fainter than the others reported in this paper (H160=26.6 and 26.7 for image a and b, respectively; Richard et al. 2007). After correcting for the magnification of a and b (=33.1 and 30.2), the absolute UV magnitude is found to be the faintest in our sample (M). The MOSFIRE J-band spectra of A2218-S3a and A2218-S3b cover 11530 to 13520 Å, corresponding roughly to 1753 Å and 2055 Å for both targets. For Ly velocity offsets between 0 and 500 km s-1, we predict that [CIII]1907 would fall at 12517 Å to 12538 Å and CIII]1909 would fall at 12531 Å to 12552 Å. Both spectral windows are free of atmospheric features, but no emission lines are apparent (Figure 4c). The non-detection implies that each component of the [CIII], CIII] doublet has a flux less than 3.210-18 erg cm-2 s-1 (3). Given the underlying continuum flux density, this indicates the total [CIII], CIII] equivalent width is below 15.6 Å, ruling out the extreme metal line emission seen in many other lensed Ly emitters (e.g., Christensen et al. 2012; Stark et al. 2014; Vanzella et al. 2016).
We also obtained MOSFIRE observations of A2218-C1, a triply-imaged galaxy at that is among the brightest known (H160=23.9, 24.1, 25.8 for images C1a, C1b, and C1c respectively) in the reionization era. Our mask contained slits on C1.b and C1.c. The lensing configuration of the multiple images rules out any lower redshift interpretation of the SED (Kneib et al., 2004), providing independent verification that the source is at very high redshift. Unlike most of the galaxies discussed in this paper, A2218-C1 does not have powerful Ly emission (Kneib et al., 2004; Egami et al., 2005), but its brightness should allow other UV lines to be detected if they are strong. After correcting for source magnification ( for images a and b), the absolute UV magnitude of C1 is MUV=. The J-band MOSFIRE spectrum we have obtained covers between 11530 and 13520 Å. Assuming the source is situated at its photometric redshift (; Egami et al. 2005) this wavelength range constrains the strength of CIV, He II, and OIII] emission. We see no emission line in the spectrum of A2218-C1.b or in the fainter image A2218-C1.c. The 5 line flux limit in regions between atmospheric OH lines (57% of the spectrum) is 7.110-18 erg cm-2 s-1. Given the continuum brightness of C1b, this corresponds to a rest-frame equivalent width of 5.5 Å after applying an aperture correction of 1.33 to the line flux. While it is conceivable that one or more of the UV lines could be obscured by a sky line, the non-detection of any lines in the J-band (and in the z-band; Kneib et al. 2004) does suggest that A2218-C1 is not likely to be an extreme UV line emitter. Thus far, we have yet to robustly detect intense UV metal lines in a source that was not also shown to have Ly emission, consistent with the idea that the Ly emitters that are currently visible at are those objects with the most extreme radiation fields. JWST spectral observations of very bright reionization-era systems that lack Ly should easily be able to confirm this picture.
3.5 SDSS J1414+5446
The galaxy SDSS J1414+5446 is one of the brightest (i) known at (McGreer et al., 2017). The source is thought to be lensed by a foreground cluster with a magnification factor in the range (McGreer et al., 2017), implying absolute UV magnitudes between M and . Extremely strong Ly emission (EW=260 Å rest-frame) indicates a redshift of =5.426, and the detection of NIV]1487 suggests a hard radiation field is likely present. Based on the absence of NV and CIV, McGreer et al. (2017) conclude that the source is not likely to be powered by an AGN.
Given the strong Ly and NIV] emission, this object is a prime candidate for having prominent CIII] emission. The new J-band LUCI spectrum covers 11680 to 13195 Å, providing coverage at the rest-frame wavelengths (1820 Å to 2038 Å) necessary to constrain the strength of CIII]. For this source, we can use the systemic redshift implied by NIV] () to calculate the wavelengths for [CIII]1907 (12248 Å) and for CIII]1909 (12261 Å). As shown in Figure 4, the spectral windows contain a strong line which might affect one of the two CIII] doublet component, but not both. No clear detection of [CIII]1907 or CIII]1909 is visible in the LUCI spectrum. We estimate a 3 limiting flux (equivalent width) of 1.210-17 erg cm-1 s-1 (7.3 Å) for [CIII]1907 and 8.410-18 erg cm-1 s-1 (5.2 Å) for CIII]1909. The absence of CIII] (12.5 Å) rules out the extreme line emission seen in many other strong Ly emitters at lower redshifts. While CIII] EW does appear to correlate with Ly EW (Shapley et al., 2003; Stark et al., 2014; Rigby et al., 2015; Le Fèvre et al., 2017; Maseda et al., 2017), clearly strong metal line emission is not completely ubiquitous among the most extreme EW Ly emitters.
3.6 Abell 383-2211
A383-2211 was first identified as a dropout by Bradley et al. (2014) in deep HST imaging of the cluster Abell 383. The galaxy is bright (H160=25.2) and magnified by =1.5. After correcting for this magnification, the UV absolute magnitude is found to be M, similar to that of an L galaxy (e.g., Bouwens et al. 2015b). The broadband SED suggests a photometric redshift of (Bradley et al., 2014), but prior to this work the object lacked a spectroscopic redshift.
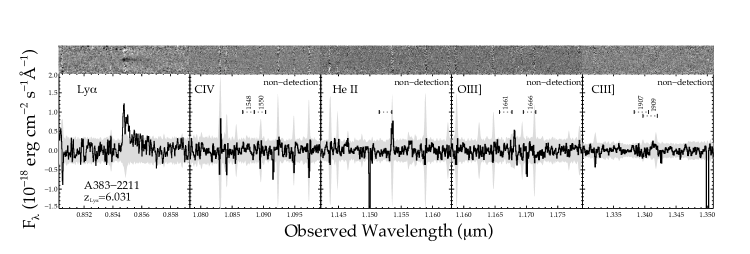
Our VLT/X-shooter observations of A383-2211 target Ly along with NV, CIV, He II, OIII] and CIII]. At , we would expect Ly in the visible arm of X-shooter. A strong emission line is seen to peak at 8547.6 Å (Figure 5). The asymmetry of the observed line profile and absence of other lines in the VIS and NIR arms indicates this feature is Ly. Adopting the wavelength of the peak flux, we derive a redshift of , nearly identical to the photometric redshift. The integrated flux of Ly is 16.41.410-18 erg cm-2 s-1 corresponding to a rest-frame Ly equivalent width of 21.12.8 Å. The redshift of A383-2211 is similar to that of another lensed Ly emitter (A383-5.2) behind Abell 383 at (Richard et al., 2011b), suggesting a likely association between the two systems. Strong CIII] emission has been previously detected in the Ly emitter (Stark et al., 2015a); if A383-2211 has similar stellar populations and gas conditions, we might expect to see similar metal line emission in the NIR arm of the X-Shooter spectrum.
We use the Ly redshift to predict the wavelengths of the fainter UV metal lines. Allowing for Ly velocity offsets in the range 0-500 km s-1, we predict spectral windows for NV1238 (8690.0 to 8710.0), NV1243 (8723.5 to 8738.1), He II (11515.3 to 11534.5 Å), OIII]1661 (11657.7 to 11677.2 Å), OIII]1666 (11695.2 to 11714.7 Å), [CIII]1907 (13383.5 to 13405.9 Å), and CIII]1909 (13397.9 to 13420.3 Å). For the resonant CIV doublet, we again allow redshifts between zsys=6.019 and 6.031, implying a wavelength range of 10867.2 to 10885.3 Å for CIV1548 and 10885.3 to 10903.5 Å for CIV1550. The windows specified are mostly free of atmospheric emission features (Figure 5), with OH lines taking up no more than 15% of any given window. As can be seen from Figure 5, no emission lines are present. The derived line flux limits are listed in Table 2. We place 3 upper limits on the rest-frame equivalent widths of NV1238,1243 (4.9 Å and 4.9 Å ), CIV1548,1550 (3.8 Å and 5.3 Å), He II1640 (4.6 Å), OIII]1661,1666 (3.5 Å and 8.6 Å), [CIII], CIII]1907,1909 (9.6 Å and 12.9 Å). The absence of strong CIII] suggests this object has a less extreme radiation field than the nearby galaxy A383-5.2, as might be expected based off of the lower Ly EW.
| Object | zspec | Line | Line Flux | WCIII],0 | MUV | References | |
|---|---|---|---|---|---|---|---|
| (Å) | (10-18 erg cm-2 s-1) | (Å) | (AB) | ||||
| EGS-zs8-1 | 7.730 | [CIII] | 1906.68 | 4.50.5 | 122 | -22.1 | [1] |
| … | CIII] | 1908.73 | 3.60.5 | 101 | … | [1] | |
| A1689-zD1 | 7.5 | [CIII] | 1909 | 2 | 4 | -20.1 | [2] |
| EGS-zs8-2 | 7.477 | [CIII] | 1906.68 | 2.3 | 7.1 | -21.9 | [1] |
| … | CIII] | 1908.73 | 2.3 | 7.1 | … | [1] | |
| COSY | 7.149 | [CIII] | 1906.68 | 0.92 | 3.6 | -21.8 | [3] |
| … | CIII] | 1908.73 | 0.83 | 3.2 | … | [3] | |
| COSz1 | 6.854 | [CIII] | 1906.68 | 1.18 | 3.7 | -21.6 | [3] |
| … | CIII] | 1908.73 | 1.330.3 | 4.10.9 | … | [3] | |
| COSz2 | 6.816 | [CIII] | 1906.68 | 1.57 | 5.5 | -22.1 | [3] |
| … | CIII] | 1908.73 | 1.57 | 5.5 | … | [3] | |
| RXCJ2248.7-4431 | 6.110 | [CIII] | 1909 | 3.6 | 7.9 | -20.1 | [4],[5] |
| A383-5.2 | 6.027 | [CIII]a | 1906.68 | 5.21.6 | 13.13.9 | -19.3 | [6] |
| … | CIII] | 1908.73 | 3.71.1 | 9.42.8 | … | [6] | |
| A1703-23 | 5.828 | [CIII] | 1906.68 | 1.5 | 1.1 | -21.7 | [7] |
| … | CIII] | 1908.73 | 3.4 | 2.6 | … | [7] | |
| Ding-3 | 5.75 | [CIII] | 1909 | 3.3 | 15.1 | -20.9 | [8] |
| Ding-1 | 5.70 | [CIII] | 1909 | 5.4 | 6.6 | -22.2 | [8] |
| Ding-2 | 5.69 | [CIII] | 1909 | 3.4 | 4.5 | -22.2 | [8] |
aLine flux for [CIII]1907 is calculated assuming [CIII]1907/CIII]1909=1.4.
4 Discussion and Conclusions
4.1 The Origin of NV Emission in EGSY8p7
In section §3.1, we presented the detection of NV1243 in the spectrum of EGSY8p7, a color-selected Ly emitting galaxy at (RB16, Zitrin et al. 2015). The NV line can have its origin in either HII regions or stellar winds. The stellar wind feature is commonly seen in high redshift galaxy spectra (e.g., Shapley et al. 2003; Jones et al. 2012; Steidel et al. 2016; Rigby et al. 2018). Population synthesis models including single stellar populations (e.g., Leitherer et al. 1999) and binary stars (Eldridge & Stanway, 2016) both predict that the NV stellar wind feature can be prominent, particularly at very young ages. But the equivalent width of the NV1243 component in these models does not reach higher than 2.5 Å, less than the value we measure in the spectrum of EGSY8p7. The emission component of the stellar wind profile is typically observed to be very broad (1000 km s-1) reflecting the terminal velocity of the winds. While it is conceivable that broader wings are too faint to be detected in the J-band spectrum, this would imply a total equivalent width that is even larger than what we report, putting the observations further at odds with the stellar wind model predictions. We thus conclude that the line observed in EGSY8p7 is most likely to be nebular in origin. Nevertheless the NV detections that are now emerging at motivate both theoretical and observational investigation of the range of NV equivalent widths and line widths that can produced by the winds of massive stars.
Powering nebular NV emission requires an EUV spectrum with substantial flux above 77 eV. Because the spectra of hot stars have a strong break above 54 eV, the presence of NV in EGSY8p7 likely points to either AGN activity or fast radiative shocks. The flux ratio of UV lines can help to distinguish between the two (e.g., Groves et al. 2004; Allen et al. 2008; Feltre et al. 2016). The non-detections of CIV and He II in EGSY8p7 allow us to place upper limits on the NV/CIV flux ratio (2.6[1.6] at 3[5]) and NV/He II flux ratio (3.8[2.2] at 3[5]), provided that both lines are not obscured by skylines. While this is not a concern for CIV (see Figure 2), there is a strong skyline that covers 19% of the predicted He II spectral window. If the NV1243 feature has the same redshift as He II, the latter would indeed be located very close to this skyline. We thus consider the NV/He II limit to be less robust than NV/CIV. The constraints on the line ratios in EGSY8p7 are broadly consistent with those in COSY, another Ly emitter from the RB16 sample with NV emission (Laporte et al., 2017) and several luminous Ly emitters at (Sobral et al., 2018). Both sources have NV/CIV flux ratios slightly greater than unity, in marginal tension with many AGN and shock models with standard abundance ratios (e.g., Groves et al. 2004; Allen et al. 2008; Feltre et al. 2016; Laporte et al. 2017). Nevertheless there are examples of AGNs with NV/CIV in high redshift samples from the Sloan Digital Sky Survey (Alexandroff et al., 2013). As noted in Laporte et al. (2017), additional physics or resonant scattering of CIV photons might ultimately be required to explain the NV/CIV flux ratios that are emerging at . While distinguishing between shocks and AGN is clearly difficult with only an NV detection, the launch of JWST will provide a wealth of UV and optical spectral constraints on EGSY8p7, clarifying the origin of the intense line emission.
With the NV detection in the Zitrin et al. (2015) galaxy, three of the thirteen Ly emitting galaxies known at have been shown to have NV emission (e.g.,Tilvi et al. 2016; Laporte et al. 2017), and two other have recently been detected in Ly emitters at (Hu et al., 2017) and (Sobral et al., 2017a). The systems with NV emission are among the most luminous (1.3-2.5 greater than L) and massive galaxies known at . It is perhaps not surprising that signs of supermassive black hole growth would be detected in such massive early systems. At lower redshifts AGNs are present in Ly emitter samples, but the AGN fractions are generally less than 5-10% (e.g., Ouchi et al. 2008; Zheng et al. 2010; Sobral et al. 2017b; Shibuya et al. 2017). But recent work indicates that this fraction increases in the more luminous Ly emitters (Sobral et al., 2018). While further work is certainly needed to isolate the powering mechanism of the NV detections, these early studies appear to indicate that the known Ly emitters at contain a large fraction of sources with hard ionizing spectra, as might be expected if the extreme radiation field enhances the visibility of Ly through the partially neutral IGM.
4.2 The Frequency of CIII] and CIV Emission at
The UV metal line emission observed in galaxies (Stark et al., 2015a, b, 2017; Mainali et al., 2017; Schmidt et al., 2017; Tilvi et al., 2016; Laporte et al., 2017; Matthee et al., 2017) is a marked departure from the weak line emission typically found at lower redshift (e.g., Shapley et al. 2003; Rigby et al. 2015; Du et al. 2017; Du et al. 2018), motivating theoretical investigations into the factors regulating UV line spectra (Jaskot & Ravindranath, 2016; Gutkin et al., 2016; Nakajima et al., 2017; Volonteri et al., 2017; Byler et al., 2018) and observational efforts to identify intense UV line emitters locally and at (Stark et al., 2014; Rigby et al., 2015; Du et al., 2017; Senchyna et al., 2017; Maseda et al., 2017; Le Fèvre et al., 2017; Amorín et al., 2017). With a larger sample of galaxies with UV metal line constraints (see Table 2), we can now begin to investigate to what extent the extreme UV line emitters are representative among reionization-era sources.
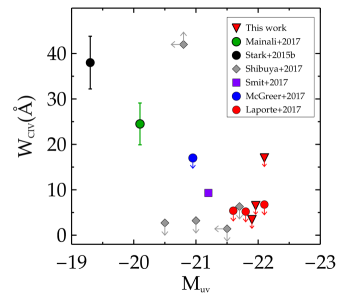
While CIV emission has been absent in the sources with likely NV detections, the nebular line has been detected in two star forming galaxies at (Stark et al., 2015b; Mainali et al., 2017; Schmidt et al., 2017). In contrast to the galaxies with NV emission, the CIV emitters are among the lowest luminosity galaxies with detectable Ly emission in the reionization era. Both are gravitationally lensed with absolute UV magnitudes (MUV=, ) that are 2.8-5.8 lower than the median luminosity of the three sources with reported NV emission. The presence of CIV requires a significant supply of 48 eV photons capable of triply-ionizing carbon. Local UV spectral databases (e.g., Berg et al. 2016; Senchyna et al. 2017) show that nebular CIV emission becomes commonplace in actively star forming galaxies with gas-phase metallicities below 12+log O/H , a consequence of the rapid transition in the hardness of the EUV spectrum of massive stars below this metallicity threshold (Senchyna et al., 2017). The sharp increase in hard photons can be explained in part by less dense stellar winds (which allow more of the EUV flux to escape the stellar atmospheres) and more efficient evolutionary pathways toward the creation of hot stripped stars at low metallicity (e.g., Senchyna et al. 2017). The detection of strong nebular CIV emission may thus be able to provide a valuable signpost of low metallicity stellar populations. In Figure 6, we show the relationship between MUV and CIV equivalent width for galaxies at , updating a plot originally presented in Shibuya et al. (2017) with the new upper limits presented in this paper. The presence of CIV is limited to the lowest luminosity systems, as might be expected if a luminosity-metallicity relationship is present at these early times. In this context, the absence of strong CIV emission in the luminous RB16 sources may indicate that metallicity of massive stars in these systems has already been polluted above the threshold necessary for powering a hard EUV spectrum. JWST will soon begin to provide constraints on the rest-optical lines in these and other reionization-era galaxies, making it possible to investigate the relationship between high ionization UV lines and metallicity in more detail.
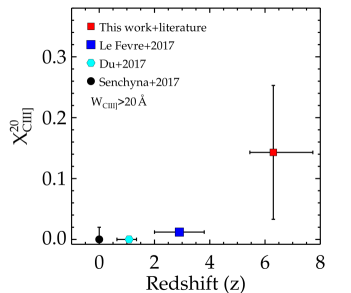
Much of the attention on metal lines has focused on the [CIII], CIII] doublet, as it is often the strongest line in the UV other than Ly. Intense [CIII], CIII] emission (EW=22Å) has been detected in EGS-zs8-1, the Ly emitter from the RB16 sample (Oesch et al., 2015; Stark et al., 2017). Similarly strong CIII] (EW=22.5 Å) is present in A383-5.2 (Stark et al., 2015a), a gravitationally lensed galaxy with Ly (Richard et al., 2011b). In this paper, we present upper limits on the strength of CIII] in five sources at . When taken together with robust limits from the literature (see Table 3), we find that the fraction of galaxies at with CIII] EW Å is . While such strong CIII] emission is clearly not ubiquitous among reionization-era galaxies, it is even less common among systems at lower redshifts. In a study of 2543 galaxies at , Le Fèvre et al. (2017) find only 31 sources with CIII] EW in excess of 20 Å, implying a fraction of just 1.2%. Similarly low fractions are found in other studies of galaxies at (Rigby et al., 2015; Du et al., 2017; Senchyna et al., 2017). These preliminary indications of evolution in the fraction of extreme EW CIII] emitters (Figure 7) could be interpreted as a byproduct of the changing demographics of star forming galaxies; as larger sSFR and more intense optical line emission become more common at early times, strong CIII] emission should similarly become more typical (e.g., Senchyna et al. 2017; Maseda et al. 2017). Others have put forth an alternative explanation, arguing that sources with CIII] EW Å likely have AGN activity (Nakajima et al., 2017); in this picture the increased incidence of extreme CIII] emitters may reflect the changing nature of Ly emitters at . One other important factor that could possibly govern the strength of carbon lines is the relative C/O abundance (Stark et al., 2014; Berg et al., 2016; Nakajima et al., 2017; Le Fèvre et al., 2017; Berg et al., 2018). These papers show that C/O decreases at lower O/H over 0.1Z/Z⊙1.0. If C/O is very low at , it could cause the lines to be weaker than expected. However, measurements of C/O at are not yet possible with current facilities. Future observations that simultaneously detect CIII], CIV and OIII] at will shed light on the role of C/O abundance in shaping the strength of carbon lines in these early galaxies.
While our knowledge of the UV line statistics is undoubtedly still in its infancy, the presence of intense line emission is beginning to refine our understanding of the nature of the Ly emitter population in the reionization era. Prominent emission lines (NV, CIV, or CIII]) have now been reported in five of the thirteen Ly emitters known at . Galaxies with similar Ly EW at lower redshifts (e.g., Shapley et al. 2003; Jones et al. 2012; Du et al. 2017; Le Fèvre et al. 2017) very rarely exhibit such extreme UV line emission. These results continue to suggest that the radiation field is playing an important role in making these systems visible in Ly emission in an epoch where most Ly photons are strongly attenuated by the IGM. Attempts to map the evolving Ly EW distribution to a neutral hydrogen fraction must ultimately take into account these variations in the radiation field. The launch of JWST will soon provide an opportunity to extend rest-UV studies to larger samples, increasing our understanding of the factors regulating the escape of Ly in the reionization era. While many of the spectroscopic studies will focus on the strong rest-optical lines, the UV should not be neglected as the presence of various high ionization features (NV, He II, CIV) provides the most direct path toward detecting extreme sources, whether they be AGN or very low metallicity stellar populations.
Acknowledgements
We thank referee for the useful suggestions and comments. We are very grateful to Anna Feltre for enlightening conversations. DPS acknowledges support from the National Science Foundation through the grant AST-1410155. RSE and NL acknowledge support from the European Research Council through an Advanced Grant FP7/669253. JR acknowledges support from the European Research Council through a Starting grant FP7/336736. This work was partially supported by a NASA Keck PI Data Award, administered by the NASA Exoplanet Science Institute. Data presented herein were obtained at the W. M. Keck Observatory from telescope time allocated to the National Aeronautics and Space Administration through the agency’s scientific partnership with the California Institute of Technology and the University of California. The Observatory was made possible by the generous financial support of the W. M. Keck Foundation. The authors acknowledge the very significant cultural role that the summit of Mauna Kea has always had within the indigenous Hawaiian community. We are most fortunate to have the opportunity to conduct observations from this mountain. Also based on observations made with ESO Telescopes at the La Silla Paranal Observatory under programme ID 092.A-0630(A). The LBT is an international collaboration among institutions in the United States, Italy and Germany. LBT Corporation partners are: The University of Arizona on behalf of the Arizona university system; Istituto Nazionale di Astrofisica, Italy; LBT Beteiligungsgesellschaft, Germany, representing the Max-Planck Society, the Astrophysical Institute Potsdam, and Heidelberg University; The Ohio State University, and The Research Corporation, on behalf of The University of Notre Dame, University of Minnesota and University of Virginia.
References
- Alexandroff et al. (2013) Alexandroff R., et al., 2013, MNRAS, 435, 3306
- Allen et al. (2008) Allen M. G., Groves B. A., Dopita M. A., Sutherland R. S., Kewley L. J., 2008, ApJS, 178, 20
- Amorín et al. (2017) Amorín R., et al., 2017, Nature Astronomy, 1, 0052
- Atek et al. (2015) Atek H., et al., 2015, ApJ, 814, 69
- Bañados et al. (2018) Bañados E., et al., 2018, Nature, 553, 473
- Bayliss et al. (2014) Bayliss M. B., Rigby J. R., Sharon K., Wuyts E., Florian M., Gladders M. D., Johnson T., Oguri M., 2014, ApJ, 790, 144
- Berg et al. (2016) Berg D. A., Skillman E. D., Henry R. B. C., Erb D. K., Carigi L., 2016, ApJ, 827, 126
- Berg et al. (2018) Berg D. A., Erb D. K., Auger M. W., Pettini M., Brammer G. B., 2018, preprint, (arXiv:1803.02340)
- Bian et al. (2010) Bian F., et al., 2010, ApJ, 725, 1877
- Bian et al. (2015) Bian F., et al., 2015, ApJ, 806, 108
- Bickel (1969) Bickel W., 1969, J. Quant. Spectrosc. Radiative Transfer, 9, 1145
- Bosman & Becker (2015) Bosman S. E. I., Becker G. D., 2015, MNRAS, 452, 1105
- Bouwens et al. (2015a) Bouwens R. J., Illingworth G. D., Oesch P. A., Caruana J., Holwerda B., Smit R., Wilkins S., 2015a, preprint, (arXiv:1503.08228)
- Bouwens et al. (2015b) Bouwens R. J., et al., 2015b, ApJ, 803, 34
- Bradley et al. (2012) Bradley L. D., et al., 2012, ApJ, 747, 3
- Bradley et al. (2014) Bradley L. D., et al., 2014, ApJ, 792, 76
- Byler et al. (2018) Byler N., Dalcanton J., Conroy C., Johnson B., Levesque E., Berg D., 2018, preprint, (arXiv:1803.04425)
- Caruana et al. (2014) Caruana J., Bunker A. J., Wilkins S. M., Stanway E. R., Lorenzoni S., Jarvis M. J., Ebert H., 2014, MNRAS, 443, 2831
- Christensen et al. (2012) Christensen L., et al., 2012, MNRAS, 427, 1953
- Dijkstra et al. (2014) Dijkstra M., Wyithe S., Haiman Z., Mesinger A., Pentericci L., 2014, MNRAS, 440, 3309
- Ding et al. (2017) Ding J., et al., 2017, ApJ, 838, L22
- Dors et al. (2014) Dors O. L., Cardaci M. V., Hägele G. F., Krabbe Â. C., 2014, MNRAS, 443, 1291
- Du et al. (2017) Du X., Shapley A. E., Martin C. L., Coil A. L., 2017, ApJ, 838, 63
- Du et al. (2018) Du X., et al., 2018, preprint, (arXiv:1803.05912)
- Ebbels et al. (1996) Ebbels T. M. D., Le Borgne J.-F., Pello R., Ellis R. S., Kneib J.-P., Smail I., Sanahuja B., 1996, MNRAS, 281, L75
- Egami et al. (2005) Egami E., et al., 2005, ApJ, 618, L5
- Eldridge & Stanway (2016) Eldridge J. J., Stanway E. R., 2016, MNRAS, 462, 3302
- Elíasdóttir et al. (2007) Elíasdóttir Á., et al., 2007, preprint, (arXiv:0710.5636)
- Ellis et al. (2001) Ellis R., Santos M. R., Kneib J.-P., Kuijken K., 2001, ApJ, 560, L119
- Erb et al. (2014) Erb D. K., et al., 2014, ApJ, 795, 33
- Feltre et al. (2016) Feltre A., Charlot S., Gutkin J., 2016, MNRAS, 456, 3354
- Finkelstein et al. (2015) Finkelstein S. L., et al., 2015, ApJ, 810, 71
- Fontana et al. (2010) Fontana A., et al., 2010, ApJ, 725, L205
- Furusawa et al. (2016) Furusawa H., et al., 2016, ApJ, 822, 46
- Greig et al. (2017) Greig B., Mesinger A., Haiman Z., Simcoe R. A., 2017, MNRAS, 466, 4239
- Groves et al. (2004) Groves B. A., Dopita M. A., Sutherland R. S., 2004, ApJS, 153, 9
- Gutkin et al. (2016) Gutkin J., Charlot S., Bruzual G., 2016, MNRAS, 462, 1757
- Hu et al. (2010) Hu E. M., Cowie L. L., Barger A. J., Capak P., Kakazu Y., Trouille L., 2010, ApJ, 725, 394
- Hu et al. (2017) Hu W., et al., 2017, ApJ, 845, L16
- Ishigaki et al. (2018) Ishigaki M., Kawamata R., Ouchi M., Oguri M., Shimasaku K., Ono Y., 2018, ApJ, 854, 73
- James et al. (2014) James B. L., et al., 2014, MNRAS, 440, 1794
- Jaskot & Ravindranath (2016) Jaskot A. E., Ravindranath S., 2016, ApJ, 833, 136
- Jones et al. (2012) Jones T., Stark D. P., Ellis R. S., 2012, ApJ, 751, 51
- Kashikawa et al. (2006) Kashikawa N., et al., 2006, ApJ, 648, 7
- Kneib et al. (1996) Kneib J.-P., Ellis R. S., Smail I., Couch W. J., Sharples R. M., 1996, ApJ, 471, 643
- Kneib et al. (2004) Kneib J.-P., Ellis R. S., Santos M. R., Richard J., 2004, ApJ, 607, 697
- Konno et al. (2018) Konno A., et al., 2018, PASJ, 70, S16
- Laporte et al. (2017) Laporte N., Nakajima K., Ellis R. S., Zitrin A., Stark D. P., Mainali R., Roberts-Borsani G. W., 2017, ApJ, 851, 40
- Le Fèvre et al. (2017) Le Fèvre O., et al., 2017, preprint, (arXiv:1710.10715)
- Leitherer et al. (1999) Leitherer C., et al., 1999, ApJS, 123, 3
- Livermore et al. (2017) Livermore R. C., Finkelstein S. L., Lotz J. M., 2017, ApJ, 835, 113
- Mainali et al. (2017) Mainali R., Kollmeier J. A., Stark D. P., Simcoe R. A., Walth G., Newman A. B., Miller D. R., 2017, ApJ, 836, L14
- Malhotra & Rhoads (2004) Malhotra S., Rhoads J. E., 2004, ApJ, 617, L5
- Maseda et al. (2017) Maseda M. V., et al., 2017, preprint, (arXiv:1710.06432)
- Mason et al. (2017) Mason C. A., Treu T., Dijkstra M., Mesinger A., Trenti M., Pentericci L., de Barros S., Vanzella E., 2017, preprint, (arXiv:1709.05356)
- Mason et al. (2018) Mason C. A., et al., 2018, preprint, (arXiv:1801.01891)
- Matthee et al. (2017) Matthee J., Sobral D., Darvish B., Santos S., Mobasher B., Paulino-Afonso A., Röttgering H., Alegre L., 2017, MNRAS, 472, 772
- McGreer et al. (2015) McGreer I. D., Mesinger A., D’Odorico V., 2015, MNRAS, 447, 499
- McGreer et al. (2017) McGreer I. D., et al., 2017, preprint, (arXiv:1706.09428)
- McLean et al. (2012) McLean I. S., et al., 2012, in Society of Photo-Optical Instrumentation Engineers (SPIE) Conference Series. , doi:10.1117/12.924794
- McLure et al. (2013) McLure R. J., et al., 2013, MNRAS, 432, 2696
- Mesinger et al. (2015) Mesinger A., Aykutalp A., Vanzella E., Pentericci L., Ferrara A., Dijkstra M., 2015, MNRAS, 446, 566
- Mortlock et al. (2011) Mortlock D. J., et al., 2011, Nature, 474, 616
- Nakajima et al. (2017) Nakajima K., et al., 2017, preprint, (arXiv:1709.03990)
- Oesch et al. (2015) Oesch P. A., et al., 2015, ApJ, 804, L30
- Oke & Gunn (1983) Oke J. B., Gunn J. E., 1983, ApJ, 266, 713
- Ono et al. (2012) Ono Y., et al., 2012, ApJ, 744, 83
- Ota et al. (2017) Ota K., et al., 2017, ApJ, 844, 85
- Ouchi et al. (2008) Ouchi M., et al., 2008, ApJS, 176, 301
- Ouchi et al. (2010) Ouchi M., et al., 2010, ApJ, 723, 869
- Pentericci et al. (2014) Pentericci L., et al., 2014, preprint, (arXiv:1403.5466)
- Pentericci et al. (2016) Pentericci L., et al., 2016, ApJ, 829, L11
- Planck Collaboration et al. (2016) Planck Collaboration et al., 2016, A&A, 594, A1
- Richard et al. (2007) Richard J., et al., 2007, ApJ, 662, 781
- Richard et al. (2011a) Richard J., Jones T., Ellis R., Stark D. P., Livermore R., Swinbank M., 2011a, MNRAS, 413, 643
- Richard et al. (2011b) Richard J., Kneib J.-P., Ebeling H., Stark D. P., Egami E., Fiedler A. K., 2011b, MNRAS, 414, L31
- Rigby et al. (2015) Rigby J. R., Bayliss M. B., Gladders M. D., Sharon K., Wuyts E., Dahle H., Johnson T., Peña-Guerrero M., 2015, ApJ, 814, L6
- Rigby et al. (2018) Rigby J. R., et al., 2018, ApJ, 853, 87
- Roberts-Borsani et al. (2016) Roberts-Borsani G. W., et al., 2016, ApJ, 823, 143
- Robertson et al. (2015) Robertson B. E., Ellis R. S., Furlanetto S. R., Dunlop J. S., 2015, ApJ, 802, L19
- Schenker et al. (2012) Schenker M. A., Stark D. P., Ellis R. S., Robertson B. E., Dunlop J. S., McLure R. J., Kneib J.-P., Richard J., 2012, ApJ, 744, 179
- Schenker et al. (2014) Schenker M. A., Ellis R. S., Konidaris N. P., Stark D. P., 2014, ApJ, 795, 20
- Schmidt et al. (2016) Schmidt K. B., et al., 2016, ApJ, 818, 38
- Schmidt et al. (2017) Schmidt K. B., et al., 2017, ApJ, 839, 17
- Senchyna et al. (2017) Senchyna P., et al., 2017, MNRAS, 472, 2608
- Shapley et al. (2003) Shapley A. E., Steidel C. C., Pettini M., Adelberger K. L., 2003, ApJ, 588, 65
- Shibuya et al. (2017) Shibuya T., et al., 2017, preprint, (arXiv:1705.00733)
- Smit et al. (2017) Smit R., Swinbank A. M., Massey R., Richard J., Smail I., Kneib J.-P., 2017, MNRAS, 467, 3306
- Sobral et al. (2017a) Sobral D., et al., 2017a, preprint, (arXiv:1710.08422)
- Sobral et al. (2017b) Sobral D., Santos S., Matthee J., Paulino-Afonso A., Ribeiro B., Calhau J., Khostovan A. A., 2017b, preprint, (arXiv:1712.04451)
- Sobral et al. (2018) Sobral D., et al., 2018, preprint, (arXiv:1802.10102)
- Stanway et al. (2016) Stanway E. R., Eldridge J. J., Becker G. D., 2016, MNRAS, 456, 485
- Stark (2016) Stark D. P., 2016, ARA&A, 54, 761
- Stark et al. (2010) Stark D. P., Ellis R. S., Chiu K., Ouchi M., Bunker A., 2010, MNRAS, 408, 1628
- Stark et al. (2014) Stark D. P., et al., 2014, MNRAS, 445, 3200
- Stark et al. (2015a) Stark D. P., et al., 2015a, MNRAS, 450, 1846
- Stark et al. (2015b) Stark D. P., et al., 2015b, MNRAS, 454, 1393
- Stark et al. (2017) Stark D. P., et al., 2017, MNRAS, 464, 469
- Steidel et al. (2016) Steidel C. C., Strom A. L., Pettini M., Rudie G. C., Reddy N. A., Trainor R. F., 2016, ApJ, 826, 159
- Tilvi et al. (2014) Tilvi V., et al., 2014, ApJ, 794, 5
- Tilvi et al. (2016) Tilvi V., et al., 2016, ApJ, 827, L14
- Torres-Peimbert & Pena (1984) Torres-Peimbert S., Pena M., 1984, Rev. Mex. Astron. Astrofis., 9, 107
- Vanzella et al. (2016) Vanzella E., et al., 2016, ApJ, 821, L27
- Vanzella et al. (2017) Vanzella E., et al., 2017, preprint, (arXiv:1703.02044)
- Vernet et al. (2011) Vernet J., et al., 2011, A&A, 536, A105
- Volonteri et al. (2017) Volonteri M., Reines A. E., Atek H., Stark D. P., Trebitsch M., 2017, ApJ, 849, 155
- Watson et al. (2015) Watson D., Christensen L., Knudsen K. K., Richard J., Gallazzi A., Michałowski M. J., 2015, Nature, 519, 327
- Zheng et al. (2010) Zheng Z. Y., Wang J. X., Finkelstein S. L., Malhotra S., Rhoads J. E., Finkelstein K. D., 2010, ApJ, 718, 52
- Zitrin et al. (2015) Zitrin A., et al., 2015, ApJ, 810, L12