A model of the Mira–type star T UMi
Yu. A. Fadeyev***E–mail: fadeyev@inasan.ru
Institute of Astronomy, Russian Academy of Sciences, Pyatnitskaya ul. 48, Moscow, 119017 Russia
Received February 6, 2018
Abstract — Stellar evolution calculations were carried out from the main sequence to the final stage of the asymptotic giant branch for stars with initial masses and metallicity . Selected models of evolutionary sequences were used as initial conditions for solution of the equations of radiation hydrodynamics and time–dependent convection describing radial stellar pulsations. The study was aimed to construct the hydrodynamic models of Mira–type stars that show the secular decrease in the pulsation period commenced in 1970–th at day. We show that such a condition for the period change is satisfied with evolutionary sequences and the best agreement with observations is obtained for . The pulsation period reduction is due to both the stellar radius decrease during the thermal pulse of the helium burning shell and mode switch from the fundamental mode to the first overtone. Theoretical estimates of the fundament parameters of the star at the onset of pulsation period reduction are as follows: the mass is , the luminosity is , and the radius is . The mode switch occurs 35 years after the onset of period reduction.
Keywords: stars: variable and peculiar
1 introduction
The long–period Cet type pulsating variable stars (Miras) are at a late–stage of their evolution and on the Hertzsprung–Russel diagram (HRD) they populate the asymptotic giant branch (AGB). The energy source of Miras are the reactions of thermonuclear burning of hydrogen and helium in the shells surronding the degenerate carbon–oxygen core. The energy generation in the helium burning shell is thermally unstable and cyclically increases up to values several orders of magnitude higher than the stellar luminosity (Schwarzschild and Härm 1965; Weigert 1966). The mean time interval between helium flashes depends on the stellar mass and ranges from to yr (Herwig 2000; Weiss, Ferguson 2009), whereas the time scale of the changes in the helium burning shell luminosity is yr (Wood, Zarro, 1981; Boothroyd, Sackmann 1988). One of the consequences of thermal instability is secular period change observed in some Miras because during the short–term variation of the helium burning shell luminosity the stellar radius varies by as much as a factor of three (Wood, Zarro, 1981; Fadeyev 2016, 2017).
In understanding the nature of Miras there are still uncertainties so that results of evolutionary computations should be corroborated by tests based on observations of selected variable stars of this type. One of such tests is based on the stellar pulsation theory and allows us to determine the fundamental parameters of the star (the mass and the radius ) using the observational estimates of the pulsation period and the rate of period change . Efficiency of such an approach was demonstarted in analysis of cepheid pulsations for UMi (Fadeyev 2015a) and SZ Tau (Fadeyev 2015b). Unfortunately, observational estimates of and are insufficient in the case of Miras because on the HRD the region of AGB is populated by stars with various initial masses () and the pulsation period of each AGB star changes in the wide range due to both thermal pulses and monotonious decrease of the stellar mass because of the strong stellar wind.
The mira–type star T UMi is a rare exception which allows us to obtain an another relationship between observational properties of the star and its evolutionary status. This red giant of spectral type M5.5e (Keenan 1966) was pulsating with period day before 1970s but later the period commenced its rapid shortening (Gál, Szatmáry 1995) and in 2008 was nearly 114 day (Uttenthaler et al. 2011). Period decrease observed in T UMi is thought to be due to the thermal pulse of the helium shell source (Mattei, G. Foster 1995; Whitelock 1999; Szatmáry et al. 2003).
In our previous work (Fadeyev 2017), we investigated hydrodynamic models of stars with initial masses on the stage of thermal instability of the helium burning shell (TP–AGB). In particular, it was shown that reduction of the pulsation period in T UMi cannot be explained by models with initial mass . The aim of this study is to construct a model of the Mira–type star T UMi using the detailed grid of evolutionary sequences with intial masses ranging within . Similar to our previous works the selected models of evolutionary sequences are used as initial conditions in solution of the Cauchy problem for equations of radiation hydrodynamics and time–dependent convection describing radial stellar oscillations. Methods of the solution are discussed in our earlier papers (Fadeyev 2016; 2017).
2 Evolutionary sequences of TP–AGB stars
Stellar evolution calculations were carried out from the zero–age main sequence (ZAMS) to the final TP–AGB stage when the star leaves the region of red giants on the HRD. Initial relative mass abundances of hydrogen and the elements heavier than helium were assumed to be and . The ratio of the mixing length to the pressure scale height is . Evolutionary computations were done with the MESA code version 9575 (Paxton et al., 2011; 2013; 2015). Details of program usage for AGB stellar evolution computation and the choise of basic parameters are discussed in our previous papers (Fadeyev 2016; 2017). Effects of convective overshooting were taken into account according to Herwig (2000) for the parameter . The smaller value of in comparison with our earlier calculations is due to both the smaller initial masses and the existence of dependence between the overshooting parameter and the stellar mass (Claret, Torres 2017).
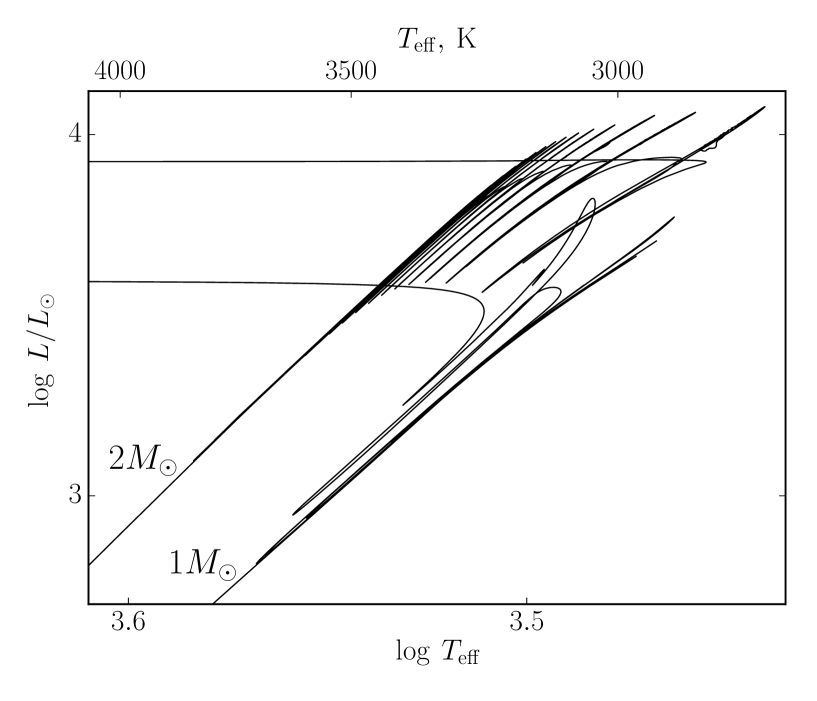
Fig. 1 shows the evolutionary tracks of stars and during the AGB stage. Initially evolution on the HRD is accompanied by monotoneous increase of the luminosity. This part of the evolutionary track represents the early asymptotic giant branch (E–AGB) stage when the principal source of the stellar luminosity is the hydrogen burning shell. Transition to the stage of thermal instability (TP–AGB) is due to the growth of the triple –process reaction rates in the helium burning shell. Helium burning energy release occurs in the form of recurrent pulses. The number of pulses depends on the stellar mass and increases from 4 for to 19 for . Energy release of the helium burning shell ceases and the star leaves the TP–AGB stage when the total mass of the star reduces to for and for . Nearly horizontal parts of the tracks in Fig. 1 correspond to the post–AGB stage when the stellar effective temperature rapidly increases at nearly constant luminosity.
It should be noted that both the number of thermal pulses and the TP–AGB lifetime depend on the mass loss rate relation. In the present study we assumed that the mass loss rate is given by relation of Blöcker (1995):
| (1) |
where
| (2) |
– is the Reimers (1975) formula, and the parameters are and .
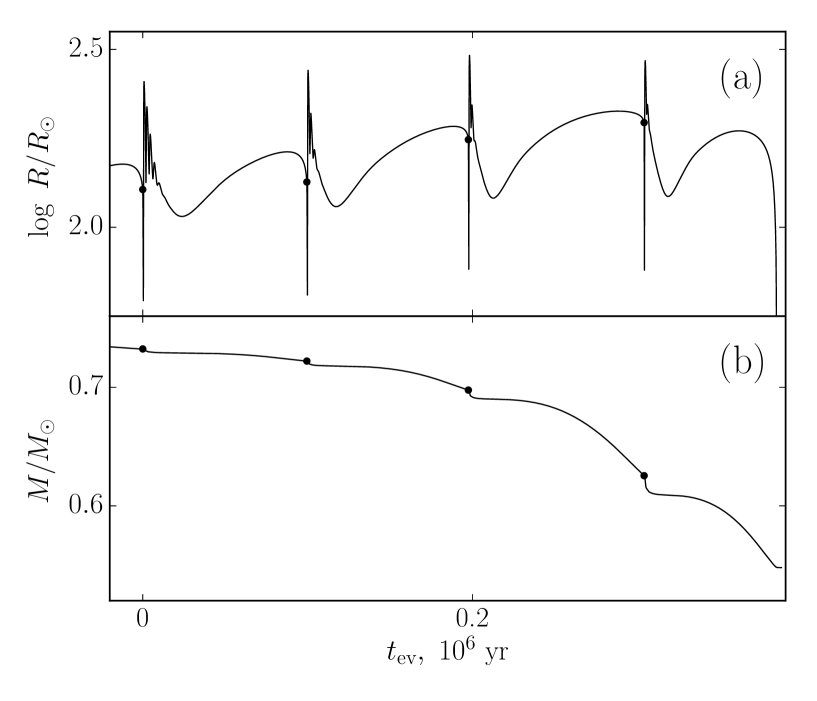
Fig. 2 shows the temporal dependences of the stellar radius and the luminosity of the helium burning shell in the vicinity of the fourth thermal pulse peak. For the sake of convenience the evolutionary time is set to zero at maximum of . As clearly seen in Fig. 2, the onset of the stellar radius decrease coincides with maximum of within several dozen years. To a first approximation the radius of the star is related to the period of radial pulsations by , therefore without significant loss of accuracy we can assume that the onset of period decrease coincides with the maximum of .
Evolutionary changes of the stellar radius and mass during the TP–AGB stage are shown in Fig. 3 for the evolutionary sequence . The ratio of the carbon to oxygen mass fractions at the stellar surface almost does not change during the whole TP–AGB stage and is . Fig. 4 shows the plots of the stellar radius and the stellar mass as a function of evolutinary time for the evolutionary sequence . The bottom panel of Fig. 4 shows also the plot of . Filled circles in Figs. 3 and 4 indicate the evolutionary models with peak values of that were selected as initial conditions in solution of the equations of hydrodynamics describing stellar pulsations. It should be noted that selection of evolutionary models for is resticted by condition because T UMi belongs to oxygen–rich Miras.
3 nonlinear stellar pulsations
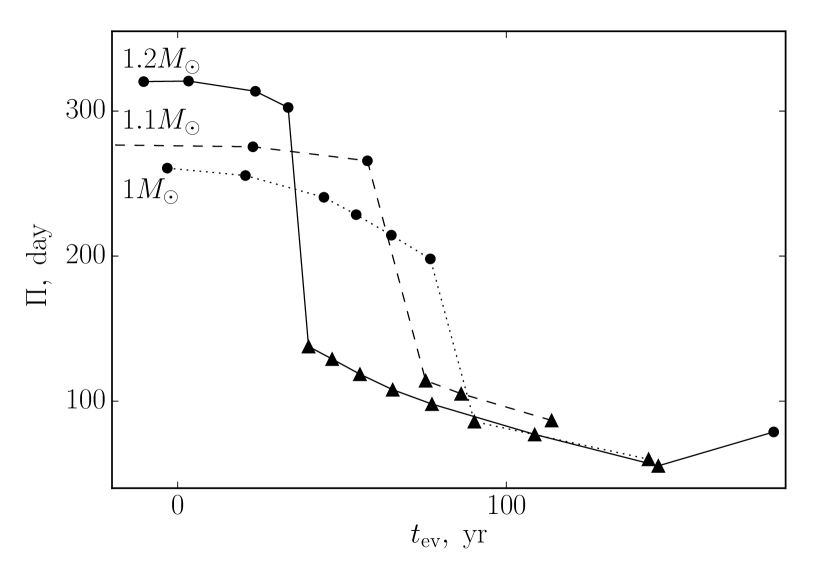
As can be clearly seen in Figs. 3 and 4, the stellar radius at the maximum of increases each thermal pulse. The only exception is the third thermal pulse of the evolutionary sequence when the condition of monotonic increase of is not fulfilled. Results of our computations show that the only exception in monotonic increase of as a function of the thermal pulse index occurs almost in each evolutionary sequence. In particular, the condition of monotonic increase is not fulfilled for () or for (). Bearing in mind these rare exceptions we try to find the hydrodynamic model with pulsation period day assuming that monotonically increases with .
The evolutionary time of the TP–AGB star is sensitive to the initial mass therefore to compare the evolutionary sequences it is preferable to use the index of the thermal pulse as an independent variable. The period–thermal pulse diagram for evolutionary sequences is shown in Fig. 5. The pulsation periods at maxima of are shown by filles circles and filled triangles for the fundamental mode and first overtone pulsators, respectively.
Plots in Fig. 5 allow us to conclude that the most appropriate evolutionary sequences for the model of T UMi have initial masses . Indeed, only for these sequences one can find two adjacent models and pulsating in the same mode with periods satisfying the condition . In particular, this condition is fulfilled only for the fundamental mode pulsations during the third and the fourth termal pulses. The age of the star is , and yr for models , and , respectively.
Fig. 6 shows the plots of the pulsation period as a function of for evolutionary sequences , and . For each sequence the evolutionary time is set to zero at maximum of and initial pulsation periods are 261, 278 and 320 day. Of most interest are the hydrodynamic models of the evolutionary sequence because the initial value of the pulsation period day differ from the observed period of T UMi by less than 2%.
In favour of the evolutionary sequence as the most appropriate model for T UMi is also the fact that the time interval yr between the onset of period decrease and the mode switch from the fundamental mode to the first overtone agrees with observations (Uttenthaler et al. 2011). As is seen in Fig. 6, the mode switch occurs later with decreasing stellar mass and for the disagreement between the model and observations becomes significant ( yr).
At the onset of period reduction the stellar mass is , and decrease of the radius and luminosity proceeds for yr. General parameters of the models for this time interval are listed in the table. The first column gives the evolutionary time which is set to zero at the maximum of . The second and the third columns give the stellar luminosity and the radius of the evolutionary model used as initial conditions in solution of the equations of hydrodynamics for nonlinear stellar oscillations. The fourth column gives the mean value of the radius of the photosphere obtained from the limit cycle hydrodynamic computations. The ratio of the mean radius of the photosphere to the initial stellar radius ranges within due to nonlinearity of stellar pulsations. In the last three columns we give the pulsation period , the pulsation constant and the order of the pulsation mode . It should be noted that was calculated from the period–mean density relation with the mean radius of the photosphere .
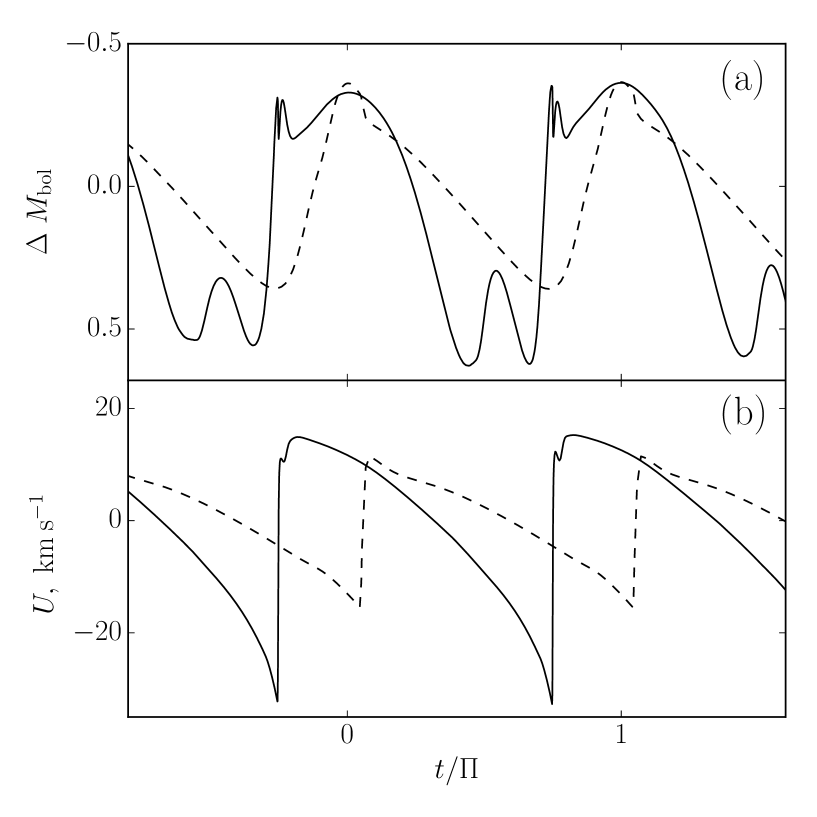
Fig. 7 shows the bolometric light and the surface velocity curves for two hydrodynamic models of the evolutionary sequence . The first of these models corresponds to the onset of period reduction (), whereas the second one corresponds to yr when the star became the first overtone pulsator. The second model is by mag fainter in comparison with the first model. Smaller amplitude of the light curve is due to mode switch from the fundamental mode to the first overtone.
4 conclusions
Presented above results of stellar evolution and stellar pulsation calculations for red giants with initial measses from 1 to extend the grid of evolutinary and pulsational models for more massive () AGB stars (Fadeyev 2016; 2017). Agreement of the family of hydrodynamic models with observations of the Mira–type star T UMi corroborates the stellar evolution computations that provided us with initial conditions required for solution of the Cauchy problem. A cause of insignificant disagreement between the theory and observations seems to be due to the fact that T UMi is at the beginning of its TP–AGB stage because the outer layers of the star are still oxygen–rich without dredgedup material traced by radio–active technetium (Uttenthaler et al. 2011). Therefore, uncertainties accompanying evolutionary computations of TP–AGB stars (extended convective mixing due to overshoot and mass loss rates) has not played yet significant role in evolutionary and hydrodynamic models.
The best agreement of our evolutionary and hydrodynamic computations with observations was obtained for the star age yr. Therefore, the initial metallicity of the model of T UMi seems to be somewhat underestimated. It should be noted that variation of metallicity within do not affect perceptibly both the pulsational instability and the pulsation period because oscillarions are excited in the hydrogen ionization zone.
Observations of the Mira–type star T UMi during near decades are of great importance because extention of the time interval for comparison of the theory with observations will allow us to obtain further constraints on the basic parameters and conclusions of the stellar evolution theory.
This research was supported by the Basic Research Program P–28 of the Presidium of the Russian Academy of Sciences.
references
-
1.
T. Bloecker, Astron. Astrophys. 297, 727 (1995).
-
2.
A.I. Boothroyd and I.-J. Sackmann, Astrophys. J. 328, 632 (1988).
-
3.
A. Claret and G. Torres), Astrophys. J. 849, 18 (2017).
-
4.
Yu.A. Fadeyev, MNRAS 449, 1011 (2015а).
-
5.
Yu.A. Fadeyev, Pis’ma Astron. Zh., 41, 694 (2015b) [Astron.Lett. 41, 640 (2015b)].
-
6.
Yu.A. Fadeyev, Pis’ma Astron. Zh. 42, 731 (2016) [Astron. Lett. 42, 665 (2016)].
-
7.
Yu.A. Fadeyev, Pis’ma Astron. Zh., 43, 663 (2017) [Astron.Lett. 43, 602 (2017)].
-
8.
J. Gál and K. Szatmáry, Astron. Astrophys. 297, 461 (1995).
-
9.
F. Herwig, Astron. Astrophys. 360, 952 (2000).
-
10.
P.C. Keenan, Astropys. J. Suppl. Ser. 13, 333 (1966).
-
11.
J.A. Mattei and G. Foster, J. Am. Assoc. Var. Star Observ. 23, 106 (1995).
-
12.
B. Paxton, L. Bildsten, A. Dotter, F. Herwig, P. Lesaffre, and F. Timmes, Astropys. J. Suppl. Ser. 192, 3 (2011).
-
13.
B. Paxton, M. Cantiello, P. Arras, L. Bildsten, E.F. Brown, A. Dotter, C. Mankovich, M.H. Montgomery, et al., Astropys. J. Suppl. Ser. 208, 4 (2013).
-
14.
B. Paxton, P. Marchant, J. Schwab, E.B. Bauer, L. Bildsten, M. Cantiello, L. Dessart, R. Farmer, et al., Astropys. J. Suppl. Ser. 220, 15 (2015).
-
15.
D. Reimers, Problems in Stellar Atmospheres and Envelopes, Ed. by B. Baschek, W.H. Kegel, and G. Traving (Springer, New York, 1975), p. 229.
-
16.
M. Schwarzschild and R. Härm, Astrophys. J. 142, 855 (1965).
-
17.
K. Szatmáry, L.L. Kiss, and Zs. Bebesi, Astron. Astrophys. 398, 277 (2003).
-
18.
P.A. Whitelock, New Astronomy Reviews 43, 437 (1999).
-
19.
A. Weigert, Zeitschrift für Astrophys. 64, 395 (1966).
-
20.
A. Weiss and J.W. Ferguson, Astron. Astrophys. 508, 1343 (2009).
-
21.
P.R. Wood and D.M. Zarro, Astrophys. J. 247, 247 (1981).
-
22.
S. Uttenthaler, K. van Stiphout, K. Voet, H. van Winckel, S. van Eck, A. Jorissen, F. Kerschbaum, G. Raskin, S. Prins, W. Pessemier, C. Waelkens, Y. Frémat, H. Hensberge, L. Dumortier, and H. Lehmann, H., Astron. Astrophys. 531, A88 (2011).
| , yr | , day | , day | ||||
|---|---|---|---|---|---|---|
| 0.0 | 4077 | 222 | 242 | 320 | 0.0815 | 0 |
| 30.3 | 3905 | 215 | 234 | 303 | 0.0815 | 0 |
| 36.5 | 3791 | 210 | 233 | 138 | 0.0372 | 1 |
| 74.1 | 2934 | 174 | 186 | 98 | 0.0373 | 1 |
| 143.0 | 1816 | 123 | 126 | 55 | 0.0373 | 1 |
| 178.1 | 1514 | 109 | 113 | 79 | 0.0638 | 0 |