The failed state transition of the ATOLL source GRS 1724–308
Abstract
The 2004-2012 X-ray time history of the NS LMXB GRS 1724–308 shows, along with the episodic brightenings associated
to the low-high state transitions typical of the ATOLL sources, a peculiar, long lasting ( d) flaring event, observed in 2008.
This rare episode, characterised by a high-flux hard state, has never been observed before for GRS 1724–308 , and in any case is not common among ATOLL sources.
We discuss here different hypotheses on the origin of this peculiar event that displayed the spectral signatures of a failed transition, similar in shape and duration to those rarely observed in Black Hole binaries. We also suggest the possibility that the atypical flare occurred in coincidence with a new rising phase of the 12-years super-orbital modulation that has been previously reported by other authors.
The analysed data also confirm for GRS 1724–308 the already reported orbital period of d.
keywords:
X-rays: binaries – X-rays: individual: GRS 1724–308 – stars: neutron1 Introduction
GRS 1724–308, alias 4U 1722–30 or H1724-307, is a LMXB containing a weakly magnetized NS, revealed by the presence of type-1 X-ray bursts in its X-ray light curve (Swank et al., 1977). The bursts are typically Eddington limited (Cocchi et al., 2001) thus allowing to determine a distance of about 9.5 kpc to the source (Kuulkers et al., 2003).
GRS 1724–308 is located in the globular cluster Terzan 2 (Grindlay et al., 1980) and even if it is known since 70s that the cluster hosts a bright X-ray source, the GRS 1724–308 position has been set only in 2002 (Revnivtsev et al., 2002) by Chandra, at confidence level above 4 within the radius containing half of the cluster mass.
GRS 1724–308 is one of the first NS systems known to have hard X-ray emission (E 35 keV) as revealed by SIGMA in 1991 with a power law emission extending above 100 keV and a photon index 1.65 (Barret et al., 1991).
Its spectral/timing properties are typical of the ATOLL sources (Olive et al., 1998; Altamirano et al., 2008); the source spends most of the time in a low hard state (LHS) with occasional flares signalling a transition to the high soft state (HSS).
The first detailed broad band study performed with BeppoSAX and RXTE showed a LHS Comptonized spectrum extending up to 200 keV of temperature keV, plus an additional soft disk component of keV (Guainazzi et al., 1998).
1.1 The long term monitoring of GRS 1724–308
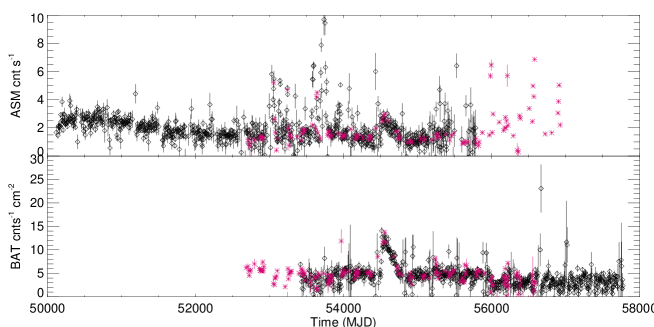
Our study reports on the monitoring of GRS 1724–308 over 12 years. This period of time covers all the RXTE/ASM operational life plus an year of data collected only by INTEGRAL and SWIFT satellites (see Fig. 1). However, exploiting further literature informations, we reconstructed the source behaviour over about 40 years that we resume herewith:
- •
-
•
MJD 48000–52000:
Emelyanov et al. (2002), reported on a RXTE/PCA observation that showed a flux increase throughout a long rise time of about 5 years, that reached a peak around the end 1996/early 1997 (MJD 50300-50500) and then showed a long decay phase, again of about 5 years.This modulation of the flux was tentatively associated to an intrinsic accretion rate variation from the donor star, or the passage of a third body, or even to a gravitational microlensing effect.
-
•
MJD 50000–53550:
As metioned before, Guainazzi et al. (1998) reported on X-ray broadband observations performed with BeppoSAX satellite in August 1996.The data were collected before and after a type I X-ray burst and revealed a spectrum that extends up to 150 keV, typical of a LHS. This behaviour appears to be very similar to that of an observation performed by ASCA and RXTE in 1995 and reported by Barret et al. (1999).
The RXTE/PCA observations published by Altamirano et al. (2008) show that the source spent a long period (from MJD 51214 to 52945) without any particular variation with a flux of about 25 mCrab in the 2-20 keV band. This period is partly overlapping and in agreement with the decay pha(for significant HIDs). se of the long term peak of the observations reported by Emelyanov (see above). After MJD 53000, the source changed its behaviour, and showed different flares with peak fluxes up to 80 mCrab, until the end of the observations. A Lomb-Scargle periodogram in the PCA 2-20 keV band data showed a periodicity of about 90.55 days. This periodicity could be related to the orbital period of the binary system. -
•
MJD 50000–55000:
Kotze (Kotze et al., 2010) studied the long term X-ray variability in a sample of LMXBs, including GRS 1724–308 , to search for super-orbital periods using the ASM data from 1996-2009. Even though the period of observation is not enough to include more than one cycle, the source seems to have a super orbital modulation of 123 years. Such a long-term modulation has been supposed to be produced by variation of accretion rate due to long magnetic-activity cycle of the donor star, a mechanism that has been proposed firstly in the Cataclysmic Variable objects (Applegate & Patterson, 1987; Warner, 1988).
2 Data analysis and observation sets
In order to follow the flux evolution of the source we used the near-continuous coverage of the daily light curves from the RXTE/All-Sky Monitor (ASM) (Levine et al., 1996) and Swift/Burst Alert Telescope (BAT) (Krimm et al., 2013) monitors. The daily light curve of the soft X-ray monitor (2-12 keV) ASM are provided by the ASM/RXTE teams at MIT and at the RXTE SOF and GOF at NASA’s GSFC and can be downloaded from the public web site111 http://xte.mit.edu/ASMlc.html. The daily light curve of the Swift hard X-ray monitor BAT are available from the public web site222 http://swift.gsfc.nasa.gov/results/transients/ and provided by the Swift/BAT team. The BAT/ASM hardness ratio has been calculated using the 1-day averaged light curves of both instruments expressed in Crab units and selecting the simultaneous observations. We used the conversion values reported in Yu & Yan (2009): 1Crab=75 cnt/s for ASM; 1 Crab=0.23 cnt/s/cm2 for BAT.
The IBIS and JEM-X light curves were collected using the HEAVENS tools provided by the INTEGRAL Science Data Centre web site (Walter et al., 2010)333http://www.isdc.unige.ch/integral/heavens.
The INTEGRAL data, used for the spectral analysis, were reduced using OSA 10.2 (Goldwurm et al., 2003; Winkler et al., 2003), and include the X-ray monitor JEM-X (Lund et al., 2003) and ISGRI (15 keV–1 MeV) (Ubertini et al., 2003), the low-energy detector of the -ray telescope IBIS (Lebrun et al., 2003). For the spectral analysis, XSPEC software v.12.7.1 (Arnauld et al., 1996) has been used. Within XSPEC, a systematic error of 0.02 has been added to the spectral data, the instrument constant was fixed to 1 for IBIS and kept free for JEM-X.
The periodicity study performed on these data sets, has been performed by the XRONOS package v. 5.21.
3 Time evolution of the source
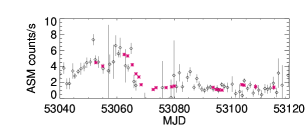
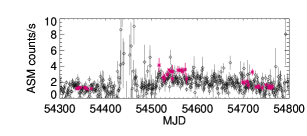
The first two panels of Fig. 1 show the 2-12 keV RXTE/ASM and 15-50 keV Swift/BAT light curves, respectively (black diamonds), The pink asterisks represent the JEM-X (top panel) and the IBIS light curves (bottom panel) extracted in the same energy range of ASM and BAT, respectively, and rescaled in order to obtain similar average counting rates.
3.1 The state transition flares
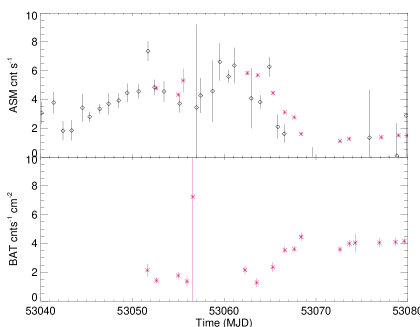
Fig. 1 shows GRS 1724–308 is clearly variable, presenting several flare-like episodes with typical durations of days most likely related to the spectral state transitions typical of the ATOLL sources. These flare-like episodes show a peak flux in the soft X-rays ( 20 keV) usually characterised by a short-time rise and a slower decay. The soft flux increase is generally followed by a delayed increase in the harder band ( 20 keV). As an example, in Fig. 2 we show the ASM and ISGRI light curves of a state transition flare-like event occurred on 2004, where the anti-correlation between the soft and hard flux is evident.
3.2 The 2008 long peculiar flare-like episode
Fig. 1 clearly shows that roughly between MJD 54500–54900, the light curves present an evident simultaneous increase of the flux in both the soft and the hard energy bands.
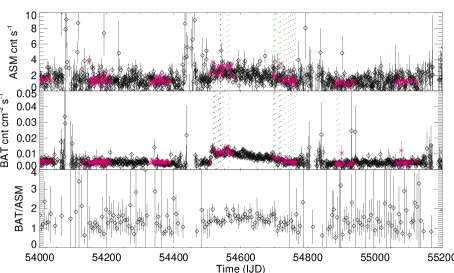
This episode (hereafter termed 2008 flare) is displayed in a zoomed view in the first two panels of Fig. 3. The 2008 flare has profile and duration very different from the ones of the state transition flares. In fact, this smoothly varying event shows NO anti-correlation in the hard and soft energy bands and lasted for more than 200 days (54500 MJD - 54725 MJD), i.e. times the typical duration ( days) of the state transition flares. The intensity “bump” is clearly evident in the BAT 15-50 keV lightcurve. During this peculiar flare the average hard flux (>20 keV) reached a peak value never observed before in the GRS 1724–308 history. Moreover, there is no indication of significant hard colour variability during the flare (see Fig. 3, 3rd panel).
3.3 Periodicity studies
If we assume that the first maximum of the super orbital modulation reported by Kotze et al. (2010) coincides with the peak flux in late 1996 – early 1997 reported by Emelyanov et al. (2002) (i.e. the authors reported on the same super orbital cycle), the 2008 flare occurs at the beginning of the next super orbital cycle i.e., within the errors, at the new minimum.
Of course this statement needs to be verified on a much longer time basis including more than a single cycle of long term modulation.
Our short term periodicity studies confirm the 90 days period firstly reported by Altamirano et al. (2008) in the PCA data. The 90 d period is present both in our ASM and BAT data sets. For this periodicity, the folded light curves of both ASM and BAT are shown in Figure 4. This modulation is most likely related to the orbital period of the binary system (Altamirano et al., 2008) and not to the super orbital modulation proposed by Emelyanov et al. (2002).

4 Colour–Intensity diagrams
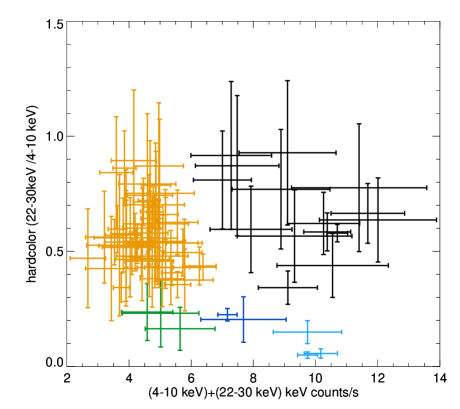
We used the INTEGRAL data to construct hard colour vs intensity (or hardness–intensity) diagrams (HID). JEM-X counts have been collected in two energy ranges (soft, 4-10 keV, and hard, 10-20 keV), along with simultaneous IBIS counts in the 20-30 keV range.444the ASM and BAT data are too noisy to produce good HIDs but for the 2008 flare data.. Two sets of HID have been constructed: hard/soft JEM-X ratio and ISGRI/soft JEM-X ratio, in function of the total count rate in the two bands.
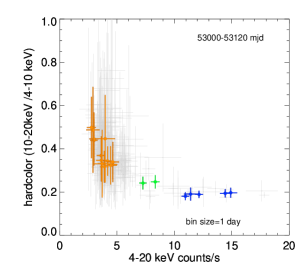
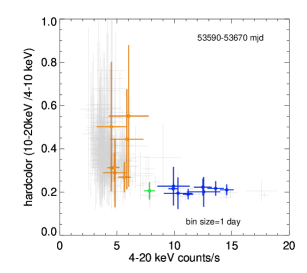

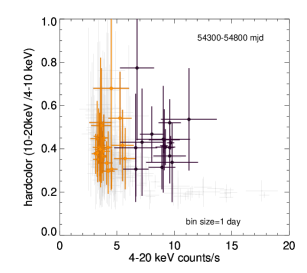
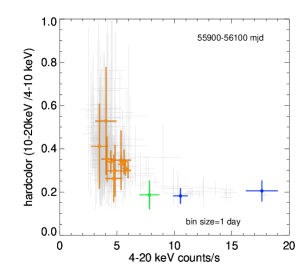

The JEM-X HIDs are displyed in Fig. 5. Each HID diagram refers to a different flare (coloured points), whose points are over-plotted on the ones of the whole data set, including both flares and steady emission (background grey crosses). The corresponding light curve is reported in the figure at the bottom of each HID.
For each diagram we have used different coloured symbols to group the data with similar spectral states. Spectra groups have been defined imposing a fixed range of values of hard colour and intensity. The orange points indicate the hard state data, the blue points the soft state data, the green ones the intermediate state data. The black points are the ones of the 2008 peculiar flare. As the HIDs show, the source spends most of its time in a hard state and during an occasional flare it typically shows a state transition. During the various “standard” flares the source tracks similar curves in the diagram. Conversely, during the 2008 flare the source exhibited a bright hard state (black points) with a different position in the HID. This position was never reached again in the 12 years that are the subject of our study and this peculiarity was previously unreported.
Fig. 6 displays the HID derived from simultaneous JEM-X and IBIS pointings throughout the monitoring period555 Due to the INTEGRAL observation strategy and the different FOV of the two instruments, only part of the JEM-X and IBIS data are simultaneous. The colours of the points have the same meaning as in Fig. 5. The separation of the various spectral states, included the peculiar bright hard state of the 2008 flare, is evident also in this figure.
4.1 2008 flare: BAT/ASM HID
Due to observatory and time allocation constraints, INTEGRAL daily monitoring of GRS 1724–308 is not available and this could prevent the detection of possible short time-scale state transitions during the 2008 flare.
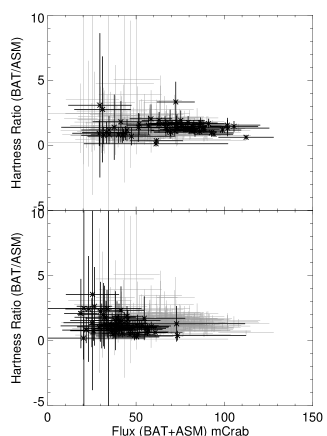
Nevertheless, the flare is bright enough, compared to the rest of the GRS 1724–308 time history, to allow the construction of a significant BAT/ASM HID of the event.
In particular, the first and last 60 days of the flare were investigated in comparison with its total HID evolution (Fig. 7).
The first panel of the figure shows a clear flux increase with constant hardness at the beginning of the flare. In its last part, the flux decreases slowly (see also e.g. Fig 3) and the flux drop is less evident in the HID of the last 60 days.
The calculated averages of the hard colour are for the entire flare and
, for the leading and trailing 60 d, respectively.
Their consistency within the errors indicates there is no time evolution in the hard colour during the 2008 event, as already suggested by Fig 7. Also The calculated for the 1 day ratios are compatible with no HR variability.
5 Spectroscopy of the source
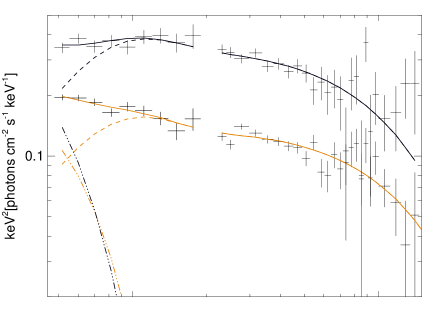
We performed the analysis of the averaged simultaneous IBIS and JEM-X spectra constructed by collecting data of different flares with the same hardness characteristics, i.e. data with the same colour in the Jem-X/IBIS hardness-intensity diagram (see Figure 6). Figure 8 shows the spectra of the two hard states of GRS 1724–308 corresponding to the orange and the black points in Figure 6. The model used for the fitting procedure is a disk black body component (Mitsuda et al., 1984) plus a comptonization of soft photon via relativistic electron plasma (Poutanen & Svensson, 1996), DISKBB+compPS in XSPEC. CompPS is effective in modeling Comptonized emission from a hot, optically thin plasma region like that of the NS-LMXB in a LHS. The plasma parameters commonly observed in LHS (kTe > keV, < ) are safely within the model’s validity parameter space. Instead, when analytic models assuming a diffusion regime (e.g. the largely adopted CompTT, Titarchuk (1994)), are applied to low opacity plasma clouds, the fit values obtained could be unreliable.
The fitted parameters for the two LHS (see Table 1 are consistent to each other within the errors and with the ones reported in literature for the source LHS ( e.g. Guainazzi et al., 1998; Barret et al., 1999).
The two spectra have instead very different flux : in fact the 2008 peculiar LHS is brighter than the standard one.
Although the rising of the 2008 flare is not covered by INTEGRAL observations, the HR vs time of the final part of the flare does not show variations within the errors, therefore we presume that the flare substantially evolved at constant spectrum as already shown by the BAT/ASM flux ratio in Fig. 3 .
As far as the standard flares HSS spectra are concerned, only Jem-X data have been used for spectral extraction.
We obtained good quality spectra only for the data sets corresponding to blue and light blue points in Figure 6.
We modelize the soft spectra with a disk black body component plus an inverse Compton component. In this case the Comptonization model is CompTT (Titarchuk, 1994). CompTT is effective for low temperature, highly opaque electron plasmas as the HSS ones. Unfortunately the disk black body component could not be constrained because it is confused into the Comptonised one. In the hard state spectra, instead, the Comptonised component peaks at higher energy ( 20 keV) and let the disk black body component clearly visible even with the Jem-X spectral capability. Fitting the HSS data only with CompTT, we obtained spectral parameter values in agreement with those reported in literature for other NS LMXB (see for example Barret et al., 2000; Paizis et al., 2006; Tarana et al., 2008, and reference therein). Compared to LHS spectra, the electron plasma temperature decreases to keV, while the optical depth exceeds the value of 5 (see Tab 2).

| Spectrum | Factor | Tin | KTe | tau-y | Flux2-10keV | Flux10-150keV | |||
|---|---|---|---|---|---|---|---|---|---|
| – | – | keV | — | keV | — | — | — | ergs cm-2 s-1 | ergs cm-2 s-1 |
| Orange | 1.1/30 | 4.9e-10 | 5.0e-10 | ||||||
| Black | 1.0 /28 | 9.2e-10 | 12e-10 |
| Spectrum | KTe | tau-p | Flux2-10keV | Flux10-150keV | ||
|---|---|---|---|---|---|---|
| – | keV | — | — | — | ergs cm-2 s-1 | ergs cm-2 s-1 |
| Light blue | 0.40/13 | 8.4e-10 | 2.3e-10 | |||
| Blue | 0.30/11 | 6.5e-10 | 1.9e-10 |
6 Discussion
The time history of GRS 1724–308 alternates long-lasting low luminosity periods of negligible activity to other phases, generally shorter, with strong activity characterized by bright flares and LHS to HSS transitions. This is a typical time behaviour of the persistent low-luminosity ATOLL sources. For this subclass, the state transitions to the HSS are relatively rare episodes as their canonical spectral state is a LHS of . Conversely, the bright persistent ATOLLs (e.g. most of the so-called GX sources) exhibit an HSS () as their canonical state, with no or rare transitions to the LHS.
The different behaviour supposedly reflects intrinsic differences in the binary systems, such as donor mass and activity, orbital parameters, star population, etc.
As an example, the persistent emitters located in a globular cluster are generally faint, LHS, ATOLLs.
Among the latter sample, GRS 1724–308 in Terzan 2 seemed to show no peculiarities.
This work reports on the observation of an atypical, long lasting (>300 d) hard flare, which is an unprecedented event in the source time history.
The 2008 flare, for its shape, time scale and coverage of an unusual bright-hard region in its HID, shares similarities with the failed state transitions (or failed outburts)
observed in some cases in Black Hole binary systems (Brocksopp et al., 2004; Capitanio et al., 2009; Ferrigno et al., 2012).
The main difference is the persistence of the emission of GRS 1724–308 , as almost all the BH LMXB are transient sources.
Among NS LMXB similar failed transitions are much less common. An interesting case is the one of Aql X–1 , a nearby, quasi-persistent (or quasi-transient) NS which exhibited a
failed state transition during an outburst (Rodriguez et al., 2006).
However, unlike the GRS 1724–308 one, the failed outburst of Aql X–1 shows both duration and luminosity similar to the standard outbursts of the source but in that case, according to the authors, the LHS to HSS state transition generally observed during the outbursts did not occur.
Moreover, even though Aql X–1 is classified as an ATOLL source, Rodriguez et al. (2006) underline its behaviour similar to that of a number of BH binaries, XTE 1550-564 in particular.
Conversely, as mentioned above, GRS 1724–308 has no peculiarities among its class of objects.
So the two episodes are likely intrinsically different in their nature.
For comparison sake, we investigated the critical luminosities for the atypical failed transitions of both GRS 1724–308 and Aql X–1 , here defined as the
luminosities where the LHS to HSS transition is expected to occur.
Extrapolating the Aql X–1 unabsorbed cut-off power-law spectrum published by Rodriguez et al. (2006), a bolometric luminosity (for a 5 kpc distance) of is obtained for the peak of the failed outburst. This value should equal, or be very close to, the critical one, as e.g. Maccarone & Coppi (2006) report the 1999 HSS transition outbursts in the range.
For the case of GRS 1724–308 the bolometric extrapolation of the relevant spectra (see the sections above) lead to for the hard 2008 flare, very similar to the case of Aql X–1 .
The typical (years 2003–2005) state transition flares of GRS 1724–308 peak at (Tarana et al., 2008), which is a relatively higher value.
However, this value should be regarded only as an upper limit to the one of the critical luminosity for GRS 1724–308 .
One could reasonably deduce that the 2008 hard flare did not reach the critical luminosity for the LHS to HSS transition, so the flare should be regarded as the effect of an anomalous accretion event rather than a classic failed outburst episode.
The 2008 perturbation, whose energy surplus has been likely almost completely dissipated via coronal emission, looks less powerful and acting on a much longer time scale than the standard ones.
Such a rare, weak perturbation could be connected to
the 12 yr super orbital modulation reported in Section 1.1, possibly related to a secular magnetic cycle of the donor star.
In fact the peculiar 2008 flare looks in coincidence with the minimum of the long term period, though we do not have enough data to establish a firm correlation.
Besides this possible long term coincidence, a rare variability episode of the donor, or the periastron of a third body in an eccentric orbit, or the transit of a nearby star could explain the anomalous 2008 hard flare. The last possibility could not be uncommon in a densely populated stellar system like a Globular cluster.
As recently reported in literature by various authors (for a review see for example Belloni (2010) and reference therein) the state transitions in X-ray binaries do not seem to be governed by the mass accretion rate only. A second parameter, which nature is still unclear, seems to be involved in the spectral transitions. This scenario is evident for BH binaries (Homan et al., 2001) that continuously shift the HID pattern, while for NS binaries this behaviour is less evident, even though the secular shifts observed in both ZETA and ATOLL sources (e.g. Di salvo et al. (2003)) could be related to the action of this unknown parameter. Therefore, one could speculate that also the 2008 peculiar flare of GRS 1724–308 could be an effect of the action of the second parameter and not directly related to an increase of the mass accretion rate.
Acknowledgments
We thank the anonymous referee for helpful comments that improved this manuscript. FC and MC acknowledge financial contribution from the agreement ASI-INAF n.2017-14-H.O.
References
- Altamirano et al. (2008) Altamirano D., Van der Klis M., Méndez M, et al. ApJ 687, 488, 2008
- Applegate & Patterson (1987) Applegate J. H. & Patterson J., ApJ 322 L99, 1987
- Arnauld et al. (1996) Arnauld K. A., in Jacoby G.H., Bames J., eds, ASP Conf. Ser. Vol 101, Astronomical data analysis software and systems V. Astron. Soc. Pa., San Francisco, p.17
- Asai et al. (2012) Asai, K., Matsuoka, M., Mihara, T. et al. PASJ 64, 128, 2012
- Barret et al. (1991) Barret, D., Olive, J.F., Boirin, L. et al. A&A 357, L41, 1991
- Barret et al. (1999) Barret, D., Grindlay, J.E., Harrus I. M. and Olive, J.F. A&A 341, 789, 1999
- Barret et al. (2000) Barret, D., Olive, J.F. Boirin, L. et al. ApJ 533, 329, 2000
- Belloni (2010) Belloni T., LNP, 794, Chapter 9
- Brocksopp et al. (2004) Brocksopp O., Bandyopadhyay R. M., Fender R. P., 2004, New Astron., 9, 249
- Campana et al. (2013) Campana, S., Coti Zelati, F., D’Avanzo, P. MNRAS 432, 1695, 2013
- Capitanio et al. (2009) Capitanio, F., Belloni, T., Del Santo, M., Ubertini, P. 2009, MNRAS, 398, 1194
- Cocchi et al. (2001) Cocchi, M., Bazzano, A., Natalucci, L., et al. 2001, in Exploring the Gamma-Ray Universe, Fourth INTEGRAL workshop, ESA SP-459, 279
- Di salvo et al. (2003) Di Salvo, T., M ndez, M., van der Klis, M., A&A, 406, 177, 2003
- Emelyanov et al. (2002) Emelyanov A. N., Revnivtsev M. G. et al. AstL 28, 12, 2002
- Farrell et al. (2009) Farrell S. A., Barret D. and Skinner G. K. MNRAS, 393, 139, 2009
- Ferrigno et al. (2012) Ferrigno C., Bozzo E., Del Santo M., and Capitanio F. A&A 537, L7, 2012
- Forman et al. (1978) Forman W., Jones C., Cominsky L., et al. Astron. Astrophys. Suppl. Ser. 38, 357 (1978)
- Gladstone et al. (2007) Gladstone J., Done C. and Gierlińki M. MNRAS, 378, 13, 2007
- Goldwurm et al. (2003) Goldwurm A., David P., Foschini L. et al A&A, 411, L223, 2003
- Guainazzi et al. (1998) Guainazzi M., et al. A&A 339, 802, 1998
- Grindlay et al. (1980) Grindlay, J. E., Marshall, H. L., Hertz, P., et al. ApJ 240, L21,1980
- Homan et al. (2001) Homan J., Wijnands R., van der Klis M., Belloni T., ApJS, 132, 377,2001
- Kuulkers et al. (2003) Kuulkers, E., den Hartog, P. R., in’t Zand J. J. M. et al. A&A, 399, 663, 2003
- Kotze et al. (2010) Kotze, M. M.; Charles, P. A., MNRAS, 402L, 16, 2010
- Krimm et al. (2013) Krimm, H. A., et al., 2013, ApJSS 209,14
- Lebrun et al. (2003) Lebrun F., et al., 2003, A&A, 411, L141
- Levine et al. (1996) Levine A. M., Bradt H., Cui W., et al. Astrophys.J.469 L33,1996
- Lund et al. (2003) Lund N., et al., 2003, A&A, 411, L231
- Maccarone & Coppi (2006) Maccarone, T. J., & Coppi, P. S. 2003, A&A 399, 1151
- Mitsuda et al. (1984) Mitsuda, K. et al., PASJ, 36, 741, 1984
- Olive et al. (1998) Olive, J.F., Barret, D., Boirin, L. et al. A&A 333, 942, 1998
- Paizis et al. (2006) Paizis, A.; Farinelli, R.; Titarchuk, L. et al. 2006 A&A, 459, 187P
- Parmar et al. (1989) Parmar A.N., Stella, L. & Giommi, P., A&A 222, 96, 1989
- Poutanen & Svensson (1996) Poutanen J., & Svensson R., 1996, ApJ, 470, 249
- Revnivtsev et al. (2002) Revnivtsev, M.G., Trudolyubov, S. P., and Borozdin, K. N., AstL 28, 237, 2002
- Rodriguez et al. (2006) Rodriguez, J., Show, S., Corbel, S. , 2006, A&A, 451, 1045
- Swank et al. (1977) Swank, J.H., Becker, R. H., Boldt, E. A., et al. ApJL 212 L73, 1977
- Titarchuk (1994) Titarchuk, L. ApJ 434, 570, 1994
- Tarana et al. (2008) Tarana A., Bazzano A., Federici M. and Ubertini P. PoS(Integral08)046, 2008
- Ubertini et al. (2003) Ubertini P., et al., 2003, A&A, 411, L131
- Walter et al. (2010) Walter, R., Rohlfs, R., Meharga, M.T., et al, 2010, PoS(INTEGRAL 2010)162
- Warner (1988) Warner B., Nat. 336, 129, 1988
- Winkler et al. (2003) Winkler C., et al., 2003, A&A, 411, L1
- Yu & Yan (2009) Yu W., Yan Z., 2009, ApJ, 701, 1940
- Zdziarski et al. (2007) Zdziarski A. A., Gierlińki M., Wen L. and Lostrzewa Z. MNRAS 377, 1017, 2007