Exploring the CO/CN line ratio in nearby galaxies with the ALMA archive
Abstract
We describe an archival project using Cycle 0 data from the Atacama Large Millimeter/submilleter Array to survey the CO/CN line ratio in 17 nearby galaxies. CN is an interesting molecule that traces dense gas exposed to ultraviolet radiation and its lines can be observed simultaneously with the CO line. We identify 8 galaxies with distances Mpc for which both lines are detected. Signal-to-noise matched CO/CN ratios range from as low as 7 to as high as 65, while ratios using the total detected flux range from 20 to 140. Spatial variations greater than a factor of 3 are seen in several galaxies. These line ratio changes are likely due to changes in the [CN]/[H2] abundance ratio and/or the CN excitation. Additional measurements of the warm gas pressure and the CN excitation should help to distinguish between these two possibilities. 3 of the 4 active galactic nuclei in our sample show CO/CN line ratios that are roughly a factor of 2-3 larger than those seen in starburst-dominated regions, which may be in conflict with models of molecular abundances in X-ray dominated regions.
keywords:
galaxies: ISM – galaxies: starburst – ISM: molecules – ISM: abundances – galaxies: abundances1 Introduction
Molecular gas is an important component of the interstellar medium in galaxies at both low and high redshift. As the fuel for star formation, it provides a critical link with the stars that are the bulk of the baryonic mass in individual galaxies. Because molecular hydrogen itself is largely invisible at the low temperatures ( K) where the majority of the molecular gas is found, carbon monoxide (CO) is typically used to measure the molecular gas. Other molecules such as HCN and HCO+ are used to trace the higher density gas that is more directly associated with recent star formation (Gao & Solomon, 2004; Wu et al., 2010; Kennicutt & Evans, 2012). However, most molecular lines are typically an order of magnitude fainter than low- transitions of CO and thus only global measurements made with single dish telescopes are typically available for other molecular species (e.g. Aalto et al., 2002; Gao & Solomon, 2004; Juneau et al., 2009).
A particularly interesting molecule is the cyanide radical (CN), which can be produced from HCN via photo-dissociation and from reactions involving C+ and C (e.g. Boger & Sternberg, 2005). CN thus provides a probe of dense gas exposed to strong ultraviolet radiation fields in photon-dominated regions (PDRs). Formation of CN at high column densities can be driven by enhanced cosmic ray ionization rates (e.g. Boger & Sternberg, 2005) or by X-rays near an active galactic nucleus (AGN) as shown by models of X-ray dominated regions (XDRs) (e.g. Meijerink et al., 2007). The CN transition consists of 9 hyperfine lines blended into two groups, with the stronger group corresponding to the transitions and the weaker group the transitions. A recent large-area (10x10 pc) map of the Orion B molecular cloud shows a strong correlation of the CN emission with the ultraviolet radiation field (Gratier et al., 2017). However, a large (40x50) pc map of W51 by Watanabe et al. (2017) shows significant CN emission throughout the cloud with a relatively constant CN/13CO line ratio. The few extragalactic observations of CN prior to the Atacama Large Millimeter/submillimeter Array (ALMA) were primarily single-dish observations of infrared luminous galaxies (Aalto et al., 2002), nearby Seyfert galaxies (Pérez-Beaupuits et al., 2007, 2009; Aladro et al., 2013) and AGNs (Aalto et al., 2007; Chung et al., 2011). Fuente et al. (2005) detected CN emission at 3 locations in the nearby starburst galaxy M82. Typical CO()/CN() integrated intensity ratios are in the range of 10-20 in these systems.
A few of the brightest galaxies were mapped in CN at higher angular resolution prior to ALMA. Ginard et al. (2015) observed M82 at resolution in several molecular lines, including CN , with the Plateau de Bure Interferometer (PdBI). They found significant variations in the CN abundance within M82 as well as a correlation of the CN/N2H+ line ratio with H41. These CN variations can be explained in chemical models as due to changes in the strength of the ultraviolet radiation field and the average size of the molecular clouds. García-Burillo et al. (2010) mapped the nearby Seyfert 2 galaxy NGC 1068 in the CN N=2-1 line and the SiO J=2-1 line at resolution with the PdBI. The data reveal a high CN abundance in the circumnuclear disk that cannot be produced by either shock or PDR models. García-Burillo et al. (2010) suggest that the CN and SiO abundances imply that the circumnuclear disk region is a giant X-ray dominated region.
The fast mapping speed and high sensitivity of ALMA have opened the possibility to trace emission from rarer molecules and isotopes across a wide variety of galaxies and environments. ALMA’s imaging capabilities also provide the opportunity to study spatial variations in molecular emission lines inside galaxies. In addition, ALMA’s broad spectral coverage provides observations of a wide range of molecular species in just a few observations (e.g. Meier et al., 2015). These increased capabilities have produced a huge increase in the amount and quality of data available for nearby galaxies for the transitions of CN, which lie less than 2 GHz away from the CO line. This fortuitous arrangement means that CN can be easily observed whenever the CO line is the primary target. Such serendipitous observations of CN were particularly common during ALMA Cycle 0, when only limited correlator modes were available. For observations of nearby galaxies, the most commonly used correlator mode in Cycle 0 covered both the CO and the CN ground state lines with a spectral resolution of better than 1 km s-1. Programs in later cycles often observed CN along with the CO line, but sometimes in ALMA’s “continuum” mode with significantly lower velocity resolution on the CN line.
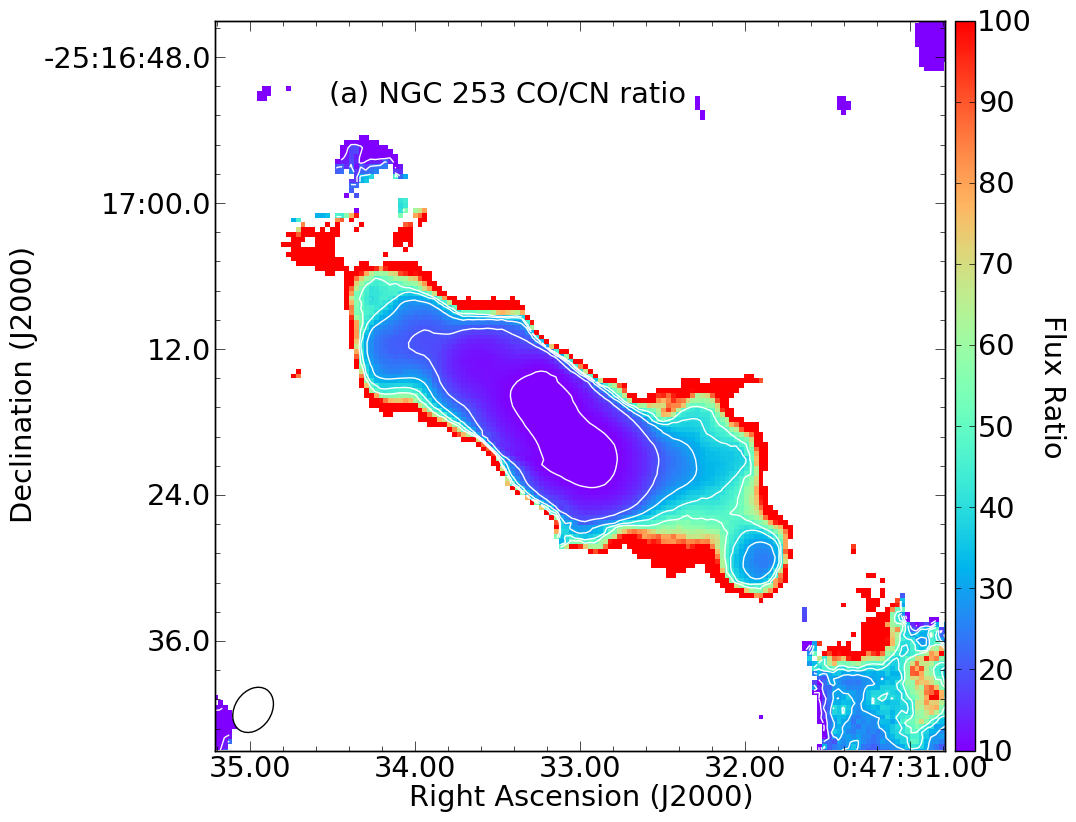
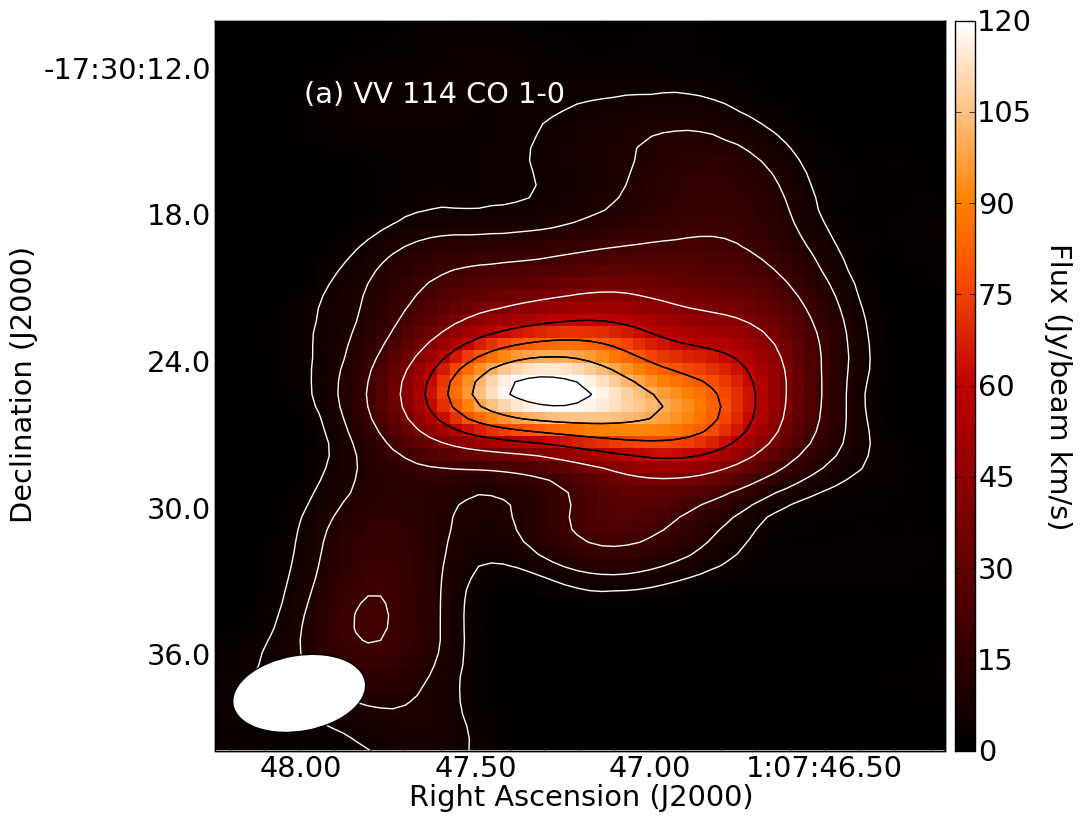
During ALMA Cycle 0, CN was one of the molecular lines in the 3 mm window mapped in the nearby starburst galaxy NGC 253 (Meier et al., 2015). These data show that the CN lines are optically thin and that the CO/CN line ratio increases with radius. Although the CN and HCN lines could not be compared directly because the maps had different angular resolutions, the HCN/C2H ratio shows a similar increase with radius. Since both CN and C2H are tracers of photon dominated regions (PDRs), Meier et al. (2015) concluded that PDRs account for a lower fraction of the dense gas in the outer disk compared to the inner disk. Saito et al. (2015) also find spatially varying abundances of CN and other molecules in the luminous infrared galaxy (LIRG) merger VV 114. Their suggestion that emission from the overlap region is dominated by shocks is supported by the detection of methanol from only the overlap region (Saito et al., 2017). Iono et al. (2013) argue that the eastern nucleus of VV114 contains an AGN.
Sakamoto et al. (2014) found faint, broad line wings in the CN emission from the LIRG merger NGC 3256, which suggests that some of the CN emission originates in nuclear outflows with an enhanced CN abundance. They use the outflow properties to argue that the southern nucleus hosts a (possibly dormant) AGN. Observing in the 350 GHz window, Nakajima et al. (2015) find spatial variations in the 13CO/CN ratio in NGC 1068, which they attribute to enhanced CN emission in the XDR of the circumnuclear disk. However, they note that changes in the 13CO abundance between the circumnuclear disk and the starburst ring may also play a role. García-Burillo et al. (2014) find dense gas tracers such as HCN and HCO+ in the circumnuclear disk of NGC 1068 and also in the outflow. Line ratios relative to CO are enhanced by a factor of 10 compared to the gas in the 1.3 kpc starburst ring, which they attribute to the UV/X-ray radiation coming from the AGN. García-Burillo et al. (2017) find that PDR models can account for the aboundance of C2H in the starburst ring of NGC 1068, but that the outflow emission requires time-dependent chemistry as well as shocks.
In this paper, we present an initial survey of the CN line (the stronger of the two 3 mm CN emission lines) observed simultaneously with the CO line in 17 nearby galaxies drawn from 6 separate Cycle 0 programs. §2 describes the selection of the CN galaxy sample, the image processing, and the method used to measure the CO/CN ratios. §3 discusses the properties of CN in the different galaxies and presents possible explanations for the observed variations in the CO/CN line ratios. §4 summarizes the conclusions and future work. Some details on the individual galaxies in the sample are given in Appendix A and upper limits for the galaxies without CN detections are given in Appendix B.
2 Sample selection and analysis
| Project Code | Galaxy | ALMA data reference |
|---|---|---|
| 2011.1.00099.S | 20 galaxies | Ueda et al. (2014) |
| 2011.1.00172.S | NGC 253 | Bolatto et al. (2013b) |
| 2011.1.00467.S | VV 114 | Iono et al. (2013) |
| 2011.1.00525.S | NGC 3256 | Sakamoto et al. (2014) |
| 2011.1.00645.S | NGC 1377 | … |
| 2011.1.00772.S | M83 | Freeman et al. (2017) |
| Galaxy | beam size, PA | beam | CN sensitivity | CO sensitivity | CN mom0 | CO mom0 | |
|---|---|---|---|---|---|---|---|
| … | (, degrees) | (kpc) | (km s-1) | (mJy beam-1) | (mJy beam-1) | cut () | multiplier11footnotemark: 1 |
| AM 2055-425 | 1.5x1.2, 45 | 1.2x1.0 | 20 | 1.9 | 2.3 | 2 | 15 |
| AM 2246-490 | 1.45x1.30, 0 | 1.3x1.2 | 20 | 1.9 | 2.4 | 2 | 6 |
| NGC 3256 | 3.2x2.1, 5 | 0.67x0.44 | 20 | 1.0 | 1.3 | 3 | 20 |
| VV 114 | 5.5x3.1, -80 | 2.1x1.2 | 30 | 1.1 | 1.3 | 3 | 30 |
| AM 1300-233 | 2.5x1.3, -76 | 1.1x0.6 | 40 | 1.2 | 1.2 | 3 | 20 |
| NGC 253 | 4x3, -34 | 0.068x0.051 | 5 | 4.7 | 5.2 | 3 | 20 |
| M83 | 2.1x2.1, 0 | 0.052x0.052 | 10 | 4.0 | 6.9 | 2 | 20 |
| NGC 1377 | 1.7x1.25, -87 | 0.19x0.15 | 20 | 1.2 | 1.7 | 2 | 30 |
The factor by which the CN rms noise was multiplied
to obtain the cutoff used to make the CO moment maps. For example, for
AM 2055-425, the
CN moment 0 map was made with a cutoff of mJy
beam-1 while the CO moment 0 map was made with a cutoff of
mJy beam-1. See §2 for
more details.
2.1 The ALMA Cycle 0 CN galaxy sample
For this archival ALMA project, we focused on Cycle 0 data, which were the majority of the public ALMA data at the time we began the project. Cycle 0 data have the additional advantage that calibrated uv data sets are available through the ALMA archive, thus removing the need to reapply the calibration to the raw uv data. This recalibration step can be time consuming and require powerful computers with plenty of disk space, particularly for data taken before the introduction of the ALMA calibration pipeline or for data that cannot be calibrated using the pipeline.
The first step was to manually inspect the titles and, when necessary, the abstracts of all one hundred Cycle 0 projects to identify those targeting nearby () extragalactic sources. The ALMA Science Archive query tool was then used to confirm which of these extragalactic projects observed the CO transition. We identified a total of 6 suitable projects (Table 1): 5 projects observed a single galaxy while the 6th project observed 20 galaxies and detected CO emission in 14 of them (Ueda et al., 2014). Two of these galaxies (NGC 7135, AM 1158-333) had sufficiently weak CO emission (signal-to-noise (S/N) ratio of , Ueda et al., 2014) that it was clear that CN would not be detected and were dropped from any further analysis.
Calibrated uv data and initial image cubes were downloaded from the ALMA Science Archive in March 2014. M83 and NGC 253 were observed using mosaics, while the other galaxies were observed with single ALMA pointings. After making a preliminary image of the CN line in VV 114 to get an idea of the typical CO/CN ratio, we then inspected the CO and CN data cubes for each of the 17 galaxies to measure the S/N ratio at the peak of the CO emission and to look for CN emission with S/N . 8 galaxies showed significant CN emission across more than one velocity channel. These galaxies comprise the ALMA Cycle 0 CN galaxy sample and are listed in Table 2. The remaining galaxies were not detected in CN or, in the case of NGC 7252, have only a marginal CN detection in a single velocity channel and are discussed in Appendix B.
2.2 Initial data processing
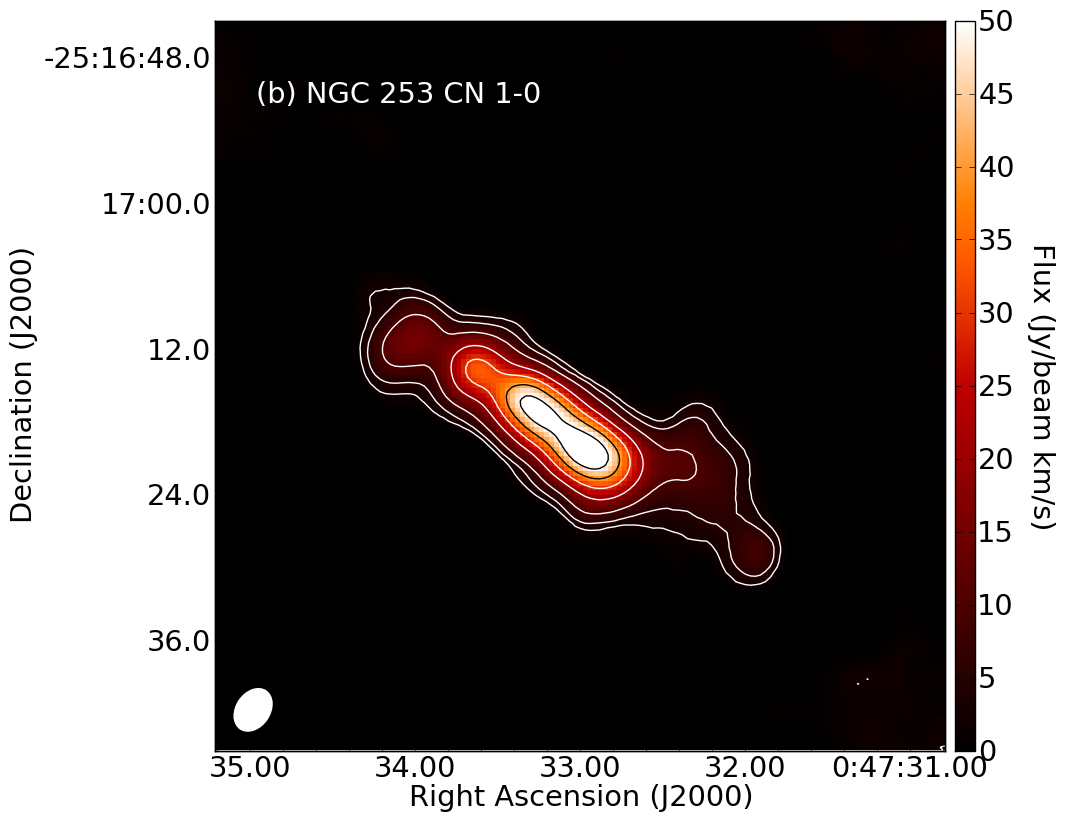
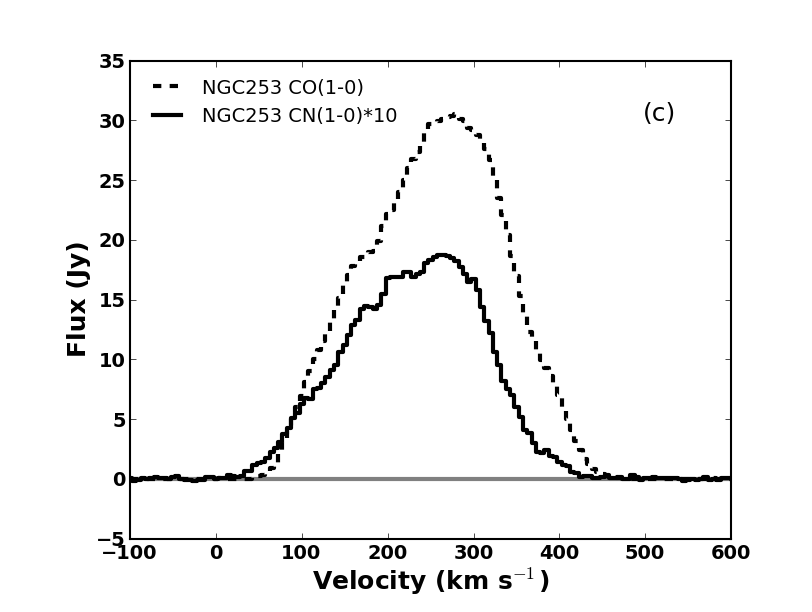
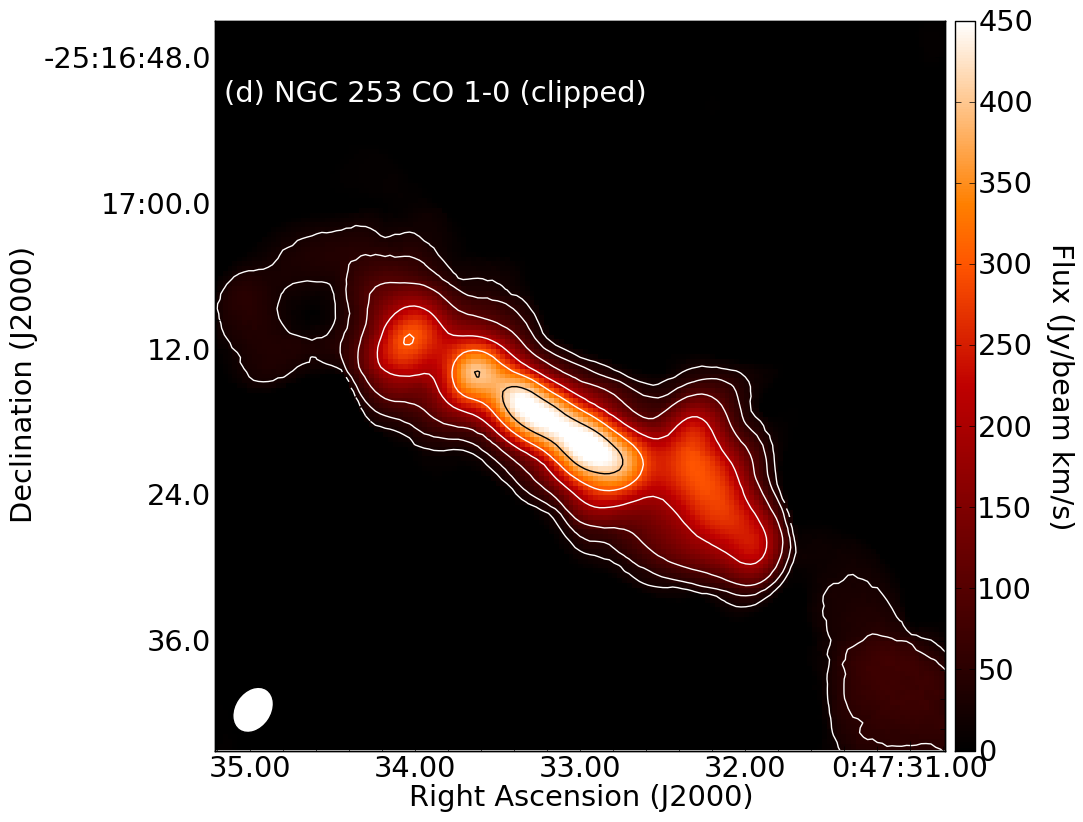
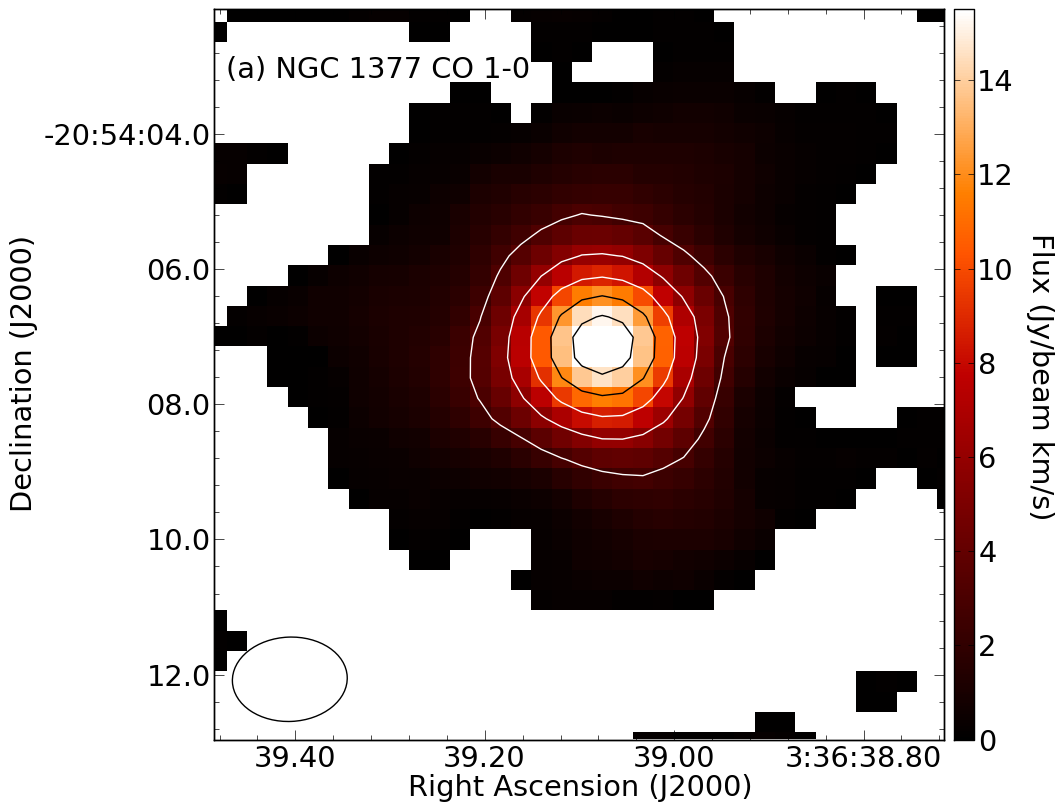
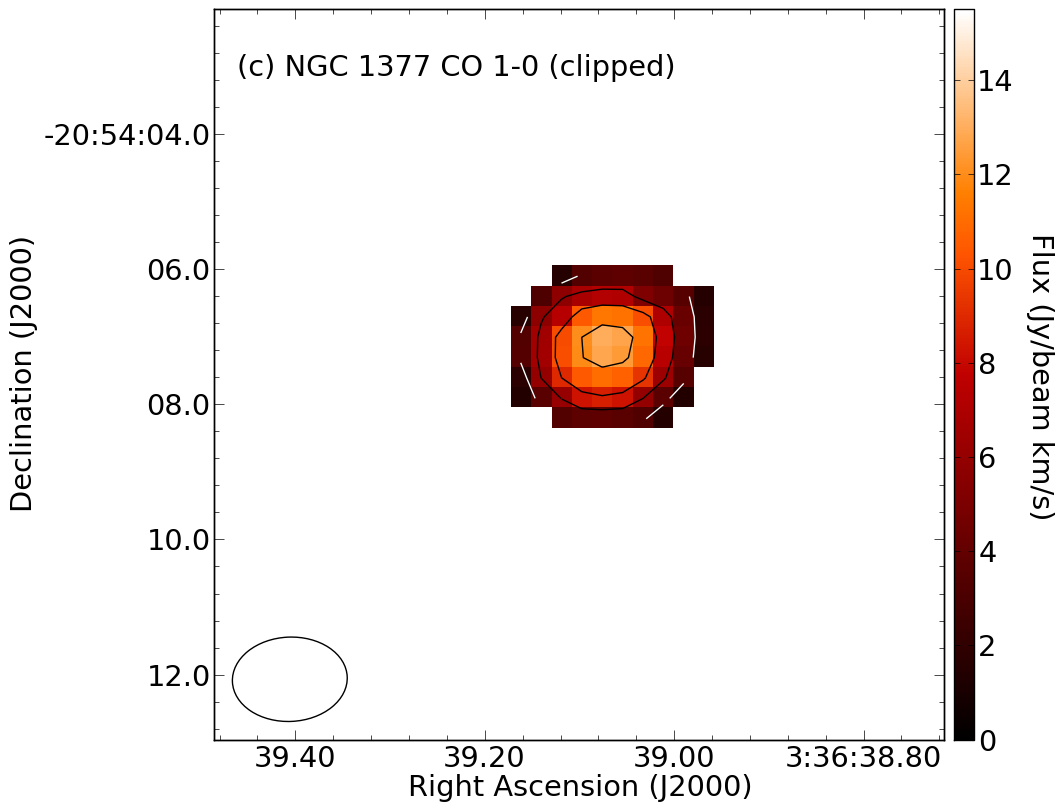
Continuum subtraction was performed for all the galaxies in the ALMA Cycle 0 CN sample except NGC 1377. Cleaned data cubes of the CO and the CN 113.4910 GHz emission were made for all 8 galaxies. The clean box was defined by inspecting emission channel by channel for each line. For VV 114, which was imaged in both the compact and extended configurations, we use only the compact data as we judged that their higher surface brightness sensivitity would make it easier to detect the weak CN lines. CO and CN data cubes for NGC 253 were kindly provided by A. Bolatto, while a cleaned CO data cube for VV 114 was kindly provided by K. Sliwa.
For each galaxy, the velocity ranges with strong CO emission were inspected to search for emission in the CN line. The presence of hyperfine structure around the CN line makes it difficult to measure the CO/CN ratio as a function of velocity without additional spectral processing. For example, the very high signal-to-noise ratio in NGC 253 means the CN line actually appears more extended in velocity space than the CO emission. This is due to the 21 MHz ( km s-1) spread in the CN hyperfine structure around the strongest component of the line. Therefore, although the spectral cubes were used for initial inspection of the data, the primary analysis of the CO/CN line ratio was done using integrated intensity maps. Before making the integrated intensity (moment 0) maps, a small spatial smoothing was applied to each of the CO and CN data cubes to match the beam size and shape (Table 2).
2.3 Measuring the CO/CN ratio
In all the galaxies studied here, the CO emission is much stronger than the CN emission. As a result, the CO data cubes can pick up much more extended emission, both spatially and spectrally, than the CN data cubes can. This mis-match in sensitivity poses a challenge for determining the CO/CN ratio accurately. For example, in AM 2055-425, the CO/CN ratio in individual channels in the cube can be as low as 10, while the global ratio measured from integrated intensity maps approaches 50. Although there is clear evidence that the CO/CN ratio can vary from place to place within a galaxy (Meier et al., 2015), it seems likely that significant variations in this line ratio can also be caused by the different signal-to-noise (S/N) ratios in the two lines.
Consider the simple case of a compact (point-like) galaxy with a true CO/CN ratio of 10. CN emission would then be detected with a S/N only in those velocity channels where CO had a S/N . However, CO would be detected with a S/N in many more velocity channels. This would result in the measured CN luminosity being an underestimate of the true CN luminosity, which would result in a measured CO/CN ratio larger than the true value of 10. However, if we measured the CO luminosity only from those channels where the CO S/N was , then we would recover the true CO/CN ratio of 10. Therefore, we adopt the following method to measure the CO/CN line ratio.
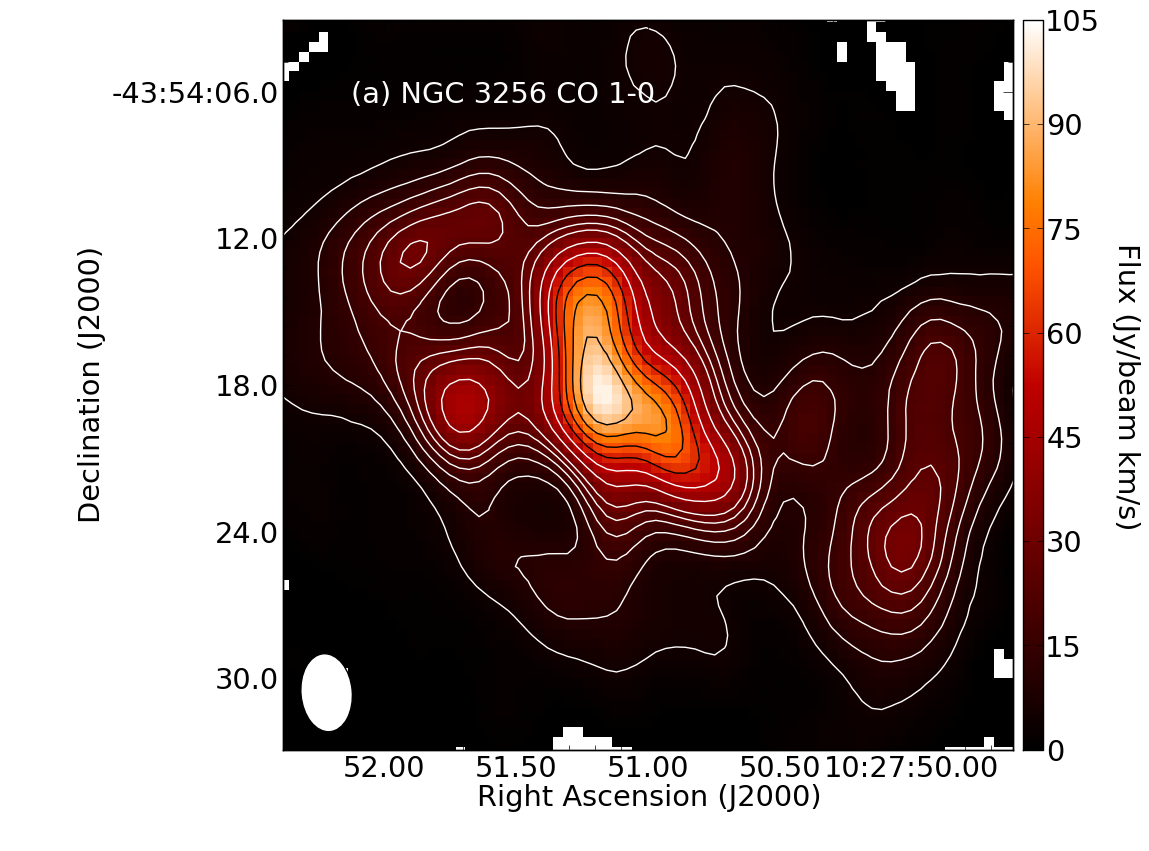
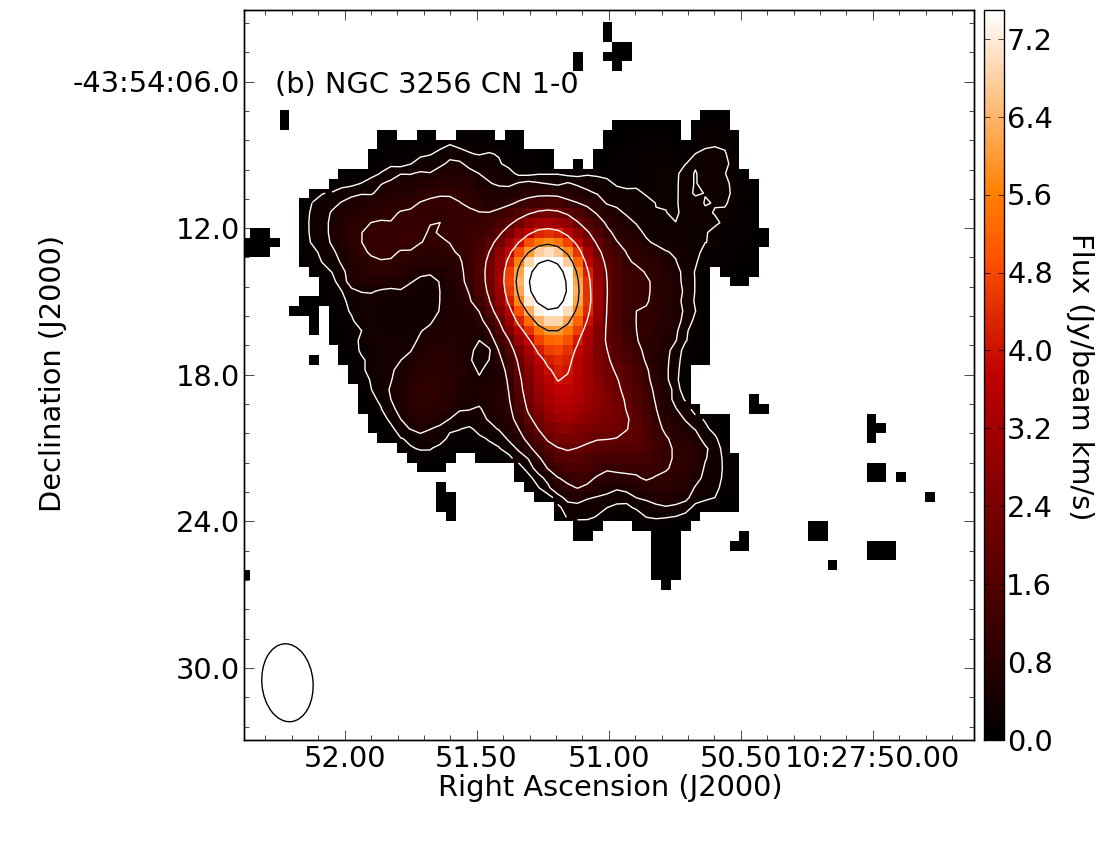
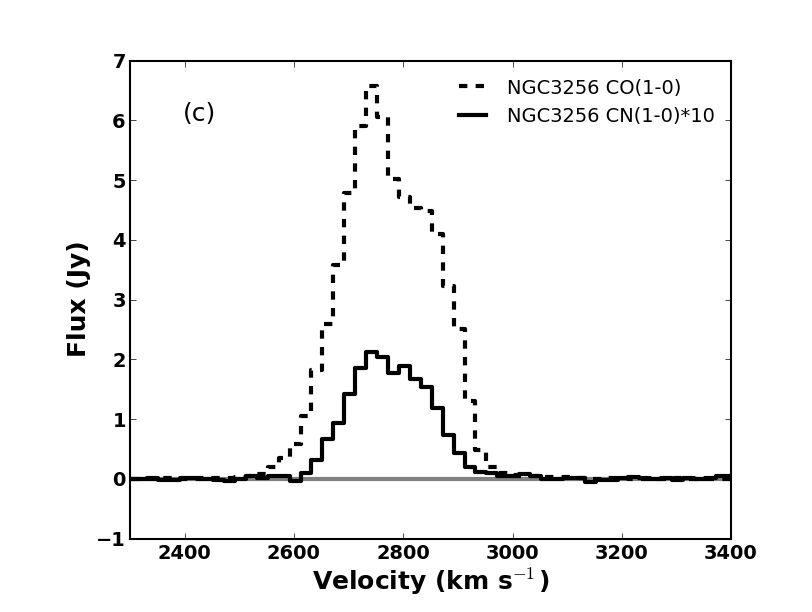
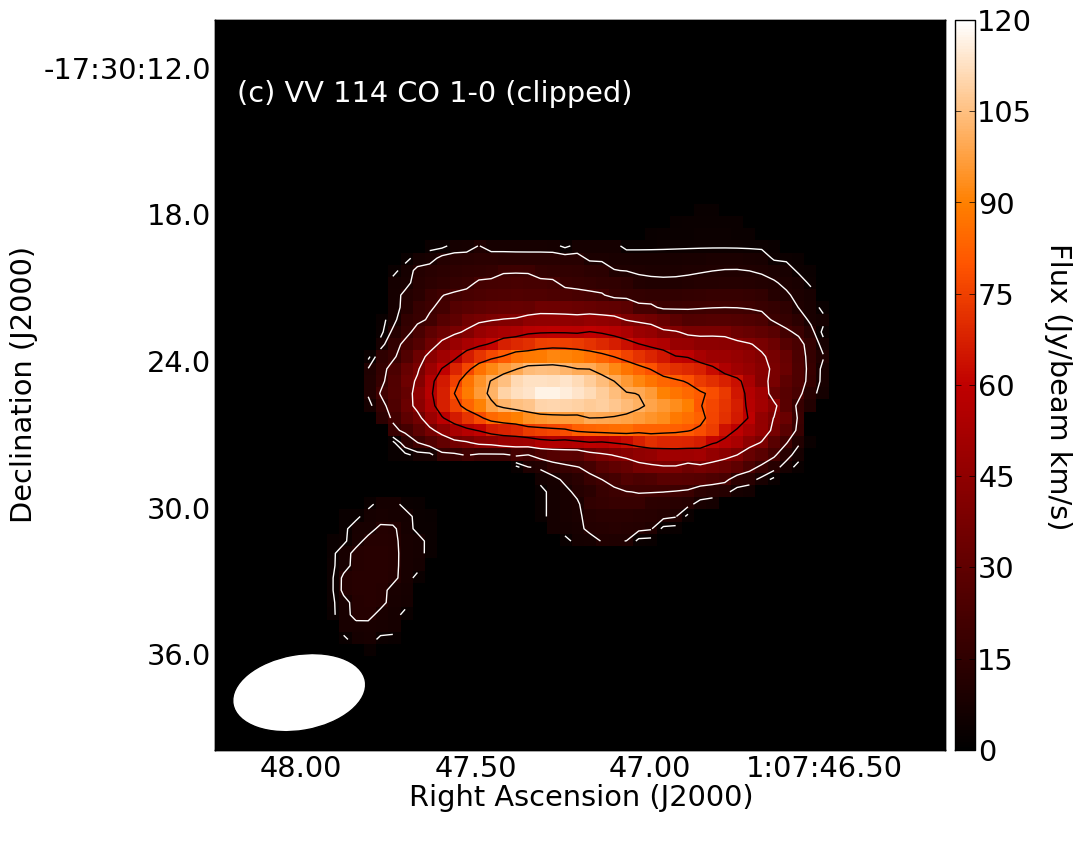
An integrated intensity map was made for each line using a cutoff and including only those velocity channels in which sufficiently strong emission was seen (Fig. 1). An initial image of the ratio of the two integrated intensity maps was made using a mask made from a clipped CN map. For the galaxies with the strongest emission, the CN map was clipped at a level equivalent to 3 emission times two velocity channels, while a clip of 2 times two velocity channel was used for the weaker galaxies (Table 2).
The procedure used to obtain a signal-to-noise matched (S/N-matched) measure of the CO/CN line ratio involved iterating on the signal-to-noise cutoff used in making the CO integrated intensity map. An initial mean CO/CN ratio, , was estimated from the first ratio map. To match the signal-to-noise ratio in the two lines, a second CO integrated intensity map was made, but this time using a cutoff equal to and using the same velocity channels used to make the CN integrated intensity map. A new ratio map was made as before using the second CO moment map, and the mean CO/CN ratio was remeasured, giving a new ratio . This process was repeated 2-3 times until the value of used in making the CO moment map was reasonably close to the value of measured from the resulting moment map ratio, at which point the process was deemed to have converged (Fig. 1). Finally, CO and CN fluxes were measured from the two final moment 0 maps after applying the same mask used in the ratio map. The S/N-matched CO/CN line ratio is given by the ratio of these two fluxes.
We illustrate this technique for one of the galaxies in our sample, AM 2246-490. The initial CO/CN ratio map showed values around 10 in the centre of the map. A new CO moment 0 map was made with a flux cutoff of ; however, the new CO/CN ratio map showed much lower values with a mean of around 2. A third CO moment map was made using a flux cutoff of , which gave CO/CN ratio map with a mean of around 7. A final CO moment map was made using a flux cutoff of , which also gave CO/CN ratio map with a mean of around 7. The flux-weighted CO/CN ratio for this galaxy was then measured to be (see Table 3). We note that the agreement between the flux-weighted CO/CN ratio and the value measured from the ratio of the moment 0 maps is not always as good as for AM 2246-490.
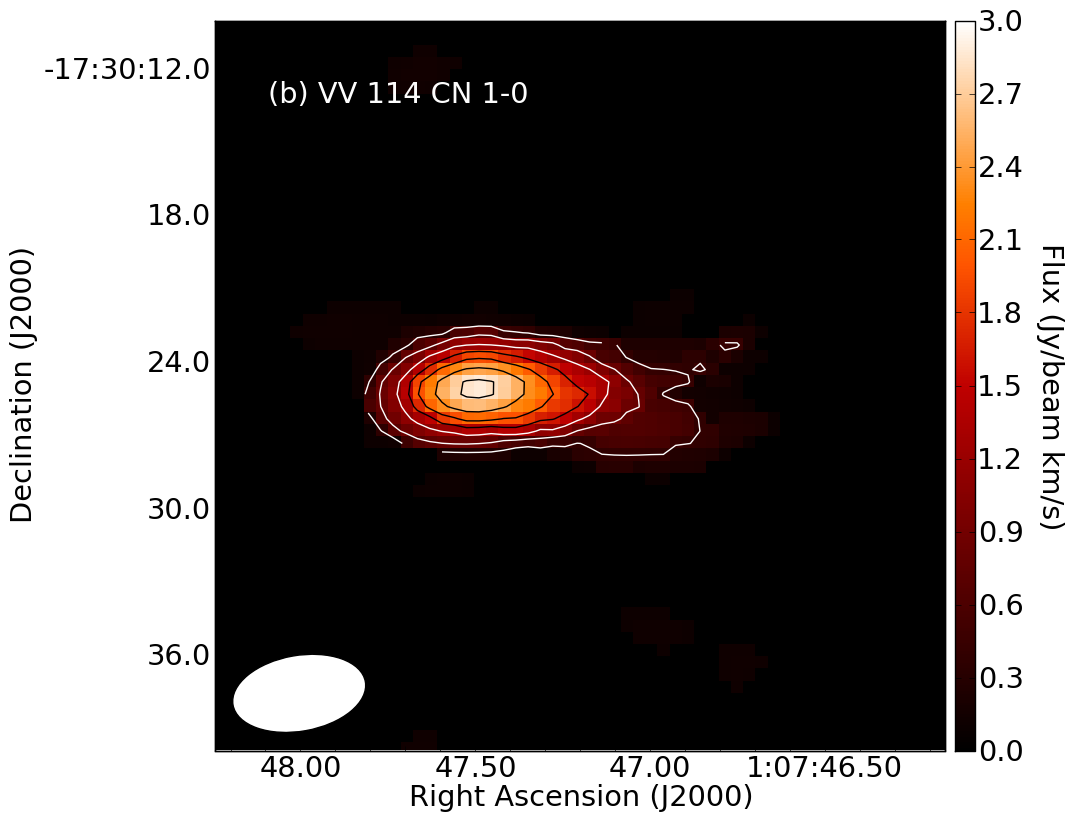
The S/N-matched CO/CN ratios as well as the global ratios measured from integrating the emission over the two initial integrated intensity maps are given in Table 3. Some notes on the individual galaxies are given in Appendix A. VV114 is a particularly tricky case given the large variation in the CO/CN line ratio across the source. Images of the line ratio tuned for each of the two bright regions are shown in Fig. 2.
| Galaxy | CO/CN S/N- | CO/CN | 11footnotemark: 122footnotemark: 2 | 11footnotemark: 122footnotemark: 2 | 33footnotemark: 3 | 44footnotemark: 4 | Notes |
|---|---|---|---|---|---|---|---|
| matched ratio11footnotemark: 1 | global ratio11footnotemark: 1 | (Jy km s-1) | (Jy km s-1) | (Mpc) | () | ||
| AM 2055-425 | 49 | 186 | 12.06 | ULIRG, AGN; Fig. 5 | |||
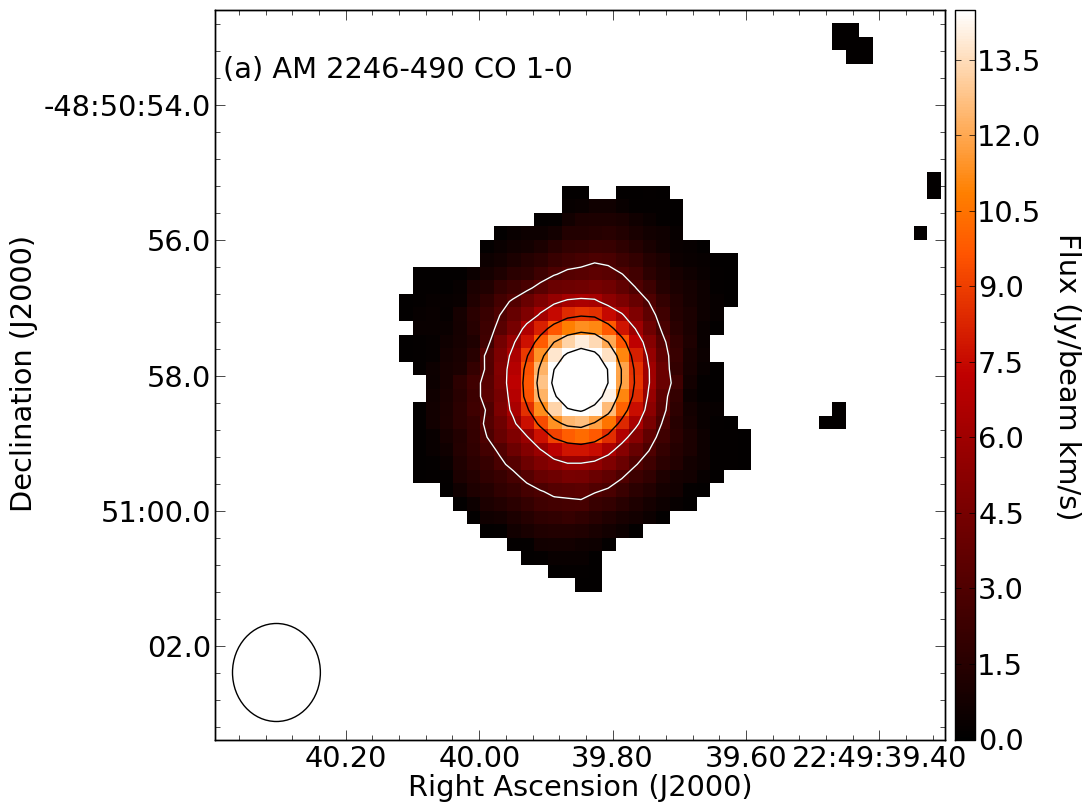
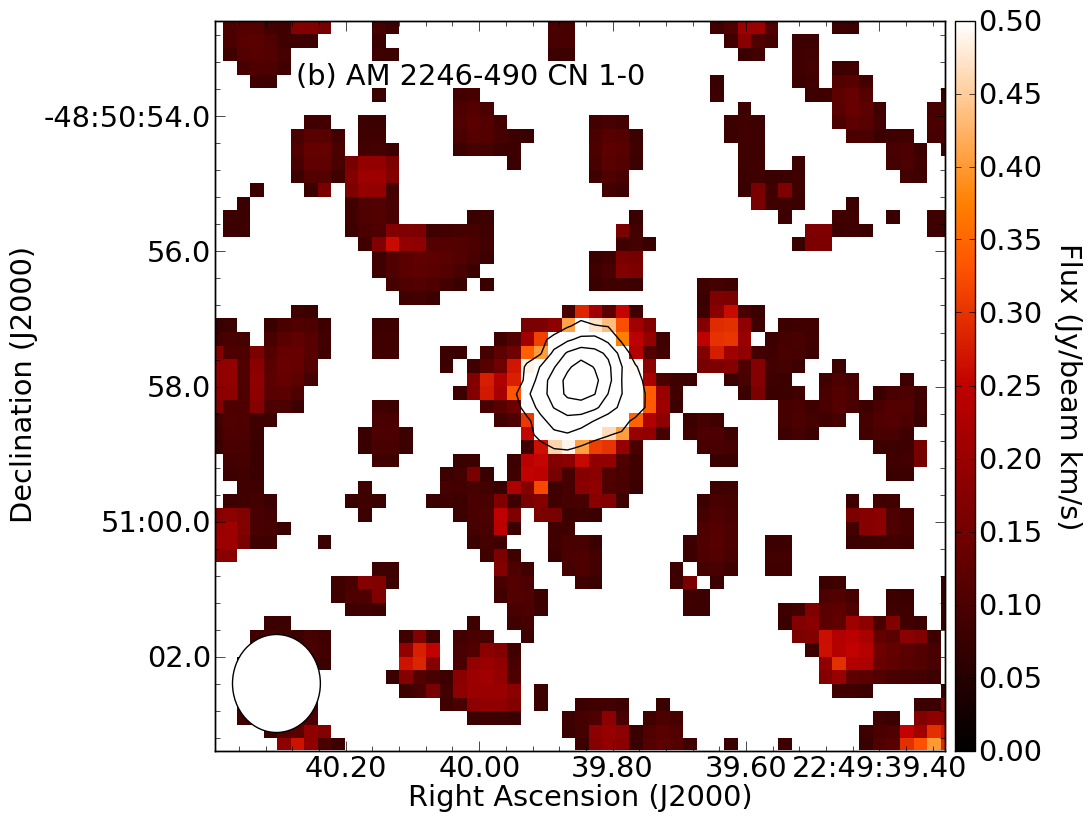
| AM 2246-490 | 34 | 186 | 11.86 | LIRG; Fig. 6 | |||
| NGC 3256 | 22 | 44 | 1646 | 36 | 44 | 11.81 | LIRG with an AGN; Fig. 1 |
| VV 114 | 65 | 147 | 613 | 4.0 | 82 | 11.69 | LIRG with an AGN; Figs. 2, 10 |
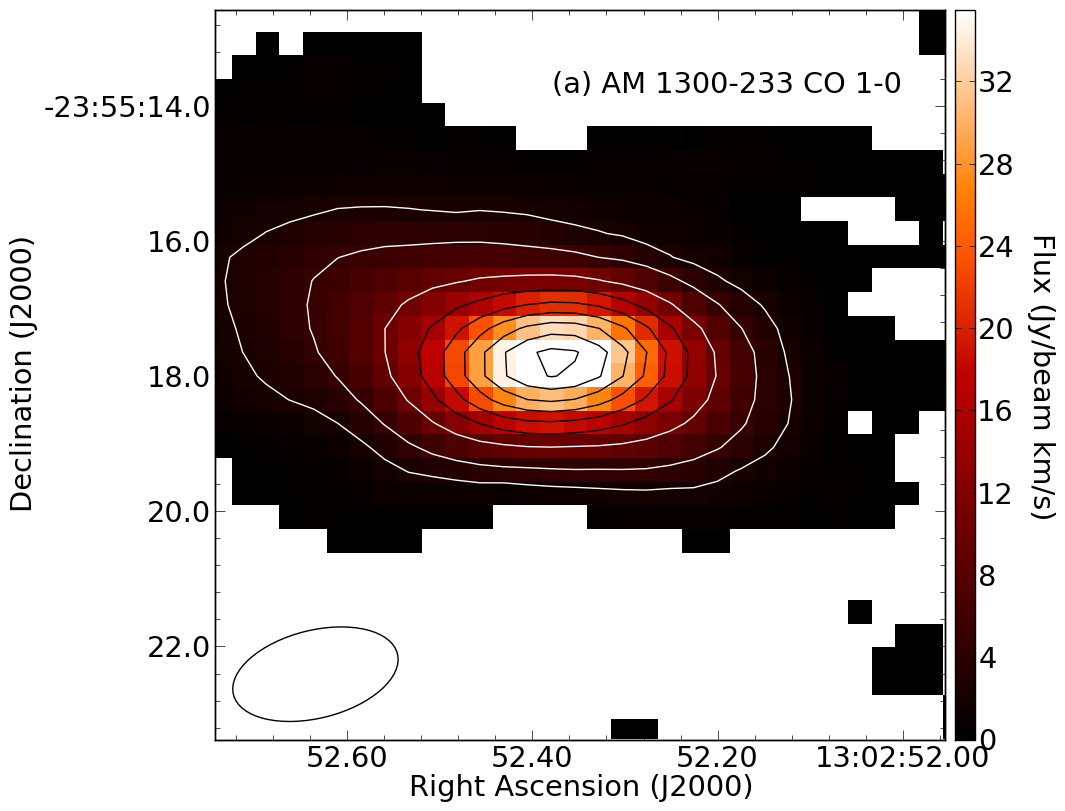
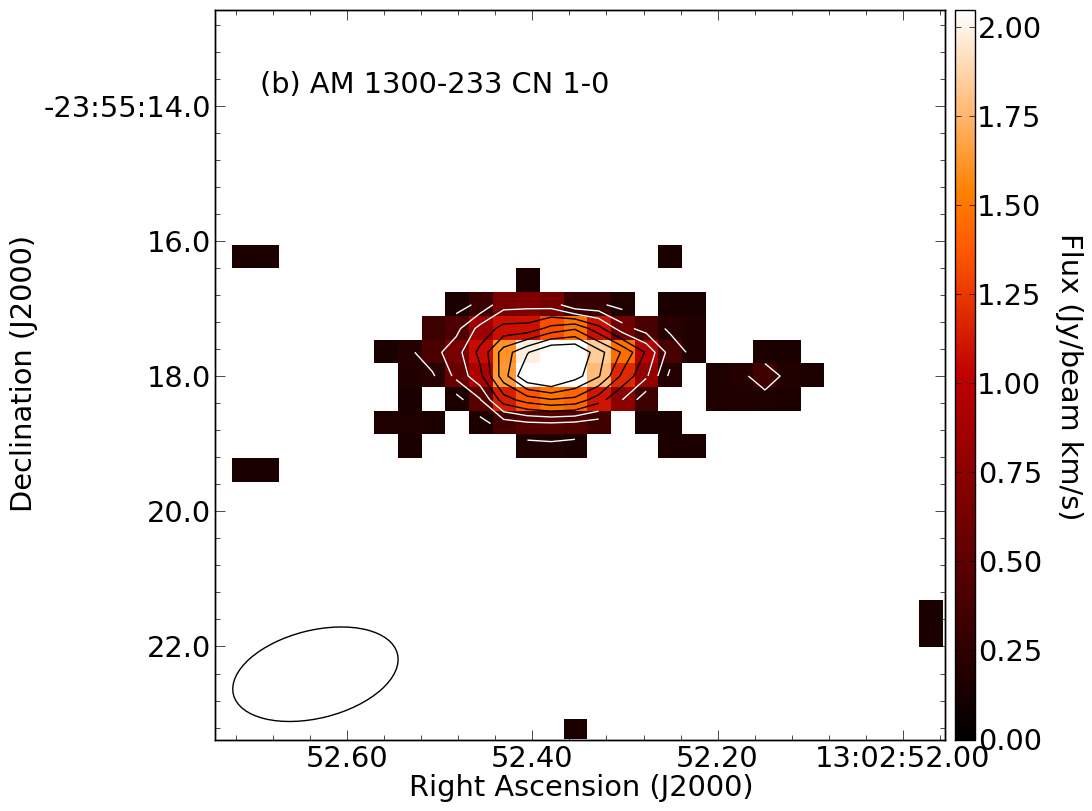
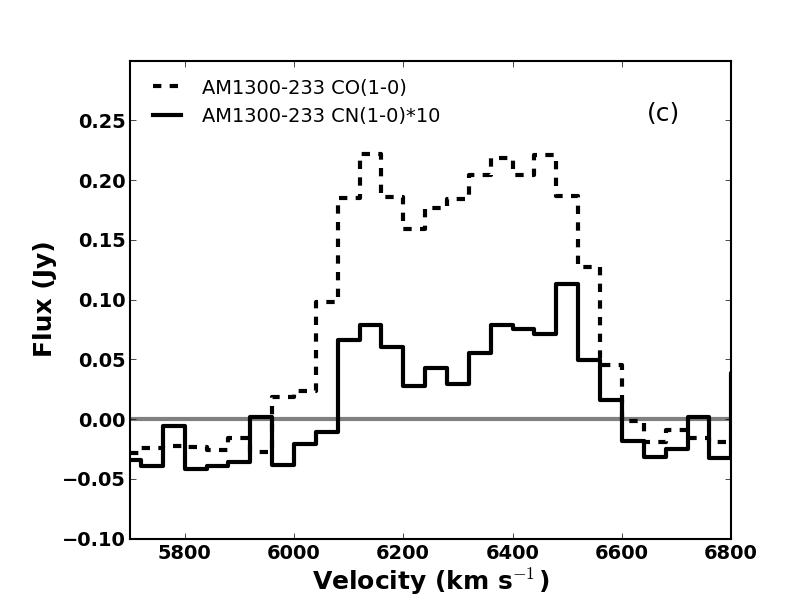
| AM 1300-233 | 89 | 98 | 11.51 | LIRG; Fig. 4 | |||
| NGC 253 | 16 | 20 | 8575 | 421 | 3.5 | 10.55 | starburst; Figs. 3, 10 |
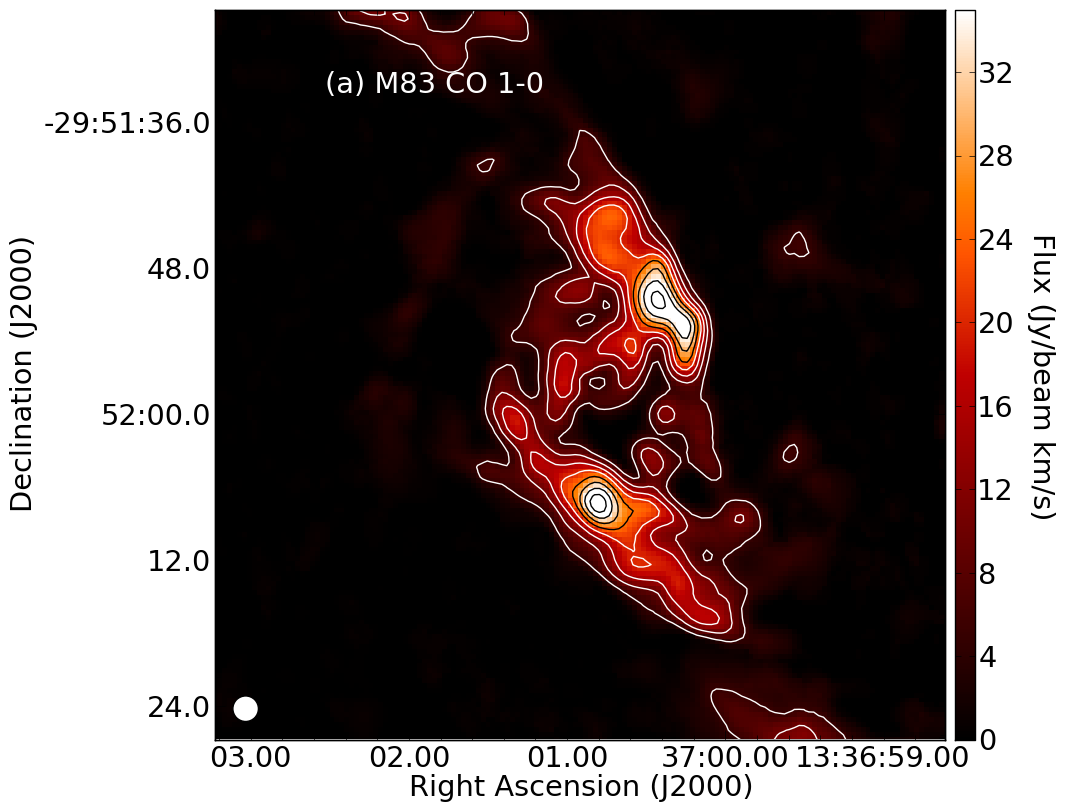
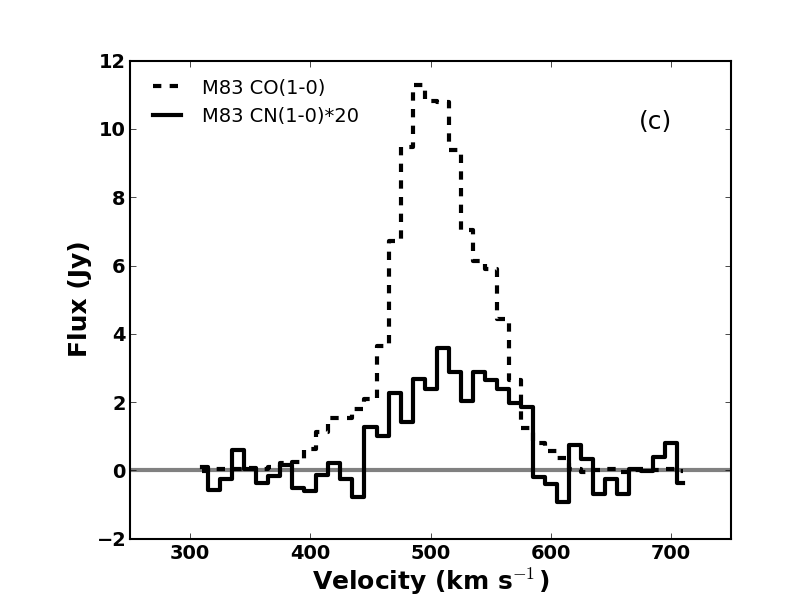
| M83 | 979 | 4.7 | 10.33 | starburst; Figs. 3, 7 | |||
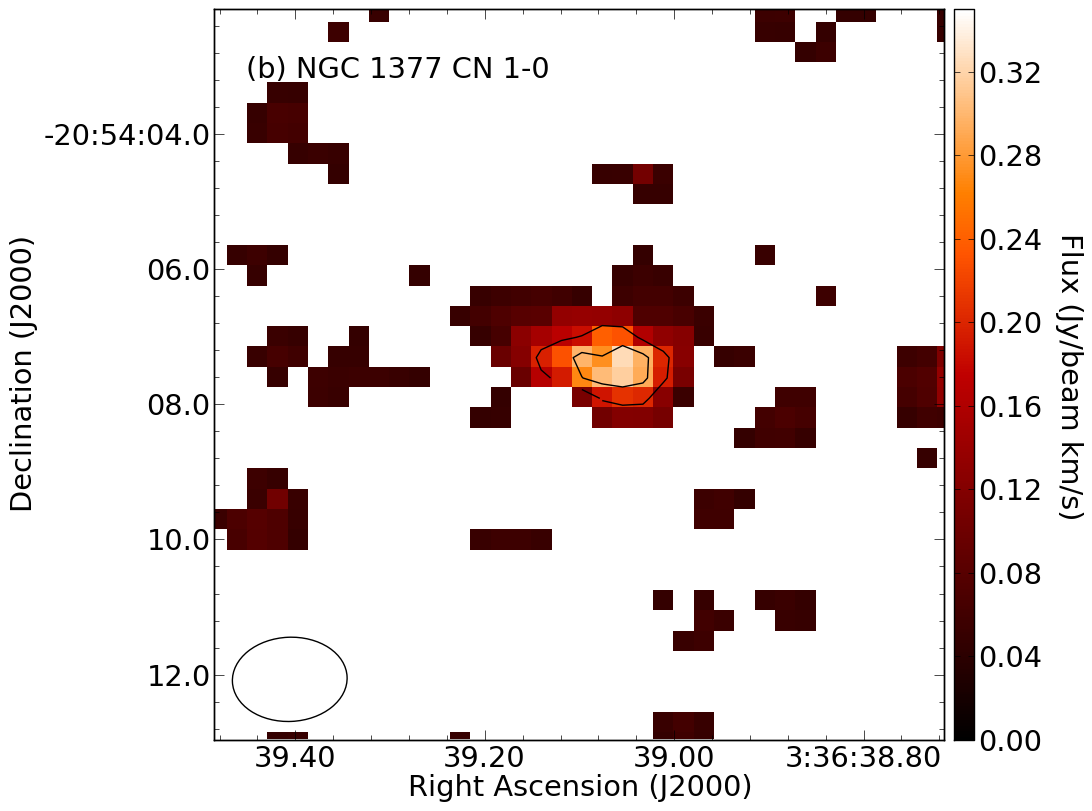
| NGC 1377 | 24 | 10.13 | lenticular, AGN, FIR excess; Fig. 9 |
Calculated uncertainties are given for individual
galaxies where
the measurement uncertainty on the weak CN emission is the dominant
uncertainty. For galaxies with strong emission, the uncertainty
is due to the exact placement of the measurement apertures and is
estimated to be at least 5%.
22footnotemark: 2 Global CO fluxes measured from ALMA data except for
NGC 253 and M83, for which the ALMA maps cover only a portion of the
galaxy. For both galaxies, CO and CN fluxes were measured in a 30′′ diametre aperture
centred on the central starburst.
33footnotemark: 3NGC 253 distance from Radburn-Smith
et al. (2011); M83
distance averaged from Radburn-Smith
et al. (2011) and Saha et al. (2006);
remaining
galaxies from redshift and NED adopting WMAP 5-year cosmology
( km s-1 Mpc-1, , ).
44footnotemark: 4Infrared luminosities from Sanders et al. (2003)
adjusted to luminosity distance given here.


3 Large variations in CO/CN within and between galaxies
3.1 Observed variations in the CO/CN line ratio
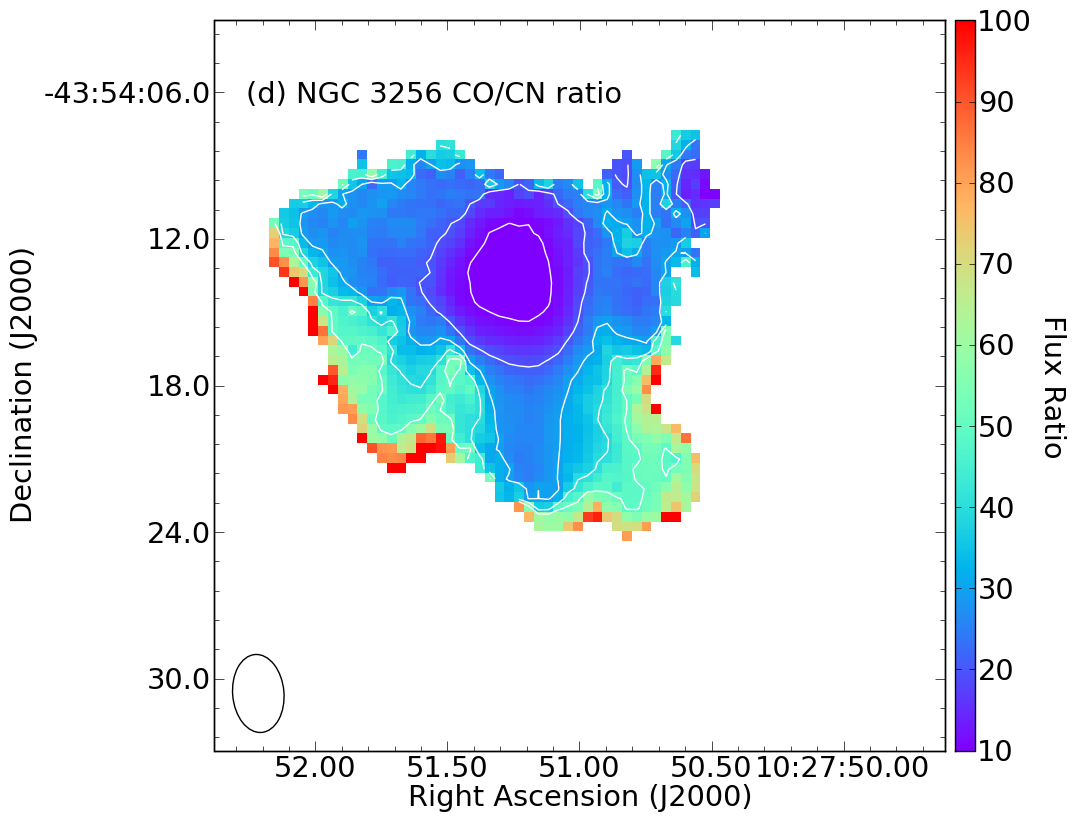
In total, CN emission is detected in 8 galaxies: 5 U/LIRGs, 2 nearby starburst spirals, and 1 S0 galaxy. There is clearly a wide range of morphologies and line ratios in this sample (Table 3), even for galaxies that might otherwise be expected to be quite similar. Three of the galaxies (VV 114, NGC 3256, AM 1300-233) are mergers or merger remnants with and distances that are similar to within a factor of . The two more luminous galaxies, NGC 3256 (Fig. 1) and VV 114 (Fig. 2, 10) show spatially extended emission with varying CO/CN line ratios, while AM 1300-233 (Fig. 4) shows compact emission in both lines. Interestingly, the CO/CN line ratios are a factor of two smaller overall in NGC 3256 than in VV 114. NGC 3256 is closer than VV 114 and has been observed with a factor of 3 higher spatial resolution (Table 2). However, averaging over a similar spatial extent as in the VV 114 maps gives CO/CN line ratios in NGC 3256 of 14 in the northern minimum, which includes the northern nucleus (Neff et al., 2003), and 36 in the south-west bright peak, near the southern nucleus. Thus, even at similar spatial resolution, NGC 3256 has CO/CN line ratios that are a factor of 2 lower than those in VV114.
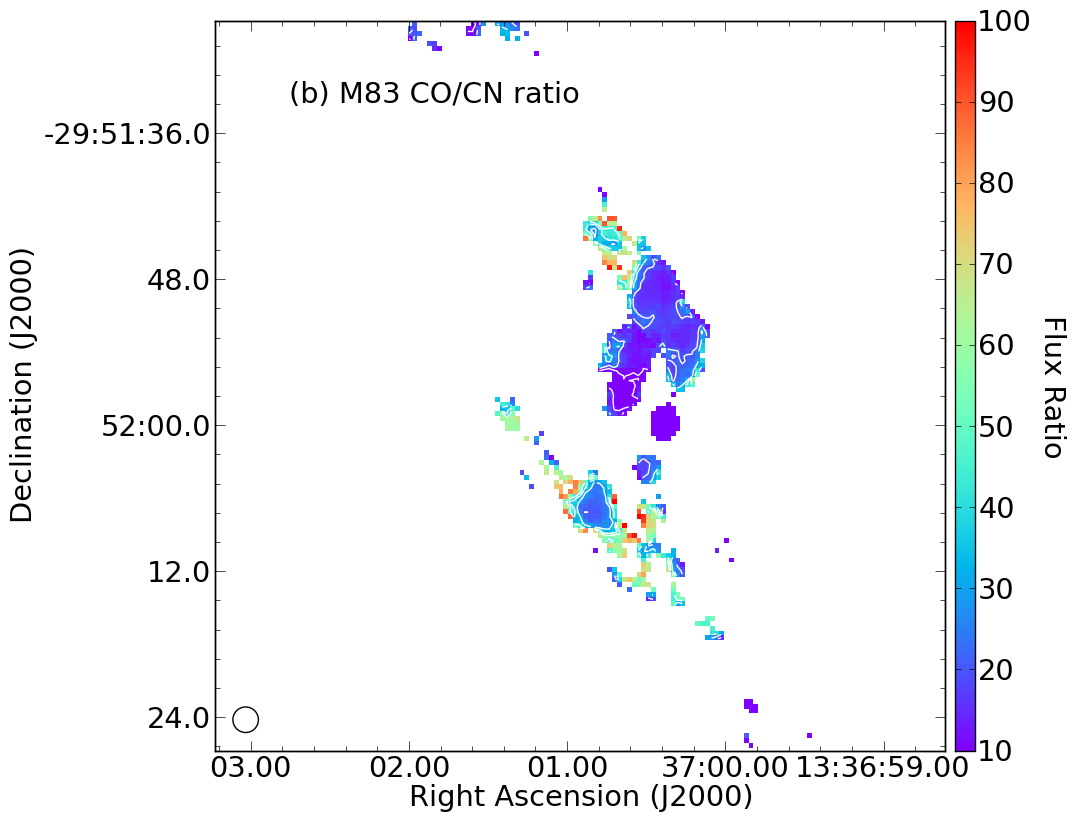
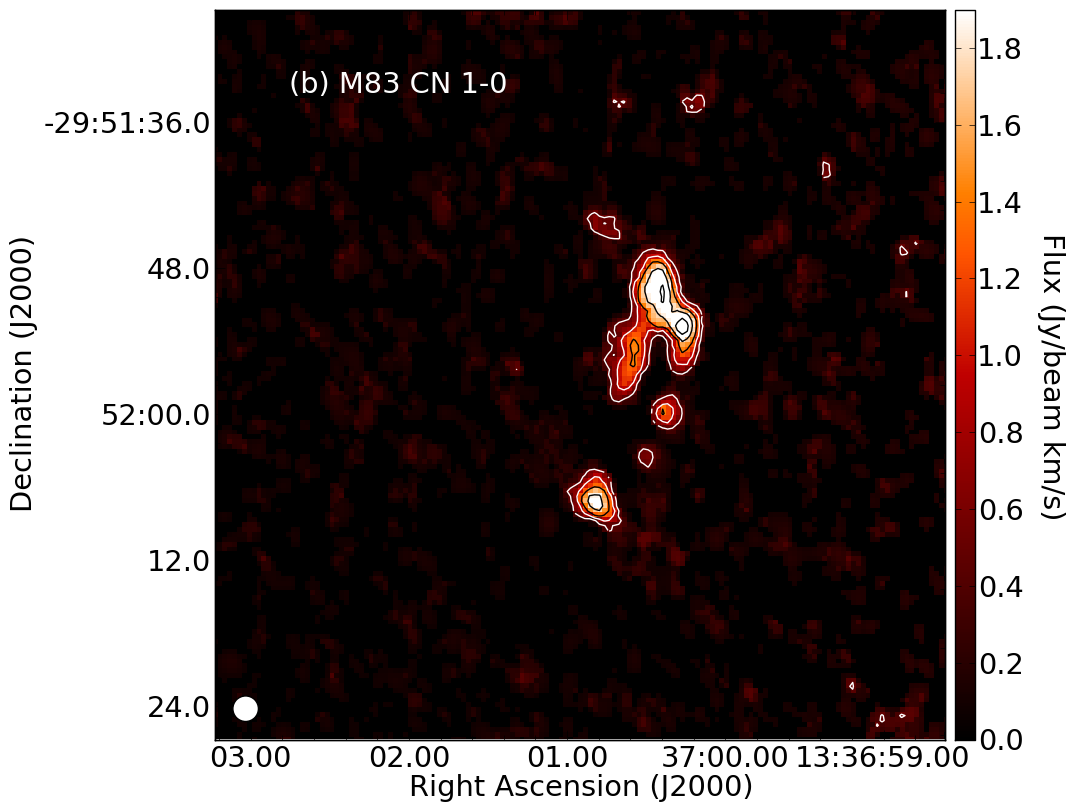
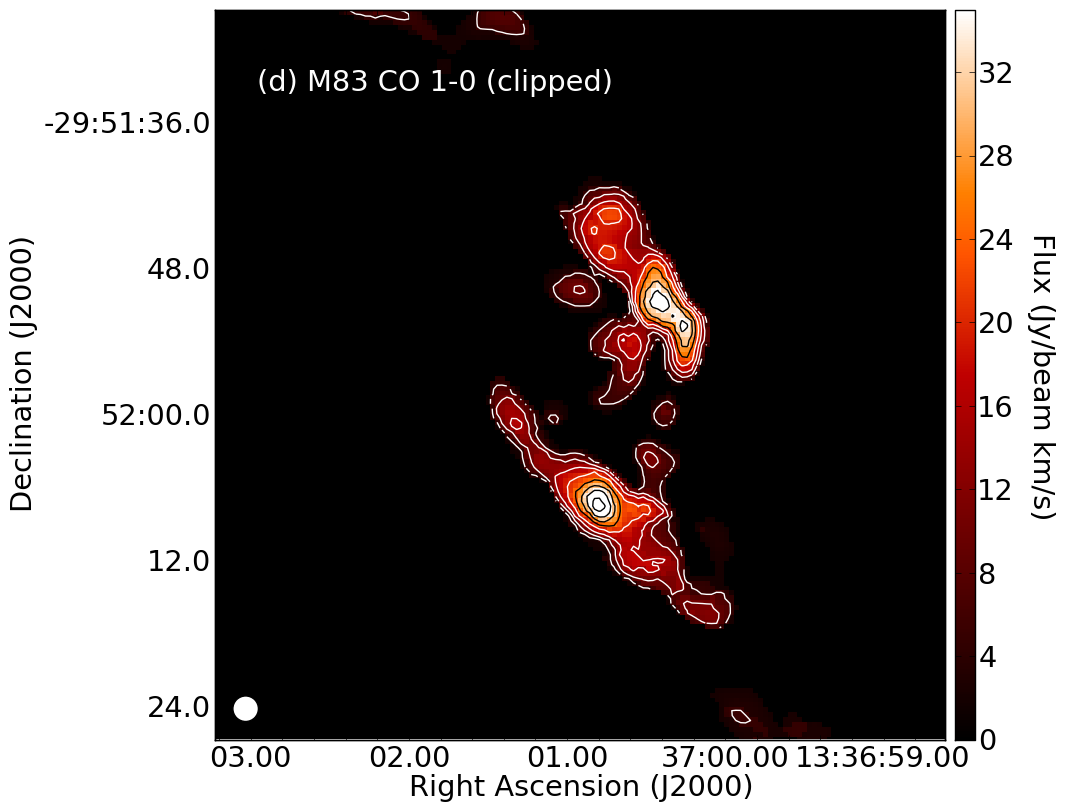
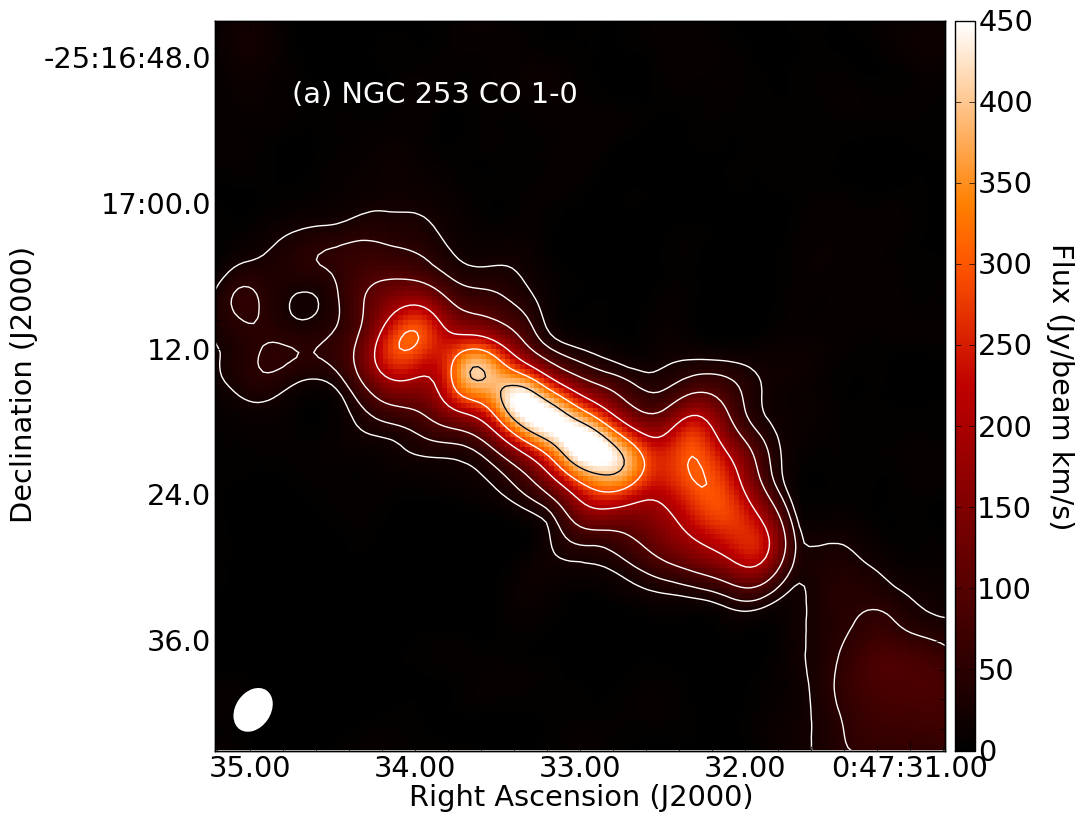
AM 2055-425, AM 2246-490, and NGC 1377 show very compact CN emission similar to that of AM 1300-233 (Figs. 5, 6, and 9). Two of these galaxies have S/N-matched CO/CN line ratios of 13-14, while NGC 1377 has a significantly larger line ratio of 40 and AM 2246-490 has a line ratio of 7, the smallest line ratio in the entire sample. The two very nearby galaxies, NGC 253 and M83, both show spatially extended CO and CN emission (Figs. 3, 8, and 7). The emission in NGC 253 nearly fills the field of view, while the emission in M83 breaks up into distinct clouds. Although some of this difference may be due to their different inclinations (edge-on versus close to face-on), the majority is likely due to the factor of 5 higher CO intensity in the centre of NGC 253 compared to M83 (Young et al., 1995).
The spatial resolution of these data sets ranges from 50 pc in M83 to 2.1 kpc in VV 114. There are significant spatial variations in the CO/CN line ratio in NGC 253 and M83, the two closest galaxies. Fig. 3 shows that CO/CN line ratios as small as 10 are observed in the central starburst in each galaxy, with ratios rising to 20-30 over a larger area. To attempt to match the measurements for the more distant galaxies, the CO/CN line ratios reported in Table 3 are measured over a 30′′ (0.5-0.7 kpc) diametre aperture. For NGC 1377, we made test images applying a strong taper to the uv-data, which gave a beam of pc, similar to that of NGC 3256. The global and S/N-matched CO/CN line ratios measured from this lower resolution map agreed extremely well with the values in Table 3. Thus, we feel that the higher spatial resolution obtained for M83, NGC 253, and NGC 1377 is not biasing the measured CO/CN line ratios in a significant way.
3.2 Why does CN vary? Abundance versus excitation
Even in the galaxies with the highest signal-to-noise measurements of the CN line, the CO/CN line ratio varies considerably, both from place to place inside a single galaxy and from one galaxy to another. Spatially resolved line ratios range from in NGC 3256 and NGC 253 to in VV114. The primary question is whether variations in the line ratio are due to changes in the abundance or changes in excitation, and also which molecule (CN or CO) is primarily responsible for the observed changes. An additional complication is that changes in the optical depth of CN or CO (due to differences in the H2 column density in different regions and galaxies) could produce changes in the observed line ratio as well. We address each of these possibilities below, focusing primarily on the three brightest galaxies, NGC 3256, VV 114, and NGC 253.
3.2.1 Optical depth and the CO-to-H2 conversion factor
Previous analyses of the CN emission for NGC 3256 (Sakamoto et al., 2014), VV 114 (Saito et al., 2015), and NGC 253 (Meier et al., 2015) all showed that the CN lines are optically thin. In NGC 253, the ratio of strong/weak CN line ranges from values of consistent with optically thin emission in LTE up to values of 3-5 that are consistent with LTE at the 2 level calculated from Meier et al. (2015). In VV 114, the CN line emission in the eastern nucleus is also consistent with optically thin emission (Saito et al., 2015). Thus, it seems unlikely that variations in the CN optical depth can be responsible for the spatial variations seen in the CO/CN line ratios.
In principle, variations in the optical depth of the CO line could produce changes in the CO/CN line ratio. The CO line is generally thought to be optically thick. For NGC 253, Meier et al. (2015) concluded from the ratio of the CO/C17O line ratio that the CO line is moderately optically thick (). In VV114, Sliwa et al. (2013) find an optical depth of in the CO line by fitting multiple lines of CO and 13CO. For NGC 3256, Sakamoto et al. (2014) conclude that the lowest 3 transtions of CO are likely to be optically thick and thermally excited.
Under these conditions, the CO integrated intensity is often used as a direct tracer of the H2 column density via the CO-to-H2 conversion factor (e.g. Bolatto et al., 2013a). If this conversion factor changes from galaxy to galaxy, or from place to place within a galaxy, it could play a role in the observed changes in the CO/CN line ratio. However, these three strong emission line galaxies are either starbursts (NGC 253) or LIRGS (NGC 3256, VV114) and so the lower CO-to-H2 conversion factor seen in galaxies with high star formation rates (Downes & Solomon, 1998) seems likely to be appropriate for these galaxies.
For the specific case of NGC 253, we can examine what effect would be produced by a changing CO-to-H2 conversion factor from the central starburst to the outer parts of the nuclear disk. The CO/CN map (Fig. 3) shows a ratio of 10 in the centre rising to perhaps 40 in the outer disk. If the CO-to-H2 conversion factor varied from the starburst value (0.8 pc-2) to the standard spiral value (3.2 pc-2) (Bolatto et al., 2013a) over the same region, this variation would strengthen the inferred radial variation in the H2/CN ratio, rather than weakening it. Meier et al. (2015) adopt a constant starburst conversion factor across the entire central region of NGC 253 and we will do the same in this analysis.
Similarly, the differences in the CO/CN line ratios between NGC 3256 and VV114 also seem unlikely to be due to changes in the CO emission. Rosenberg et al. (2015) investigate the CO spectral line energy distributions (SLEDs) for a number of LIRGs, including VV 114 and NGC 3256. The total luminosities of the CO J=4-3 to J=12-11 lines in the two galaxies agree to within 20%, suggesting the CO excitation in the warm molecular gas in the two galaxies is very similar. Table 3 shows that the CO luminosity in VV 114 measured from the ALMA map is roughly 30% larger than that in NGC 3256, but this difference in CO luminosity is not enough to account for the difference in the CO/CN line ratio on its own. Thus, we conclude that the effects of the CO optical depth cannot explain the changes in the CO/CN line ratio observed in these galaxies.
3.2.2 Excitation versus abundance for CN
For the optically thin CN line, the integrated intensity, , is proportional to , where is the column density of CN, is the energy of the upper state, and is the excitation temperature of the line (cf. Meier et al., 2015). The relatively low value of for the CN line (equivalent to 5.45 K) implies that under many conditions . However, the large critical density of this line (, Meier et al., 2015) means that the excitation temperature of CN may be lower than the kinetic temperature of the gas.
For this analysis, we assume that the CO line intensity is proportional to the H2 column density. Under this assumption, an increase in the CO/CN line ratio could be due to a decrease in the CN column density and hence in the average CN abundance relative to H2, [CN]/[H2]. Alternatively, an increased CO/CN line ratio could be due to an increase in the excitation temperature of the CN line. The excitation temperature is constrained to be less than or equal to the kinetic temperature of the gas, and thus a larger excitation temperature implies an increase in the kinetic temperature and/or the density of the molecular gas. We first discuss theoretical predictions for the CN abundance in PDRs and then discuss constraints on the CN excitation. We defer a discussion of the CN abundance in XDRs to § 3.3.
Boger & Sternberg (2005) have made detailed PDR models of the CN and HCN abundance for a variety of gas densities (), ultraviolet radiation fields (), and cosmic ray ionization rates. They use a plane parallel PDR code with updated rate coefficients for some key reactions and model the abundances and integrated column densities to a depth of ( cm-2). We discuss their results for as being most relevant to an ensemble of molecular clouds in a gas-rich starburst galaxy. In their models, the CN abundance () has a minimum at cm-3 and increases by a factor of 3 for densities of 106 cm-3 and by a factor of 10 for densities of 103 cm-3 (with the ionization parametre held constant). These same models show that the CN/HCN ratio increases by a factor of 30 for densities increasing from 104 cm-3 to 106 cm-3. Increasing the ionization parametre by a factor of produces a factor of 2 decrease in the CN abundance and a factor of 4 decrease in the CN/HCN ratio. Finally, an increase of a factor of 10 in the cosmic ray ionization rate increases the CN abundance by a factor of 10, the HCN abundance by a factor of 5 and the CN/HCN ratio by a factor of 3.
Meijerink et al. (2007) compare PDR and XDR models for a range of densities and radiation fields. Their PDR models include recombination reactions on polycyclic aromatic hydrocarbons (PAHs), which has the effect that the transition from C+ to C occurs at larger column densities (Meijerink & Spaans, 2005). In their PDR models, the CN/HCN column density ratio depends primarily on the gas density and decreases by a factor of 3 for densities increasing from 104 cm-3 to 106 cm-3. This is in the opposite sense to the trend in Boger & Sternberg (2005). Meijerink et al. (2011) explore the effect of increased cosmic ray heating on the HCN emission for two different values of the gas density and radiation field strength. At high densities ( cm-3), the models show an increase of a factor of 3 in the HCN abundance for an increase of a factor of in the cosmic ray ionization rate, while at low densities ( cm-3) a decrease by a factor of 4 is seen over the same change. These changes are generally smaller than the effect of cosmic rays seen in Boger & Sternberg (2005). Unfortunately, the CN abundance is not discussed in Meijerink et al. (2011) and the CN/ ratio is not shown in Meijerink et al. (2007), which limits the usefulness of these models for our current analysis.
Ginard et al. (2015) compare their high resolution observations of CN in M82 to a grid of models using the Meudon PDR code. They use a constant density ( cm-3) with 2 different values each for the ultraviolet radiation and cosmic ray ionization rate and 5 different cloud sizes with different central . They find that the CN abundance increases with increasing cosmic ray ionization rate, although not as strongly as in Boger & Sternberg (2005). Their models also show that the CN abundance increases slightly as the strength of the ultraviolet radiation field increases; in contrast, Boger & Sternberg (2005) saw a slight decrease with increasing radiation field.
These three sets of PDR models show that the abundance of CN can vary by factors of a few with changing density, ultraviolet radiation field, and cosmic ray ionization rate. For example, the models of Boger & Sternberg (2005) imply that the high CN abundance (low CO/CN ratio) in AM 2246-490 (as compared to AM1300-233 and AM 2055-425) could be produced by an increase in the cosmic ray ionization rate, a decrease in the ultraviolet radiation field, and/or either a high ( cm-3) or low ( cm-3) gas density. However, the three models do not always agree on the sense of the change that is expected, which makes it difficult to draw firm conclusions without observations of additional CN transitions. In addtion, only the models of Boger & Sternberg (2005) are able to produce an order of magnitude change in the CN abundance of the kind seen when comparing AM 2246-490 with the VV114 overlap region. Observations of HCN, for which the predicted trends also differ between the models, could be particularly helpful in constraining the parametres of the gas.
The CO/CN line ratios for the resolved and/or nearby galaxies in our sample cluster around values of in starburst regions (the centres of M83 and NGC 253 and the northern nucleus of NGC 3256). Somewhat larger values of 20-30 are seen in the extended disk emission of these 3 galaxies. The bright CO emission combined with a very high CO/CN ratio of in the overlap region in VV114 stands out as particularly unusual. (Although ratios this large are seen in the outskirts of NGC 3256 and to some extent in NGC 253, the CO intensity is much weaker in those regions.) This ratio is 4-6 times larger than the ratios measured in the starburst nuclei in our sample. If such a large CO/CN line ratio is due to a low CN abundance, it could be produced by a low cosmic ray ionization rate (Boger & Sternberg, 2005; Meijerink et al., 2007; Ginard et al., 2015), a high ultraviolet radiation field (Boger & Sternberg, 2005), a gas density of around cm-1 (Boger & Sternberg, 2005), or smaller clouds (Ginard et al., 2015).
An alternative explanation for the large CO/CN line ratio seen in VV114 is a high CN excitation temperature. High excitation temperatures typically require a high kinetic temperature, which can be produced by strong UV radiation fields (Meijerink et al., 2011), possibly combined with a high density. These conditions would imply a high local gas pressure, which suggests that measurements of the gas pressure might be a useful tool to distinguish between the effects of CN abundance and CN excitation. The CN line has a critical density that is fairly similar to that of the CO J=6-5 line. Although this CN line is only 5 K above ground (compared to 116 K for CO J=6-5), the astrochemical models suggest that CN will be found with high abundance in warm UV or X-ray irradiated gas. This comparison suggests that it is reasonable to consider constraints for the warm molecular gas derived from high J CO lines in interpreting the observed CN emission.
Kamenetzky et al. (2017) have modeled the global CO excitation from to J=13-12 for a sample of 87 galaxies. All of the galaxies discussed here except AM 2238-490 are included in their sample. The pressures of the cold gas for these 7 galaxies agree within their uncertainties, while there are significant variations in the pressure of the warm component, with NGC 1377 having a warm gas pressure that is nearly 2 orders of magnitude larger than the mean value. However, for VV114 and NGC 3256, they find very similar pressures in the warm molecular gas, although the uncertainty on the pressure in VV 114 is quite large. However, we need to be careful not to over-interpret these global similarities between the galaxies given the spatial variations in the CO/CN ratio seen in Figs 1 and 2. Spatially resolved observations of higher J rotational transitions of molecules with ALMA to measure the warm gas pressure as well as observations of higher frequency lines of CN would be very helpful in distinguishing between these different scenarios.
3.3 The role of AGN
An AGN will produce an X-ray dominated region which will alter the astrochemical balance compared to what is found in photon dominated regions (Meijerink et al., 2007). Imanishi et al. (2009) show that the HCN/HCO+ ratio can be enhanced in galaxies that show mid-infrared signatures of an AGN. The XDR models of Meijerink et al. (2007) show a strong decrease in CN/HCN with increasing density and much larger CN/HCN ratios overall compared to the PDR models. Four of the galaxies in our sample show evidence for an AGN and elevated CO/CN line ratios of around are seen in 3 of them: the southern nucleus of NGC 3256, the eastern nucleus of VV114, and NGC 1377.
NGC 1377 has been shown to contain a buried AGN (Costagliola et al., 2016) which is generating a jet as well as a slower molecular outflow (Aalto et al., 2016, 2017). It has a CO/HCN ratio of 4.4 and an HCN/HCO+ ratio (Imanishi et al., 2009), which suggests that the HCN emission is enhanced relative to both CO and HCO+. NGC 1377 has one of the largest S/N-matched CO/CN ratios in our sample (Table 3), suggesting a depletion of CN emission near the AGN that could be related to the enhancement of HCN.
The eastern nucleus of VV114 has been suggested to contain an AGN by Iono et al. (2013) and also shows the highest HCN/HCO+ line ratio in the entire system (Imanishi et al., 2007). The eastern nucleus has a similar CO/CN ratio (Fig. 2) to the ratio measured in NGC 1377. Note that the western nucleus of VV114 has only relatively weak CO emission (Saito et al., 2015) and is not detected in CN.
Sakamoto et al. (2014) identified molecular outflows from both of the nuclei in NGC 3256. They argue that the southern nucleus hosts a (possibly dormant) AGN based on differences in the outflow properties between the two nuclei. Ohyama et al. (2015) used infrared and X-ray data to identify a heavily absorbed, low luminosity AGN in the southern nucleus of NGC 3256. The area around the southern nucleus of NGC 3256 (Fig. 1) has a higher CO/CN line ratio (, Appendix A) than the northern nucleus, consistent with the results for NGC 1377 and VV 114 east. In contrast to NGC 1377 and VV114, Harada et al. (2018) find a lower HCN/HCO+ line ratio as well as a lower HCN/13CO abundance ratio in the southern (AGN) nucleus than in the northern (starburst) nucleus.
AM 2055-425 has been classified as an AGN/starburst composite (Imanishi et al., 2010). Imanishi et al. (2017) find that infrared radiative pumping plays a role in the excitation of HCN in AM 2055-425 and observe high-velocity wings in the CO J=3-2 emission indicative of a strong molecular outflow. It has a S/N-matched CO/CN line ratio that is significantly lower than those of NGC 1377 or VV114 east. As the most distant galaxy in our sample, it is possible that we do not have sufficient spatial resolution or sensitivity to see clear evidence of an AGN signature in the CO/CN line ratio.
This analysis suggests that higher CO/CN line ratios tend to be found in the vicinity of an AGN. To match these observations, the AGN would need to reduce the overall CN emission while simultaneously enhancing the HCN emission. However, the analysis by Meijerink et al. (2007) shows a significant increase in the CN/HCN column density for an XDR compared to a PDR at a given gas density. Those same models also produce slightly larger HCN/CO line ratios in PDRs than in XDRs for the same gas density. Recent models by Harada et al. (2013) of abundances in an AGN nuclear disk show that CN/CO can be enhanced in the XDR layer while HCN/CO is enhanced in the warm midplane and the CN/HCN ratio is enhanced in the colder outer parts of the disk. However, the resulting column densities are highly dependent on the details of the disk models, such as the thickness of the disk (Harada et al., 2013). Expanding the sample of galaxies with resolved CO, CN, and HCN maps would allow better statistics on the effect of an AGN on the CO/CN line ratio and would provide an interesting comparison with XDR models.
4 Conclusions
This paper presents the results of an archival project using ALMA Cycle 0 data to survey the CO/CN ratio in 17 nearby galaxies. We identified a sample of 8 galaxies with distances Mpc for which both the CN and CO lines were detected. These galaxies range from nearby starbursts (M83, NGC 253) to ultra/luminous infrared galaxies (AM 1300-233, AM 2246-490, AM 2055-425, NGC 3256, VV 114) to an S0 galaxy with an unusual far-infrared excess (NGC 1377).
We measure S/N-matched CO/CN line ratios as well as ratios calculated from the total flux detected in each line with ALMA. The S/N-matched CO/CN line ratios range from as low as 7 to as high as 65, while the ratios based on the total detected flux range from 20 to 140. In addition, spatial variations in the CO/CN line ratio of greater than a factor of 3 are seen in several of the galaxies with the brightest emission lines.
We discuss several possible explanations for the observed variations in the CO/CN line ratio. We argue that the variations are unlikely to be due to differences in the opacity of either CO or CN, or to changes in the CO-to-H2 conversion factor in these infrared-luminous systems. Given the low optical depth of the CN line, a high CO/CN line ratio can be produced by a high CN excitation temperature or a low [CN]/[H2] abundance ratio, or both. Additional resolved measurements to constrain the warm gas pressure and the CN line excitation should be able to distinguish between these two possibilities.
Of the 8 resolved nuclear regions in our sample, 4 nuclei (AM 2055-425, NGC 1377, NGC 3256 south and VV 114 east) contain evidence for an AGN. The CO/CN line ratios in 3 of these 4 nuclei appear to be a factor of 2-3 larger than the line ratios seen in starburst-dominated regions; the fourth galaxy (AM2055-425) may be too distant for us to separate clearly the AGN and starburst emission. This result suggests that CN emission is suppressed in the presence of an AGN, but whether this is due to excitation or abundance differences is unclear. Studying a larger sample of galaxies with and without AGN will show how significant this trend is; given the large and growing ALMA public archive, it should be possible to increase the sample of galaxies with both CO and CN detections by a factor of 4 or more compared to the sample discussed in this paper.
Acknowledgements
We thank the anonymous referee for detailed comments that significantly improved the content of this paper. This paper makes use of the following ALMA data: ADS/JAO.ALMA#2011.1.00099.S, ADS/JAO.ALMA#2011.1.00172.S, ADS/JAO.ALMA#2011.1.00467.S, ADS/JAO.ALMA#2011.1.00525.S, ADS/JAO.ALMA#2011.1.00645.S, ADS/JAO.ALMA#2011.1.00772.S. ALMA is a partnership of ESO (representing its member states), NSF (USA) and NINS (Japan), together with NRC (Canada), MOST and ASIAA (Taiwan), and KASI (Republic of Korea), in cooperation with the Republic of Chile. The Joint ALMA Observatory is operated by ESO, AUI/NRAO and NAOJ. The National Radio Astronomy Observatory is a facility of the National Science Foundation operated under cooperative agreement by Associated Universities, Inc. This research has made use of the NASA/IPAC Extragalactic Database (NED) which is operated by the Jet Propulsion Laboratory, California Institute of Technology, under contract with the National Aeronautics and Space Administration. CDW acknowledges financial support from the Canada Council for the Arts through a Killam Research Fellowship. The research of CDW is supported by grants from the Natural Sciences and Engineering Research Council of Canada and the Canada Research Chairs program. CDW would like to thank NRAO for its hospitality and financial support during the initial and final phases of this project, Kaz Sliwa and Alberto Bolatto for sharing their data, and Chelsea Sharon for providing feedback on the revised version of this paper.
References
- Aalto et al. (2002) Aalto S., Polatidis A. G., Hüttemeister S., Curran S. J., 2002, A&A, 381, 783
- Aalto et al. (2007) Aalto S., Monje R., Martín S., 2007, A&A, 475, 479
- Aalto et al. (2016) Aalto S., et al., 2016, A&A, 590, A73
- Aalto et al. (2017) Aalto S., et al., 2017, A&A, 608, A22
- Aladro et al. (2013) Aladro R., et al., 2013, A&A, 549, A39
- Ando et al. (2017) Ando R., et al., 2017, ApJ, 849, 81
- Boger & Sternberg (2005) Boger G. I., Sternberg A., 2005, ApJ, 632, 302
- Bolatto et al. (2013a) Bolatto A. D., Wolfire M., Leroy A. K., 2013a, ARA&A, 51, 207
- Bolatto et al. (2013b) Bolatto A. D., et al., 2013b, Nature, 499, 450
- Chung et al. (2011) Chung A., Yun M. S., Naraynan G., Heyer M., Erickson N. R., 2011, ApJ, 732, L15
- Costagliola et al. (2016) Costagliola F., Herrero-Illana R., Lohfink A., Pérez-Torres M., Aalto S., Muller S., Alberdi A., 2016, A&A, 594, A114
- Díaz-Santos et al. (2013) Díaz-Santos T., et al., 2013, ApJ, 774, 68
- Downes & Solomon (1998) Downes D., Solomon P. M., 1998, ApJ, 507, 615
- Egusa et al. (2018) Egusa F., Hirota A., Baba J., Muraoka K., 2018, ApJ, 854, 90
- Freeman et al. (2017) Freeman P., Rosolowsky E., Kruijssen J. M. D., Bastian N., Adamo A., 2017, MNRAS, 468, 1769
- Fuente et al. (2005) Fuente A., García-Burillo S., Gerin M., Teyssier D., Usero A., Rizzo J. R., de Vicente P., 2005, ApJ, 619, L155
- Gao & Solomon (2004) Gao Y., Solomon P. M., 2004, ApJ, 606, 271
- García-Burillo et al. (2010) García-Burillo S., et al., 2010, A&A, 519, A2
- García-Burillo et al. (2014) García-Burillo S., et al., 2014, A&A, 567, A125
- García-Burillo et al. (2017) García-Burillo S., et al., 2017, A&A, 608, A56
- Ginard et al. (2015) Ginard D., et al., 2015, A&A, 578, A49
- Gratier et al. (2017) Gratier P., et al., 2017, A&A, 599, A100
- Harada et al. (2013) Harada N., Thompson T. A., Herbst E., 2013, ApJ, 765, 108
- Harada et al. (2018) Harada N., Sakamoto K., Martin S., Aalto S., Aladro R., Sliwa K., 2018, preprint (arXiv:1801.05941)
- Imanishi et al. (2007) Imanishi M., Nakanishi K., Tamura Y., Oi N., Kohno K., 2007, AJ, 134, 2366
- Imanishi et al. (2009) Imanishi M., Nakanishi K., Tamura Y., Peng C.-H., 2009, AJ, 137, 3581
- Imanishi et al. (2010) Imanishi M., Nakagawa T., Shirahata M., Ohyama Y., Onaka T., 2010, ApJ, 721, 1233
- Imanishi et al. (2017) Imanishi M., Nakanishi K., Izumi T., 2017, ApJ, 849, 29
- Iono et al. (2013) Iono D., et al., 2013, PASJ, 65, L7
- Iwasawa et al. (2011) Iwasawa K., et al., 2011, A&A, 529, A106
- Juneau et al. (2009) Juneau S., Narayanan D. T., Moustakas J., Shirley Y. L., Bussmann R. S., Kennicutt Jr. R. C., Vanden Bout P. A., 2009, ApJ, 707, 1217
- Kamenetzky et al. (2017) Kamenetzky J., Rangwala N., Glenn J., 2017, MNRAS, 471, 2917
- Kennicutt & Evans (2012) Kennicutt R. C., Evans N. J., 2012, ARA&A, 50, 531
- Kim et al. (2017) Kim J., Chung A., Wong O. I., Lee B., Sung E.-C., Staveley-Smith L., 2017, A&A, 605, A54
- Leroy et al. (2015) Leroy A. K., et al., 2015, ApJ, 801, 25
- Meier et al. (2015) Meier D. S., et al., 2015, ApJ, 801, 63
- Meijerink & Spaans (2005) Meijerink R., Spaans M., 2005, A&A, 436, 397
- Meijerink et al. (2007) Meijerink R., Spaans M., Israel F. P., 2007, A&A, 461, 793
- Meijerink et al. (2011) Meijerink R., Spaans M., Loenen A. F., van der Werf P. P., 2011, A&A, 525, A119
- Miller et al. (1997) Miller B. W., Whitmore B. C., Schweizer F., Fall S. M., 1997, AJ, 114, 2381
- Nakajima et al. (2015) Nakajima T., et al., 2015, PASJ, 67, 8
- Neff et al. (2003) Neff S. G., Ulvestad J. S., Campion S. D., 2003, ApJ, 599, 1043
- Ohyama et al. (2015) Ohyama Y., Terashima Y., Sakamoto K., 2015, ApJ, 805, 162
- Pérez-Beaupuits et al. (2007) Pérez-Beaupuits J. P., Aalto S., Gerebro H., 2007, A&A, 476, 177
- Pérez-Beaupuits et al. (2009) Pérez-Beaupuits J. P., Spaans M., van der Tak F. F. S., Aalto S., García-Burillo S., Fuente A., Usero A., 2009, A&A, 503, 459
- Radburn-Smith et al. (2011) Radburn-Smith D. J., et al., 2011, ApJS, 195, 18
- Rosenberg et al. (2015) Rosenberg M. J. F., et al., 2015, ApJ, 801, 72
- Saha et al. (2006) Saha A., Thim F., Tammann G. A., Reindl B., Sandage A., 2006, ApJS, 165, 108
- Saito et al. (2015) Saito T., et al., 2015, ApJ, 803, 60
- Saito et al. (2017) Saito T., et al., 2017, ApJ, 834, 6
- Sakamoto et al. (2014) Sakamoto K., Aalto S., Combes F., Evans A., Peck A., 2014, ApJ, 797, 90
- Sanders et al. (2003) Sanders D. B., Mazzarella J. M., Kim D.-C., Surace J. A., Soifer B. T., 2003, AJ, 126, 1607
- Sliwa et al. (2013) Sliwa K., et al., 2013, ApJ, 777, 126
- Stierwalt et al. (2014) Stierwalt S., et al., 2014, ApJ, 790, 124
- Ueda et al. (2014) Ueda J., et al., 2014, ApJS, 214, 1
- Walter et al. (2017) Walter F., et al., 2017, ApJ, 835, 265
- Watanabe et al. (2017) Watanabe Y., Nishimura Y., Harada N., Sakai N., Shimonishi T., Aikawa Y., Kawamura A., Yamamoto S., 2017, ApJ, 845, 116
- Wu et al. (2010) Wu J., Evans II N. J., Shirley Y. L., Knez C., 2010, ApJS, 188, 313
- Young et al. (1995) Young J. S., et al., 1995, ApJS, 98, 219
Appendix A Notes on individual galaxies with detected CN emission
A.1 AM 1300-233, AM 2055-425, and AM 2246-490
AM 2055-425 has been classified as an AGN/starburst composite, while AM 2246-490 and AM 1300-233 are LIRGs with no sign of an AGN or an obscured AGN in their near-infrared spectra (Imanishi et al., 2010; Iwasawa et al., 2011). Although the CN emission for these galaxies is quite weak, CN emission does appear at all the strong CO peaks in the image cubes, and so the S/N-matched CO/CN ratio measurements are likely fairly robust. However, AM 2055-425 and AM 1300-233 have the lowest CO signal-to-noise ratios in the sample (as measured in the CO peak emission channel). Thus the global CO/CN ratio for these galaxies is likely to be somewhat overestimated because of the low S/N on the CN line. Images and global spectra for each galaxy are shown in Figs. 4, 5, and 6.
AM 2246-490 is distinguished by having the smallest CO/CN line ratio () in our entire sample, implying the CN emission is bright relative to CO. Stierwalt et al. (2014) find a relatively low ratio of PAH luminosity to infrared luminosity (), which they say is consistent with its classification as a merger remnant in Ueda et al. (2014). Díaz-Santos et al. (2013) report a low ratio of [CII] to far-infrared luminosity, which is consistent with its relatively large infrared luminosity. They also find that AM 2246-490 lies at the warm colour end of their sample of LIRGs.


A.2 M83
M83 is a nearby spiral galaxy hosting a central starburst. The CO and CN emission in this galaxy is highly resolved and there is a factor of variation in the CO/CN ratio. More investigation into the individual cloud properties in this galaxy is left to a future paper. Images and global spectra for M83 are shown in Fig. 7 while the image of the CO/CN line ratio is shown in Fig. 3. Wider-field images of the CO emission in M83 show that this central region has higher CO peak temperatures and larger line widths than in the bar or spiral arm region (Egusa et al., 2018).
A.3 NGC 253
NGC 253 is an edge-on spiral galaxy with a strong central starburst. It has a starburst-driven outflow in which dense gas tracers such as HCN and CN are detected (Walter et al., 2017). The CO/HCN line ratio is in the outflow and central starburst but falls to in the disk (Walter et al., 2017). Individual giant molecular clouds appear as peaks in dense gas tracers as well as in the CO/HCN ratio map at 35 pc resolution (Leroy et al., 2015). Ando et al. (2017) observe significant variations in the spectra of the densest clumps at 10 pc resolution, with the most line-rich clump resembling a giant hot molecular core. Images and global spectra for NGC 253 are given in Fig. 8 while the image of the CO/CN line ratio is shown in Fig. 3.
A.4 NGC 1377
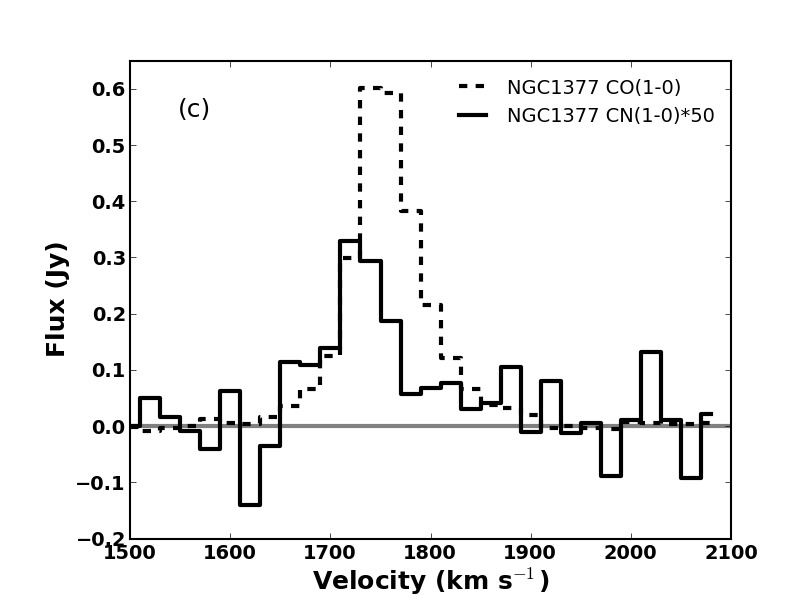
The CO emission in this galaxy extends over times the area of the detected CN emission. NGC 1377 has the highest signal-to-noise measurement of its CO flux after the three bright mergers/starbursts (NGC 3256, NGC 253, VV 114). This high S/N ratio suggests that the large value of the S/N-matched CO/CN line ratio observed in this galaxy is real. However, because of the large CO/CN line ratio, the S/N on the CN line is quite low (although CN emission is detected at all the major CO peaks in the image cube) and so the global CO/CN ratio is likely to be somewhat overestimated. Images and global spectra for NGC 1377 are shown in Fig. 9. The peak of the CN emission is offset in velocity from the peak of the CO emission, which implies there may be spatially unresolved gradients in the CO/CN line ratio in this galaxy.
A.5 NGC 3256
The CO/CN line ratio varies substantially across this galaxy. The minimum value of 8 corresponds to the northern nucleus (Neff et al., 2003) while the ratio at the peak of the CO emission in the southern nucleus is 26. These values have been measured in a single beam but are constant over areas of a few beams around each nucleus (Fig. 1). Images and global spectra for NGC 3256 are shown in Fig. 1.
A.6 VV 114
VV114 shows the most extreme variations in the CO/CN line ratio and also has a complicated velocity structure. For the global value for the S/N-matched CO/CN line ratio, the processing parametres are as described in Table 2. However, because of the large variations, it was impossible to match the CO moment 0 multiplier closely to the global ratio value.
Separate ratio maps were made for the eastern nucleus and overlap (western) region to try to capture this spatial variation. For the eastern nucleus, the ratio map was made using a CO cutoff a factor of 30 times the CN cutoff and using a velocity range of 5858-6008 km s-1. For the overlap region, the CO cutoff was 60 and the velocity range was 5708-5828 km s-1. The resulting ratio maps are shown in Fig. 2. Averaged over a single beam, the CO/CN ratio is 28 towards the eastern nucleus and 61 towards the overlap region.
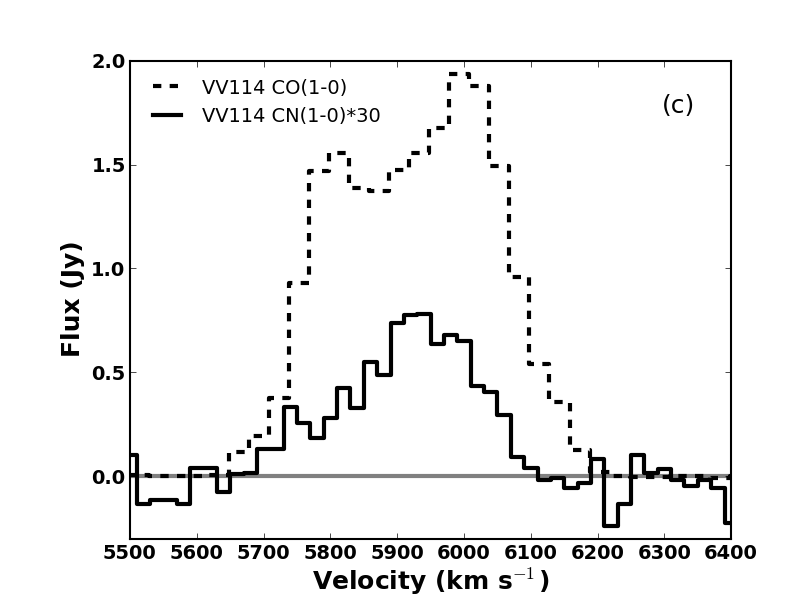
The weaker of the two CN line groups was not detected in the overlap region by Saito et al. (2015) and the upper limit to the emission results in larger CN line ratios than would be expected from gas in LTE. These large line ratios could indicate subthermal excitation of the CN lines. We re-imaged the emission from VV114 for both CN lines using natural weighting and 40 km s-1 channels; a spectrum (not shown) towards the position of the CO/CN maximum in Fig. 2 suggests a marginal detection of the weaker CN line, with a ratio or upper limit consistent with LTE. Thus, we feel there is no need to invoke sub-thermal excitation to explain the CN emission in the overlap region of VV 114. Images and global spectra for VV 114 are shown in Fig. 10 while images of the CO/CN line ratios in the eastern nucleus and the overlap region are shown in Fig. 2.
Appendix B Lower limits to the CO/CN ratio in 9 galaxies
We measure lower limits to the CO/CN ratio for 9 galaxies where the CO emission is detected at in Ueda et al. (2014). We adopt a 2 limit on the CN emission and calculate the lower limits using two different methods. The first method combines the peak CO emission in a single 20 km s-1 channel with the CN rms noise level measured at the same velocity resolution. This CO/CN line ratio is most directly comparable to the S/N-matched CO/CN line ratios given in Table 3.
For the second method, we made a moment 0 map of the CO emission using all channels in which CO was detected and measured the peak CO emission from the moment map. We estimated the corresponding CN integrated intensity rms noise as , where is the rms noise in the CN data cube, is the number of velocity channels used to make the CO moment 0 map, and 20 km -1 is the velocity width of the channels in the data cube. These CO/CN line ratios are most directly comparable to the global CO/CN line ratios given in Table 3.
NGC 7252 is detected in CN at the level in a single 20 km s-1 channel. The CO/CN ratio derived in this single channel is consistent with many of the stronger detections in Table 3. This galaxy is a well-known merger remnant sometimes known as the “Atoms for Peace” galaxy and is rich in star clusters (Miller et al., 1997). The ALMA CO data show a rotating disk of molecular gas (Ueda et al., 2014).
Most of the upper limits in Table 4 are not particularly interesting when compared with the CO/CN line ratios in Table 3. The one possible exception is AM 0956-282: the limit CO/CN based on the CO peak channel is larger than all our detected line ratios except for VV 114 and NGC 1377. AM 0956-282 is a nearby blue compact dwarf (BCD) galaxy that Kim et al. (2017) suggest has recently undergone a flyby interaction with another BCD galaxy. It is quite nearby ( Mpc) and has a far-infrared luminosity of only L⊙ (Ueda et al., 2014).
| Galaxy | CO peak | CO/CN in | CO peak in | CO/CN from |
|---|---|---|---|---|
| in channel | channel11footnotemark: 1 | moment 0 map | moment 0 map11footnotemark: 1 | |
| (mJy beam-1) | (Jy beam-1 km s-1) | |||
| Arp 230 | 69 | |||
| Arp 187 | 47 | |||
| AM 0612-373 | 46 | |||
| AM 0956-282 | 170 | |||
| NGC 3597 | 114 | |||
| AM 1255-430 | 33 | |||
| AM 2038-382 | 61 | |||
| NGC 7252 | 172 | |||
| NGC 7727 | 42 |
CO/CN lower limits calculated assuming a limit on the CN
emission.