Chromospheric activity catalogue of 4454 cool stars.
Abstract
Context. Chromospheric activity monitoring of a wide range of cool stars can provide valuable information on stellar magnetic activity and its dependence on fundamental stellar parameters such as effective temperature and rotation.
Aims. We compile a chromospheric activity catalogue of 4454 cool stars from a combination of archival HARPS spectra and multiple other surveys, including the Mount Wilson data that have recently been released by the NSO. We explore the variation in chromospheric activity of cool stars along the main sequence for stars with different effective temperatures. Additionally, we also perform an activity-cycle period search and investigate its relation with rotation.
Methods. The chromospheric activity index, S-index, was measured for 304 main-sequence stars from archived high-resolution HARPS spectra. Additionally, the measured and archived S-indices were converted into the chromospheric flux ratio log . The activity-cycle periods were determined using the generalised Lomb-Scargle periodogram to study the active and inactive branches on the rotation – activity-cycle period plane.
Results. The global sample shows that the bimodality of chromospheric activity, known as the Vaughan-Preston gap, is not prominent, with a significant percentage of the stars at an intermediate-activity level around = -4.75. Independently, the cycle period search shows that stars can lie in the region intermediate between the active and inactive branch, which means that the active branch is not as clearly distinct as previously thought.
Conclusions. The weakening of the Vaughan-Preston gap indicates that cool stars spin down from a higher activity level and settle at a lower activity level without a sudden break at intermediate activity. Some cycle periods are close to the solar value between the active and inactive branch, which suggests that the solar dynamo is most likely a common case of the stellar dynamo.
1 Introduction
The non-thermal emission in the line cores of certain chromospheric lines such as the Ca II H&K, Mg II, H, and Ca II infrared triplet is widely used as an indicator of the surface magnetic activity in cool stars (spanning F to M dwarfs). The first successful measurement of emission in stellar chromospheric lines was carried out by Eberhard & Schwarzschild (1913). Arguably the most renowned study of stellar chromospheric emission is the Mount Wilson program, which measured the chromospheric activity of more than a thousand stars over a time span of more than four decades (Wilson 1968; Duncan et al. 1991; Baliunas et al. 1995). The Mount Wilson survey indicates that stars can be categorised into either active or inactive stars, with a lack of stars with intermediate activity.
The lack of stars in the intermediate-activity region is known as the Vaughan-Preston gap (Vaughan & Preston 1980). Different theories have been proposed to explain this gap. Firstly, it could be an indication of two distinct physical phenomena, such as different stellar populations (Baliunas et al. 1995; Henry et al. 1996), stellar modes or topologies (Durney et al. 1981; Middelkoop 1982; Böhm-Vitense 2007), or rapid shifts in differential rotation (Metcalfe et al. 2016). Secondly, it could be a temporal effect, caused by a smooth (Noyes et al. 1984a), rapid (Pace et al. 2009), or critical spin-down rate of the rotation (Vaughan & Preston 1980; Middelkoop 1982; Noyes et al. 1984a). Lastly, as suggested by Vaughan & Preston (1980), it could be just a matter of small number statistics, and the Vaughan-Preston gap might not be real (Vaughan & Preston 1980; Noyes et al. 1984a).
In addition to measuring chromospheric activity for hundreds of stars, the Mount Wilson project also established that cool stars other than the Sun have magnetic activity cycles. With observations spanning several decades, the chromospheric activity cycles of the Mount Wilson sample were first investigated by Baliunas et al. (1995). These authors reported three different types of activity cycles: solar-like cyclic activity, highly variable non-cyclic activity, and flat activity. Observations of cyclic chromospheric activity in the Mount Wilson sample (Baliunas et al. 1995) suggest that solar-like chromospheric activity is common and is exhibited by many cool dwarfs.
The detection of magnetic activity cycles in solar-like stars provides valuable observational constraints on solar and stellar dynamo models. The mechanism behind the dynamo-driven activity cycle was investigated by many groups (Noyes et al. 1984b; Baliunas & Vaughan 1985; Brandenburg et al. 1998; Saar & Brandenburg 1999; Böhm-Vitense 2007). For old stars with clear cyclic behaviour, Noyes et al. (1984b) reported a possible correlation between activity-cycle period and Rossby number, Ro, where Ro is the ratio of the rotation period to the convective overturn time (). However, Baliunas & Vaughan (1985) did not find any correlation between activity-cycle period , rotation period , Ro, and other stellar properties.
To investigate the relationship between stellar activity cycles and the dynamo process, the well-constrained activity cycles in the Mount Wilson sample were investigated by Saar & Baliunas (1992). They reported that stellar activity cycles form two distinct branches when plotted as a function of rotation. They classified them as the active and inactive branch. The active branch comprises stars with strong activity, and the inactive branch consists of stars with weak chromospheric activity. These two branches were also confirmed by Brandenburg et al. (1998), Saar & Brandenburg (1999) and Brandenburg et al. (2017). Both Brandenburg et al. (1998) and Saar & Brandenburg (1999) investigated the dependence of the effect on the magnetic field () for stars with a known chromospheric activity cycle. According to dynamo models, the effect describes the inductive effect of a twisted magnetic field via turbulent convective helical motions that can generate a poloidal from a toroidal magnetic field (Steenbeck et al. 1966). Together with the effect, which is differential rotation, it has been successful in reproducing different aspects of the solar magnetic cycle under the mean-field dynamo models (see e.g. Ossendrijver 2003; Charbonneau 2010, for a detailed review on the solar dynamo). Despite the advances made in numerical modelling, no current dynamo model can fully reproduce all observed solar phenomena.
To provide observational constraints for current dynamo models, Brandenburg et al. (1998) and Saar & Brandenburg (1999) used the ratio of activity cycle and rotation frequency () and defined Ro as . In this definition, is proportional to the effect when we assume that and the radial shear are linearly proportional to . One key result was that stars in both branches show evidence of a dynamo, where increases linearly with the magnetic field strength , and not, as predicted, by simple quenching . Saar & Brandenburg (1999) also reported the presence of multiple cycles, where stars from the active branch could have a second cycle on the inactive branch, and vice versa. However, they also noted that the classification of stars into two branches based on the activity and the evolution of the cycles from one branch to another might be more complex than the clear distinction reported in their work. Multiple cycles and migration of stars from one branch to another was also reported by Böhm-Vitense (2007) in a separate model-independent study that investigated cycle period versus rotation period. Recently, Metcalfe et al. (2016) updated the figure of Böhm-Vitense (2007) showing rotation versus cycle period with approximately 30 stars. Metcalfe et al. (2016) concluded that the Sun is an anomaly amongst other Mount Wilson stars with similar rotation periods. It is the only star with an activity cycle that does not lie on either the inactive or active branch. However, the sample size is small and the results might be different if we were to include the large Mount Wilson sample that has recently been released by the National Solar Observatory (NSO) and stars from other long-term surveys. 111http://www.nso.edu/node/1335
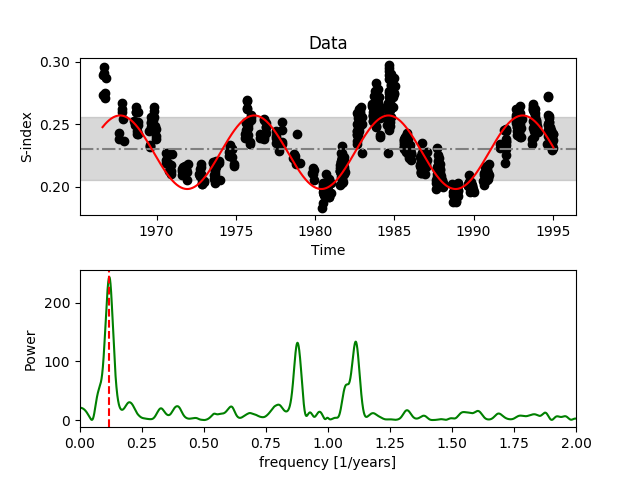
We here compile a chromospheric activity catalogue of cool stars. We achieve this by combining archival data sets available in Vizier with data from the Mount Wilson survey (Duncan et al. 1991; Baliunas et al. 1995) (released by the NSO)222A sub sample of the NSO data, comprising of solar analogues, was also investigated by Egeland et al. (2017) and the HARPS F, G, K, and M radial velocity targets (Lovis et al. 2011; Bonfils et al. 2013). The Mount Wilson data released by the NSO also consist of S-index measurements that were not published in Baliunas et al. (1995), with some observations made until 2000. We analyse the full Mount Wilson sample for the first time since Duncan et al. (1991) and Baliunas et al. (1995) and investigate the average and the long-term activity of cool stars along the main sequence.
One key motivation for compiling the catalogue is to monitor the chromospheric activity of cool stars as a function of effective temperature, or . We investigate if there is indeed a lack of intermediately active cool stars in the solar neighbourhood. Additionally, we explore trends in stellar activity cycles as a function of rotation to provide observational constraints to solar and stellar dynamo models. This paper is organised as follows: In Section 2 we describe the archival data and introduce the catalogue. In Section 3 we discuss the chromospheric activity in terms of the S-index and the conversion for the global sample. For a sub-sample of stars with long-term measurements, the activity-cycle periods are calculated in Section 4. The relation between activity-cycle period and rotation is investigated in Section 5, followed by a comparison with Zeeman Doppler imaging results in Section 6, and we finally provide our conclusions in Section 7.
2 Data collection

The total number of unique cool stars (main-sequence dwarfs) in the catalogue is 4454, 2509 of which can be found in single surveys, and 1945 appear in multiple surveys. The Hertzsprung-Russel (HR) diagram of the cool stars in the catalogue is shown in Fig. 1. Except for the HARPS stars, all other S-index measurements were taken from existing values in the literature.
The surveys also contain several evolved stars that we have removed in this analysis. We used the main-sequence - relation from Table B.1 in Gray (2005) and removed stars lying outside the relation with . The number of cool stars corresponding to different surveys including references is listed in Table 1. The stellar properties of the cool dwarfs are listed in Table LABEL:maintable. Only a few of the stars are shown here. The full catalogue will be available in Vizier. A detailed description of the sources is given below.
-
•
Ar2011: The Magellan survey (Arriagada 2011) provided 643 stars. For individual stars, the median S-index () was calibrated to the Mount Wilson scale.
-
•
Wr2004 and Is2010: The California and Carnegie planet search provided 1101 stars (Wright et al. 2004), 739 of which have both mean () and median () S-index values, and 362 stars have only values. Additionally, 1798 stars were also observed as part of the California planet survey (Isaacson & Fischer 2010); they have only values.
-
•
Gr2006 and He1996: A survey of southern solar-type stars carried out by Henry et al. (1996) and Gray et al. (2006). The southern sample of stars in Henry et al. (1996) consists of 758 stars within 50 pc of the solar neighbourhood. For the stars that were observed several times, was taken from the literature. of 1288 southern stars was also taken from Gray et al. (2006). The southern stars only have published in the literature.
-
•
Ha2009: of 28 stars were taken from the solar and stellar activity program of the Lowell observatory (Hall et al. 2009).
-
•
Lo2011 and Bo2013: High-resolution archival spectra were obtained for 304 F, G, K stars and 103 M dwarfs (Lovis et al. 2011; Bonfils et al. 2013). We analysed the spectra of 304 F, G, K stars and calculated the S-index calibrated to the Mount Wilson S-index based on the technique used by Marvin et al. 2018 (in prep; hereafter M18; for a brief description of the method, we refer to Section 3). The M-dwarf spectra were analysed by M18.
-
•
NSO MWO: Data from the Mount Wilson survey (Duncan et al. 1991; Baliunas et al. 1995) have recently been re-released by the NSO and are included in the catalogue. We included 827 cool stars from the NSO Mount Wilson survey. The median and mean S-indices were calculated from the long-term measurements.
When an S-index measurement was found in several surveys, the median and mean were calculated from multiple measurements. The median was preferred over the mean because when it is observed over long-term flares, it might influence the mean S-index. A summary of the stars included in the catalogue and their sources is listed in Table 1.
| No | survey | Total no. | No. of | Reference | ||
|---|---|---|---|---|---|---|
| of stars | MS stars | |||||
| (i) | Magellan | 673 | 634 | No | Yes | 1 |
| (ii) | CPS | 808 | 739 | Yes | Yes | 2 |
| 401 | 362 | Yes | No | 2 | ||
| 2620 | 1798 | No | Yes | 3 | ||
| (iii) | Southern stars | 825 | 758 | Yes | No | 4 |
| 1359 | 1288 | Yes | No | 5 | ||
| (iv) | Lowell | 28 | 28 | Yes | Yes | 6 |
| (v) | HARPS | 311 | 304 | Yes | Yes | 7 |
| 116 | 103 | Yes | Yes | 8 | ||
| (vi) | NSO MW 1995 | 1903 | 827 | Yes | Yes | 9 |
| Total | (w/o duplicates) | 4454 |
(1) Arriagada (2011);(2) Wright et al. (2004); (3) Isaacson & Fischer (2010); (4) Henry et al. (1996); (5) Gray et al. (2006); (6) Hall et al. (2009); (7) Lovis et al. (2011); (8) Bonfils et al. (2013); (9) Baliunas et al. (1995) and Duncan et al. (1991), released by the NSO in 2016. See Section 2 for more details on the type of S-index measurements.
landscape
| name | spectype | RA(ICRS) | DE(ICRS) | Mv | Plx | |||||
| HD102117 | G6V | 0.721 | 176.21055164 | -58.70353973 | 4.35379697702 | 23.81 | 0.105 | 0.106 | 0.006 | -5.006 |
| HD115585 | G5/G6IV/V | 0.742 | 199.96369673 | -70.85494655 | 4.24335464863 | 23.05 | 0.101 | 0.102 | 0.003 | -5.073 |
| HD12345 | G8III | 0.746 | 30.2025882 | -12.87526774 | 5.64288478528 | 23.8 | 0.118 | 0.120 | 0.005 | -4.910 |
| HD134985 | K1 | 0.772 | 228.19897523 | -1.16540113 | 6.21427764592 | 24.37 | 0.131 | 0.131 | 0.006 | -4.828 |
| HD162236 | G9V | 0.726 | 267.78070309 | -27.39610817 | 5.71993914874 | 23.12 | 0.19 | 0.19 | 0.01 | -4.58 |
| HD166724 | K0IV/V | 0.861 | 273.49852847 | -42.57518256 | 6.16304855196 | 23.26 | 0.22 | 0.22 | 0.02 | -4.63 |
| HD16714 | G5V | 0.708 | 39.94819506 | -33.89908714 | 5.28709271176 | 24.97 | 0.124 | 0.124 | 0.001 | -4.87 |
| HD203384 | K0 | 0.762 | 320.47312814 | -4.17399146 | 5.03872541119 | 25.22 | 0.116 | 0.117 | 0.003 | -4.977 |
| HD223121 | K1V | 0.94 | 356.73211614 | -31.98167606 | 6.29355871469 | 24.25 | 0.18 | 0.17 | 0.02 | -4.78 |
| HD25673 | K0 | 0.816 | 61.08444054 | -4.65558342 | 6.45176707069 | 24.23 | 0.14 | 0.14 | 0.02 | -4.83 |
| HD31822 | G0 | 0.581 | 74.64910667 | -9.33405665 | 4.76087816385 | 23.13 | 0.129 | 0.129 | 0.001 | -4.77 |
| HD34449 | G3V | 0.614 | 72.63706679 | -85.37507484 | 4.96743992445 | 23.2 | 0.131 | 0.131 | 0.002 | -4.747 |
| HD3569 | K0V | 0.846 | 9.63821988 | -12.17262517 | 6.11286501533 | 24.02 | 0.149 | 0.147 | 0.007 | -4.851 |
| HD6348 | G5 | 0.801 | 16.11080178 | -2.36626356 | 6.18099711832 | 25.48 | 0.141 | 0.143 | 0.007 | -4.814 |
| HD86171 | G5 | 0.746 | 149.16074258 | -8.83486532 | 5.70124726198 | 27.18 | 0.171 | 0.169 | 0.008 | -4.672 |
| HD967 | G5 | 0.645 | 3.5176132 | -11.31111824 | 5.23190849025 | 23.68 | 0.128 | 0.128 | 0.003 | -4.791 |
| HD98356 | K0V | 0.828 | 169.66610892 | -10.12638938 | 5.59823736105 | 23.64 | 0.176 | 0.175 | 0.004 | -4.757 |
| HIP473 | K6V+M0.5V | 1.41 | 1.41782275 | 45.81245496 | 7.84964780042 | 85.1 | 1.65 | 1.64 | 0.07 | -4.52 |
| HIP795 | G6V+G7V | 0.716 | 2.46506329 | 8.45319673 | 4.40297038964 | 14.21 | 0.45 | 0.45 | 0.02 | -4.33 |
| HIP4849 | K3V | 1.008 | 15.60155392 | 5.0609096 | 6.50239551466 | 46.61 | 0.50 | 0.51 | 0.02 | -4.61 |
| HIP5881 | G5 | 0.671 | 18.88025814 | 37.74350026 | 5.00943352307 | 16.9 | 0.20 | 0.20 | 0.02 | -4.76 |
| HIP7080 | G5 | 0.76 | 22.80805715 | -10.89662492 | 4.22273943841 | 17.32 | 0.145 | 0.145 | 0.001 | -5.115 |
| SAO11844 | tmp | 0.52 | 23.7811 | 60.7816 | 3.49114354298 | 0.146 | 0.145 | 0.004 | -4.92 | |
| GJ3126 | tmp | 1.5 | 30.3917 | 63.77 | 10.4215803134 | 78.4 | 1.11 | 1.13 | 0.06 | -4.82 |
| HIP9724 | M2.5 | 1.514 | 31.26683543 | -17.61420901 | 10.315299843 | 105.94 | 1.2 | 1.2 | 0.1 | -4.8 |
| HIP10492 | G6IV | 0.737 | 33.81735061 | -23.28140736 | 4.88429651479 | 23.06 | 0.225 | 0.222 | 0.009 | -4.753 |
| HIP11843 | F8V | 0.572 | 38.22562452 | 15.03446457 | 3.71039073168 | 34.84 | 0.18 | 0.18 | 0.01 | -4.76 |
| HIP12764 | F5 | 0.534 | 41.00359859 | -6.00937192 | 3.85299717862 | 22.73 | 0.157 | 0.156 | 0.002 | -4.859 |
| HIP13027 | G1V+G5V | 0.68 | 41.86395248 | 19.37221052 | 4.33286075259 | 30.66 | 0.39 | 0.38 | 0.01 | -4.37 |
| HIP19786 | G0 | 0.64 | 63.61327492 | 12.43534652 | 4.78078651116 | 22.19 | 0.31 | 0.31 | 0.01 | -4.45 |
| HIP20899 | G2V | 0.609 | 67.20096632 | 17.28553719 | 4.4503828987 | 21.09 | 0.31 | 0.32 | 0.01 | -4.42 |
| HIP22715 | K3V | 1.019 | 73.2693207 | 22.23548477 | 6.62628416664 | 37.09 | 0.643 | 0.643 | 0.004 | -4.496 |
| HIP23452 | K7V | 1.43 | 75.61879215 | -21.25610576 | 8.65797052589 | 117.38 | 1.4 | 1.39 | 0.04 | -4.62 |
| HIP23786 | G9V | 0.804 | 76.6751978 | 14.44681583 | 5.84068027487 | 41.7 | 0.32 | 0.32 | 0.01 | -4.61 |
| HIP23932 | M3.5V | 1.52 | 77.14473389 | -18.1686451 | 10.4329986098 | 107.3 | 0.97 | 0.94 | 0.06 | -4.91 |
| HIP25662 | G0V | 0.582 | 82.21491883 | 12.55135347 | 4.40224025855 | 34.55 | 0.162 | 0.161 | 0.003 | -4.862 |
| SAO170732 | tmp | 0.36 | 85.8373 | -20.1893 | 3.26759215189 | 0.239 | 0.237 | 0.003 | -4.446 | |
| HIP31083 | G0 | 0.71 | 97.83981164 | 2.911269 | 4.90455725108 | 35.72 | 0.177 | 0.175 | 0.006 | -4.9 |
| HIP35519 | K0 | 0.876 | 109.97365142 | 9.22967182 | 5.70570741725 | 19.64 | 0.175 | 0.175 | 0.005 | -5.073 |
| HIP38657 | K2.5V | 0.95 | 118.7250404 | 19.23744468 | 6.25702040908 | 50.05 | 0.186 | 0.187 | 0.002 | -5.103 |
3 Chromospheric activity
The chromospheric activity of cool stars can be determined by measuring the flux in the chromospheric Ca II H&K lines and normalising it to the nearby continuum, which is commonly referred to as the S-index (Vaughan & Preston 1980; Duncan et al. 1991).
3.1 S-index
The majority of S-index values included in this catalogue were taken from archives where the value is already calibrated to the Mount Wilson scale. We denote the S-index on the Mount Wilson scale as . We calculated the S-index for the archival HARPS spectra and calibrated it to .
3.1.1 Archival S-index values
While some surveys consist of both mean and median S-index values, only the mean or median is published for some surveys. We combined these archived values with the measured from HARPS to create the global sample.
3.1.2 S-index calculation for HARPS spectra
For HARPS spectra, we followed the prescription of Duncan et al. (1991) to mimic the response of the Mount Wilson HKP-2 spectrophotometer. We took a triangular bandpass at the core of the H and K lines at 3968.47 and 3933.664 , respectively, and two 20 wide rectangular bandpasses to measure the nearby continuum; centred on 3901.07 and centred on 4001.07 . The equation is given as
| (1) |
where , , , and are the counts of the respective bandpasses, 8 is a correction factor for the longer exposure times of the and bandpasses of the HKP-2 instrument, and is a proportionality constant, usually taken to be . We calibrated to by performing a linear regression on stars common in both surveys, so that
| (2) |
where and . The common stars are listed in Table 3. For the HARPS observations, we calculated both mean and the median .

Figure 2 shows on a log scale of all available S-index data listed in Table 1 as a function of . We used the median when it was available. When was not available, we used . For stars that appeared in several surveys, we plot the median value. For , the lower activity boundary remains nearly constant. The Sun lies close to the lower activity boundary. From , the lower boundary of increases towards cooler stars. For , the lower boundary of activity begins to drop. Over the entire range, the highest activity levels rise towards later spectral types. This colour-dependence of the activity is consistent with previous S-index surveys, for example Vaughan & Preston (1980) and Mittag et al. (2013). We also plot only the mean or the median, and the overall trend remains the same (see Figs. 10 and 11 ).
3.2 Chromospheric flux ratio log
While gives a measure of Ca II H and K emission for a relative comparison of stars of similar spectral types, its colour-dependence makes it unsuitable for comparing stars of different spectral types. Towards later-type stars, the flux in the and channels decreases as the bulk of radiation moves towards longer wavelengths. This results in a typical K or M dwarf having a much higher than a typical F or G star. Hence we converted the into the chromospheric flux ratio .

3.2.1 log conversion for archived values
To compare Ca II H and K emission of F, G, K, and M dwarfs on the same scale, the ratio of chromospheric flux to bolometric flux is more suitable. This concept is defined as (Linsky et al. 1979) ( is the flux in the H and K lines, denotes the photospheric flux and stands for the effective temperature). Currently, the most frequently used method of measuring is that of Noyes et al. (1984a), which requires a measurement of and for a particular star. The dimensionless is converted into the surface flux , most commonly by the calibration of Middelkoop (1982) or the improved Rutten (1984) calibration. The photospheric contribution is most commonly found using Noyes et al. (1984a), who used the Hartmann et al. (1984) method. However, this method is valid only for a limited spectral range , but many stars lie at .
To extend the relation of for all the stars in our sample, where can be as high as 2.0, we used the polynomial of M18. Using PHOENIX stellar atmosphere models, M18 calculated values down to , which covers the colour index range of the stars in our sample. To estimate , we used the to conversion used in Noyes et al. (1984a). However, the computed values are higher than those reported by Noyes et al. (1984a), as Noyes et al. (1984a) neglected the line core in their calibration, while M18 integrated the entire spectral line (see M18 for a more detailed discussion of this). To remain consistent with the relation given by Noyes et al. (1984a), denoted as , we scaled the relation given by M18, denoted as , to :
| (3) |
The constant 0.4612 was found by a least-squares fit of both relations in the range . This correction ensures that stars that lie in the Noyes et al. (1984a) calibration range still have similar values to Noyes et al. (1984a), while extending the relation to later spectral types K and M. We also used the relation given by M18, which is consistent with both Middelkoop (1982) and Rutten (1984).
3.2.2 log conversion for HARPS
For HARPS targets, we used the template-model method of M18 to measure . This method consists of measuring the surface flux by co-adding all available spectra into a template spectra with a high signal-to-noise ratio (S/N) using the HARPS-TERRA software (Anglada-Escudé & Butler 2012). The template spectra were normalised to a PHOENIX model atmosphere to convert the arbitrary flux into absolute flux units. Then we integrated the flux in the Ca II H and K line cores. The photospheric flux contribution was subtracted from by subtracting the integrated Ca II H and K line cores of the PHOENIX model atmosphere. For consistency, the correction in equation 3 was also applied to the HARPS targets.
3.2.3 log versus
Figure 3 shows the ratio of chromospheric Ca II H and K flux to bolometric flux, , as a function of . Similar to Fig. 2, median values are plotted whenever available, and mean values are used when the median is not available. A total of 4454 stars are plotted, with 2509 stars that appear only in one survey and 1945 that appear in several surveys. For stars that appear in several surveys, we plot the median value. The Sun at minimum activity is shown by a black symbol. The majority of stars lie in the range . The most active stars have and are located at the top of the plot. There is a concentration of inactive stars close to the solar activity level of .

For stars with 0.5, a higher concentration of active stars is seen compared to the stars with 0.5. This effect is due to the rapidly increasing rotational velocities of hotter stars, with 0.5, where the wings around their Ca II H and K lines can fill in, mimicking an active chromosphere (Schröder et al. 2009). As a result of this, we see this artificially induced high activity for some stars with 0.5. As for the stars with 0.51.1, the upper and the lower level of activity do not exhibit any significant trend. The Sun also lies in this range, and it lies closer to the low chromospheric activity boundary, also known as basal flux (Rutten 1984; Schrijver 1987; Rutten et al. 1991; Mittag et al. 2013; Pérez Martínez et al. 2014). This is consistent with previous work by Noyes et al. (1984a), except for the significant number of stars at intermediate activity level, which has not previously been reported.
For stars with 1.11.4, the basal flux increases linearly with , which could indicate a faster spin-down rate. However, the spin-down rates for cool stars are not expected to change so dramatically for the spectral types of these stars (Reiners & Mohanty 2012). It is unclear why these spectral types have such a high basal flux level, and further discussion is beyond the scope of this paper. Finally, for cooler stars with 1.4, the chromospheric activity becomes weaker with decreasing for later spectral types. This result is consistent with previous work on low-mass stars (Mohanty & Basri 2003; Reiners & Basri 2008). Although cooler stars are fast rotators, their chromospheric activity is weaker. Such weak chromospheres could be a product of a neutral stellar atmosphere that could inhibit magnetic activity (Mohanty et al. 2002; Mohanty & Basri 2003). For completeness, Fig. 3 was also plotted for only the mean and the median, as shown in Fig. 12 and Fig. 13. The overall shape of the histogram is the same, although we detect a slightly higher fraction of very active stars in Fig. 13. This is most likely an artificial effect due to flare activity, which influences the mean more than the median.
3.3 Vaughan-Preston gap
Vaughan & Preston (1980) discovered the lack of intermediately active F and G stars from a sample of 486 stars observed in the Mount Wilson project. We investigated the Vaughan-Preston gap based on a sample of 4454 cool stars taken from several surveys. The distribution of activity levels in the right panel of Fig. 3 shows some indications of the bimodal distribution of activity proposed by Vaughan & Preston (1980), although it is less distinct than previously found. The region between the two grey lines in Fig. 3 indicates the Vaughan-Preston gap reported in Noyes et al. (1984a). Contrary to Noyes et al. (1984a), a considerable fraction of stars are detected in the intermediate-activity region. It was suggested by Vaughan & Preston (1980) that the bimodal distribution of activity arises because of two distinct stellar populations: higher values are young and active stars, while lower values are old and inactive stars. They also suggested that the gap could either be a representation of different dynamo mechanisms or a statistical bias due to their small sample size. According to Durney et al. (1981), the gap suggests two different dynamo modes. Alternatively, the gap is explained by Noyes et al. (1984a) with three different possibilities: 1) it is not real, 2) there is a true bimodal distribution, but rotation and chromospheric emission decrease smoothly with age, or 3) there is a mass-dependent, critical rotation rate where rapid spin-down occurs. They also suggested that the dependence of chromospheric activity on either side of the gap on stellar rotation and spectral type questions the idea of two different dynamos. Similar to Noyes et al. (1984a), Rutten (1987) attributed the gap to a rapid spin-down for stars beyond a certain rotation rate. Rutten (1987) also remarked that the Vaughan-Preston gap is limited to F and G stars and is absent in cooler dwarfs. Lastly, the gap might be caused by stars crossing the gap on a very fast timescale of (Pace et al. 2009).
In order to investigate this ’bimodality’ in more detail, we plot the distribution of stellar activity levels for different ranges of in Fig. 4. For stars with , we detect a high concentration of low-activity stars, caused by the decrease in activity as the star spins down, finally arriving at a minimum activity level. For the F, G, and early-K dwarfs in the range of , the Vaughan-Preston gap is not so apparent. It is not clear if two peaks are noticeable or just one strong peak. Even if the secondary peak does exist, it is not so significant as the Vaughan-Preston gap. Moreover, the bimodality might also be fit with a skewed distribution or a Gaussian and skewed distribution.
As we move towards late-K and early-M dwarfs in , the scenario changes quite drastically. We detect a higher concentration of active stars on the active side of the Vaughan-Preston gap, and there is a significantly lower number of less active stars. This is the same lack of low-activity K dwarfs that was also noted by Mittag et al. (2013), which is expected because Mittag et al. (2013) shares many stars with our study. One explanation is that K dwarfs are in general more active than F and G dwarfs, and their minimum activity level or their basal flux is higher than that of F and G dwarfs. Whether the lack of inactive K stars arises because they exhibit a higher inactive state or because of other physical origins is unclear.
From , the number of stars that lie on the inactive side of the Vaughan-Preston gap increases, and the distribution of activity levels is spread more widely. This is explained by the downtrend of in this range.
Two of the most popular explanations of the Vaughan-Preston gap are stellar spin-down and different dynamo mechanisms. The insignificance of the Vaughan-Preston gap suggests that stars spin down from high activity to low activity. Whether there is any rapid spin-down at intermediate activity level is not clear. Robust measurements of stellar age and rotation are required to test this theory. To test the idea of two different dynamo mechanisms or geometry, spectropolarimetric observations of these stars and stellar dynamo models need to be combined. The magnetic geometries of these stars are currently being investigated using Zeeman Doppler imaging (ZDI) (Brown et al. 1991; Donati et al. 1997), and the results will be reported in paper II.
| Star | SMtWilson | SHARPS |
|---|---|---|
| HD10700 | 0.171 | 0.181 |
| HD115617 | 0.164 | 0.172 |
| HD152391 | 0.386 | 0.408 |
| HD160346 | 0.305 | 0.305 |
| HD16160 | 0.222 | 0.233 |
| HD216385 | 0.142 | 0.154 |
| HD23249 | 0.138 | 0.146 |
| HD26965 | 0.208 | 0.195 |
longtablellcccccccccc
Cool stars with well determined activity cycles are
tabulated first, followed by chaotic and multiple cycles, and finally probable cycles. The HD name of the star is shown in column 2, the spectral type
in column 3 and the rotation period (days) in column 4. Columns 5, 6, 7 and 8 show the cycle periods (years) and FAPs of the stars
determined in this work. The and are shown in column 9 and 10. Finally columns 11 and 12 show the Active and Inactive branch classification from Saar & Brandenburg (1999) and the corresponding surveys. MW stands for Mount Wilson and H stands for HARPS.
no.namespectypeProtPcycFAPPFAP(2)branchsurvey
\endfirstheadcontinued.
no.namespectypeProtPcycFAPPFAP(2)branchsurvey
\endhead\endfoot CA: Cool stars with clear well defined solar-like activity cycles
1Sun†G2V2510.70.081.0e-545……MW
2HD3651†K0V44.014.90.24.2e-97….0.8520.87IMW
3HD4628†K4V38.58.470.054.4e-194….0.8921.72IMW
4HD10476†K1V35.210.590.12.6e-122….0.83620.51IMW
5HD16160†K3V48.012.70.112.4e-183….0.91822.16IMW
6HD26965†K1V43.010.230.071.2e-163….0.8220.04IMW
7HD32147†K5V48.010.840.151.5e-60….1.04923.38IMW
8HD81809†G2V40.28.010.051.8e-129….0.65512.27IMW
9HD103095†K1V31.07.060.057.0e-129….0.75417.51IMW
10HD152391†G7V11.4311.970.16.3e-199….0.74917.28AMW
11HD160346†K3V36.47.190.043.5e-173….0.5948.75IMW
12HD166620†K2V42.417.050.24.8e-173….0.87621.46IMW
13HD185144†K0V29.07.070.142.2e-124….0.78618.85IMW
14HD201091†K5V35.77.10.054.0e-131….1.06923.53IMW
15HD219834B†K2V43.09.420.12.5e-81….0.78718.89IMW
CB: Cool stars with multiple cycles
1HD1835†G2.5V7.7822.00.934.2e-449.060.155.5e-390.65912.51AMW
2HD101501G8V16.6823.21.53.4e-534.50.036.4e-390.72316.02..MW
3HD149661†K2V21.0715.30.48.5e-727.70.121.2e-420.82720.25AMW
4HD190406†G1V13.942.60.021.1e-5218.70.98.8e-500.619.67IMW
5HD20630†G5V9.2422.30.986.3e-515.70.152.9e-110.68113.77AMW
CC: Cool stars with probable activity cycle
1HD10780K0V21.710.140.311.8e-43….0.80419.51..MW
2HD18256†FIV-V3.05.890.111.2e-27….0.4713.11AMW
3HD26913†G8V7.113.30.52.8e-41….0.6813.71AMW
4HD26923G0V60.48.580.171.4e-32….0.577.48..MW
5HD37394K1V10.743.670.077.2e-13….0.8420.62..MW
6HD76151†G3V15.018.10.765.9e-80….0.66112.62IMW
7HD78366†G0V9.6713.340.381.4e-48….0.5858.26AMW
8HD82443K0V5.3713.843.91.8e-21….0.77918.58..MW
9HD82885†G8IV-V18.67.690.144.0e-31….0.7718.212AMW
10HD100180F7V14.63.60.046.7e-33….0.577.45..MW
11HD115043G1V5.861.60.021.0e-13….0.6039.26..MW
12HD115383†F8V3.3311.790.285.5e-29….0.5858.26AMW
13HD146233G2V22.711.361.232.1e-02….0.65212.10..MW
14HD155885†K1V21.115.830.012.2e-33….0.85521.0AMW
15HD155886†K1V20.6921.61.23.23e-23….0.85521.0AMW
16HD156026†K5V21.021.30.833.4-85….1.14424.10..MW
17HD165341A†K0V19.75.070.051.3e-48….0.8621.11AMW
18HD190007K4V28.985.380.069.3e-31….1.12823.98..MW
19HD201092†K7V37.8411.10.183.3e-60….1.3125.45IMW
20HD20003G8V37.17.70.53.8e-09….0.7718.25..H
21HD20619G1.5V22.35.00.21.5e-14….0.6512.27..H
22HD21693G9IV-V36.37.40.36.9e-19….0.7115.35..H
23HD45184G2V21.44.90.31.8e-23….0.62610.59..H
24HD7199K0IV-V41.04.00.31.9e-11….0.556.42..H
25HD82516K2V36.74.20.11.1e-09….0.9322.28..H
26HD89454G5V21.14.00.81.2e-07….0.7215.71..H
27HD157830G6V24.33.90.53.9e-06….0.6813.98..H
28HD361G1V14.14.60.28.6e-03….0.62410.48..H
29HD12617K3V30.74.52.24.5e-03….1.0223.16..H
30HD166724K0IV-V30.92.40.21.8e-04….1.4626.69..H
31HD21749K4.5V34.59.16.33.4e-10….1.1323.99..H
32HD154577K2.5V45.85.90.15.4e-66….0.8821.71..H
33HD88742G0V11.32.90.11.3e-15….0.598.65..H
4 Chromospheric activity cycles
It is well known that cool stars other than the Sun also exhibit chromospheric activity cycles (Baliunas et al. 1995). Since the catalogue consists of multiple observations of some stars, it provides a unique opportunity for investigating chromospheric activity cycles. We determined the activity-cycle periods using the generalised Lomb Scargle periodogram (Zechmeister & Kürster 2009).
4.1 Cycle period
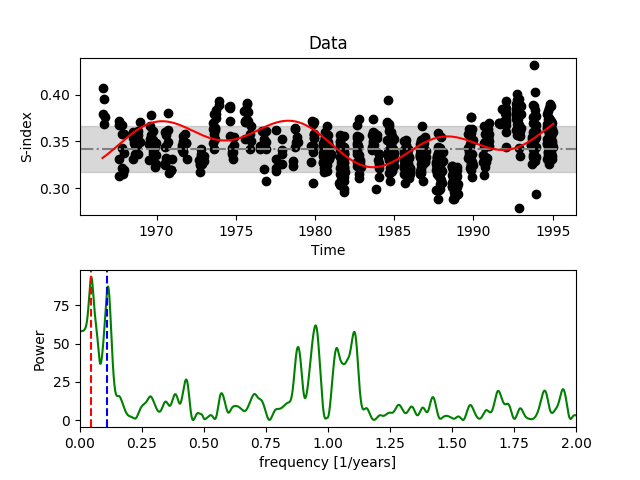
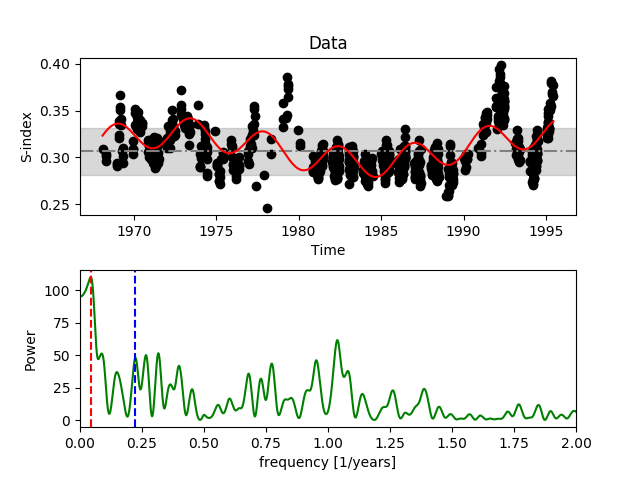
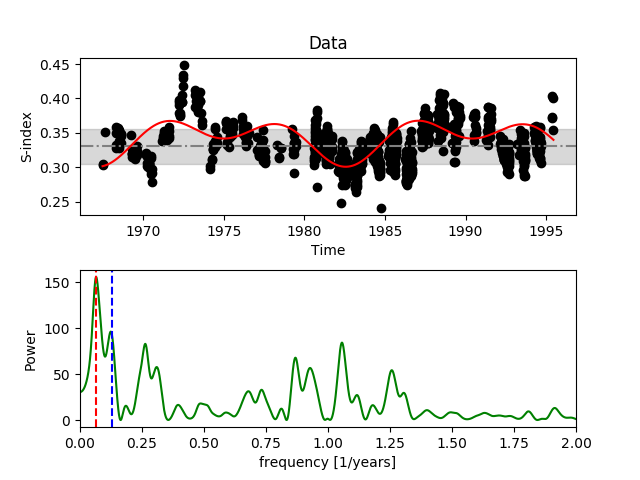
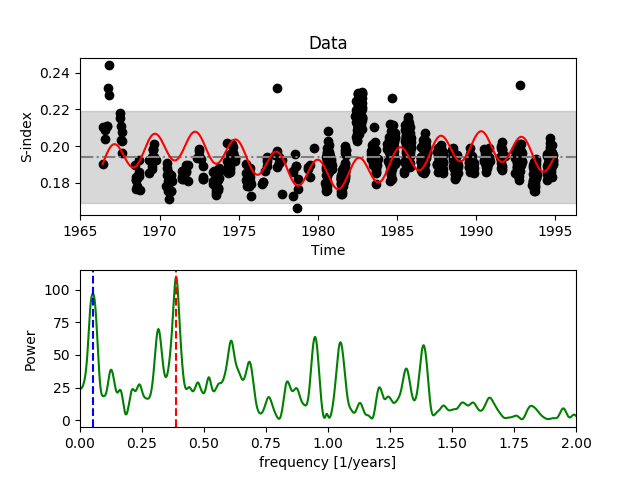
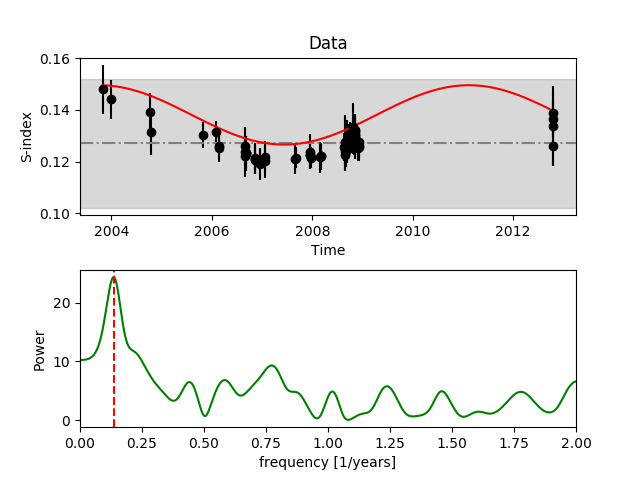
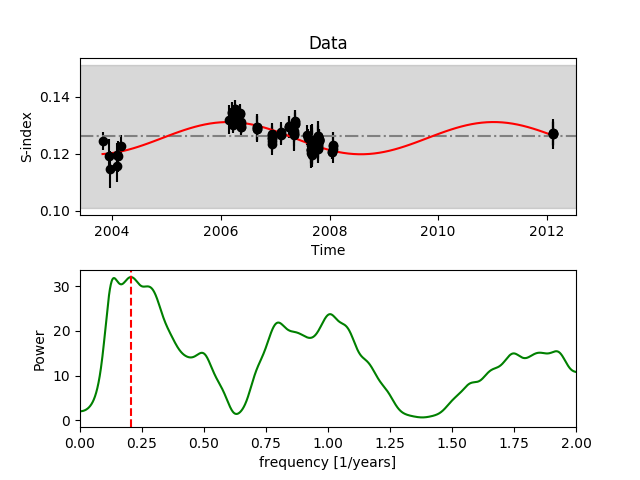
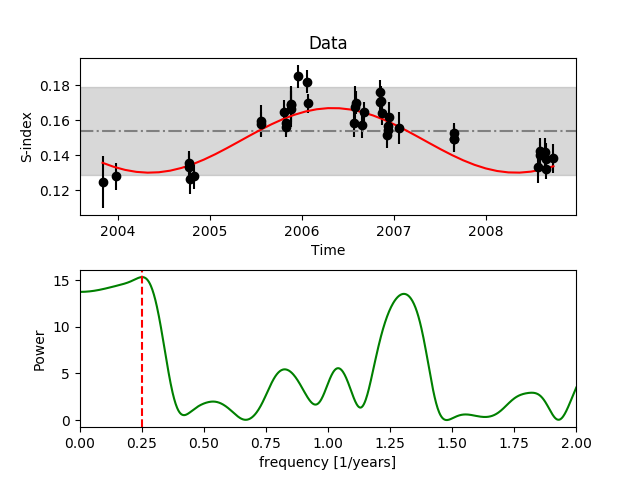
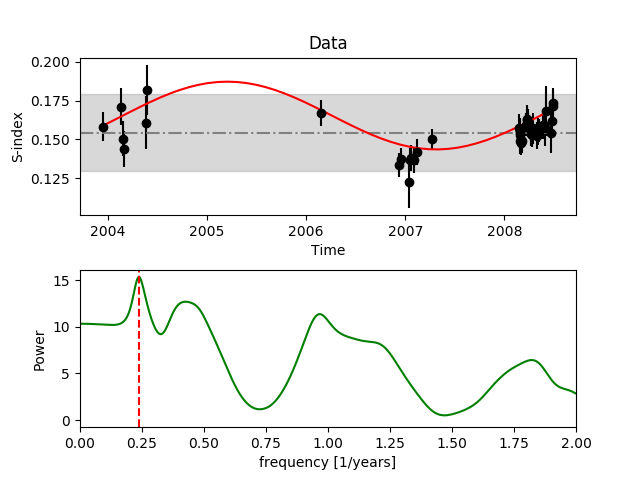
Of the 4454 main-sequence dwarfs in the catalogue, only the Mount Wilson and HARPS surveys have multi-epoch observations suitable for a period search (1131 stars). The majority of these 1131 stars had to be discarded due to the limited number of observations and the non-detection of a periodic signal, resulting in only 53 stars with identified periods. To investigate stellar activity cycles, we used the generalised Lomb-Scargle periodogram (Zechmeister & Kürster 2009). Unlike the standard Lomb-Scargle method (Lomb 1976; Scargle 1982), this technique accounts for the observational uncertainties and allows a floating mean. This makes the period determination more robust and less prone to aliasing (for a detailed analytic solution to the generalised Lomb-Scargle technique, we refer to Zechmeister & Kürster (2009)). The strongest peak in the periodogram is considered as the period. The uncertainties in the cycle period are calculated by propagating the errors in the periodogram equation.
To determine the statistical significance of the period, we also calculated the false-alarm probability (FAP) of the detected signal. For our purposes, we also performed a ‘visual selection’ where we inspected each time series and only included stars with observations spanning at least four years. Any cycle length longer than 25 years was excluded because that is the limit of a full cycle recovery based on the observational time span of the surveys. We also excluded cycle periods that were shorter than two years because with increasingly shorter period, it becomes difficult to distinguish between the rotation period and the activity-cycle period. Additionally, the sampling is not robust enough to confirm periods shorter than two years. There is one exception to this rule, however: HD115043. This star has a probable cycle period of 1.6 years and a low FAP. This is the only star in the sample to show a cycle period shorter than two years.
4.2 Activity-cycle classification
Determining the presence of an activity cycle based on the period search algorithm alone comes with caveats. Since the only robust point of reference of an activity cycle is the solar cycle, we assumed the stellar activity cycle to be sinusoidal. However, in the case of the Sun, several other cycles are also detected, although they are much weaker than the dominant 11-year cycle. Multiple cycle periods instead of one clear activity cycle have also been detected in a few other cool stars (Baliunas et al. 1995; Böhm-Vitense 2007; Saar & Brandenburg 1999; Oláh et al. 2016). Oláh et al. (2016) found that multiple cycles are most likely to be detected in fast-rotating stars.
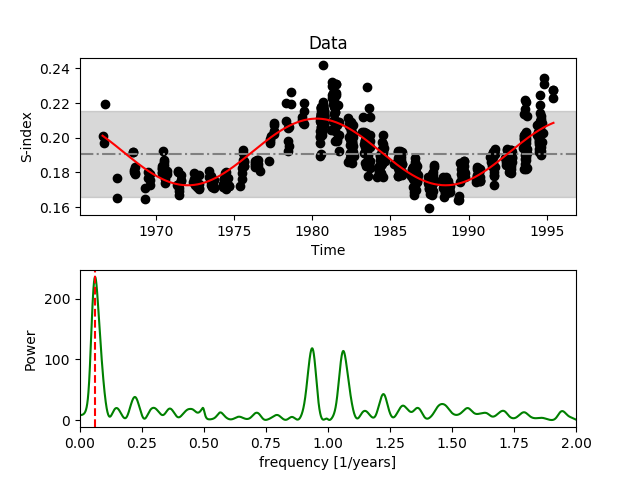
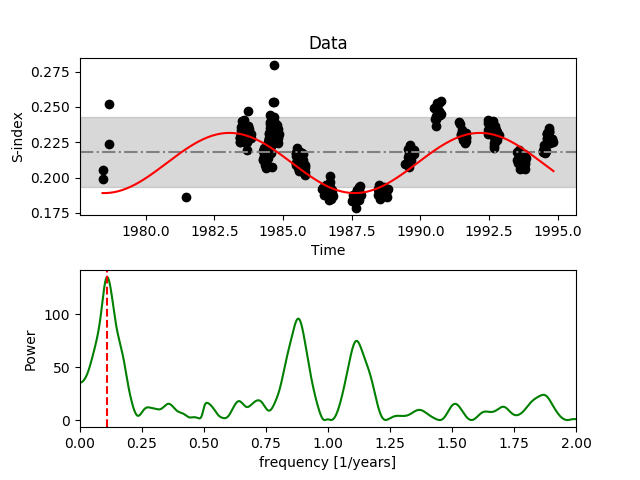
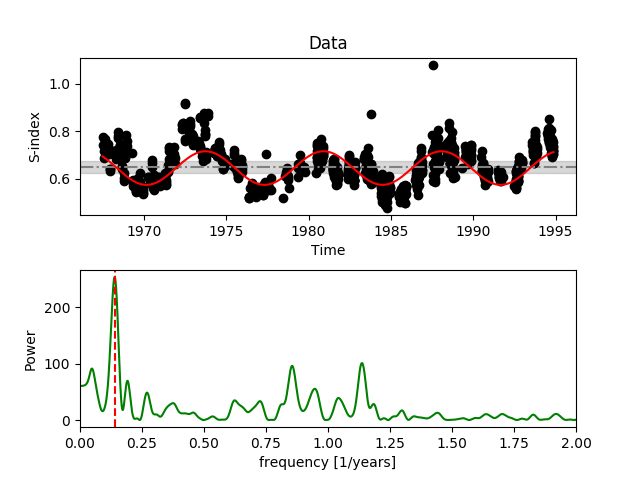
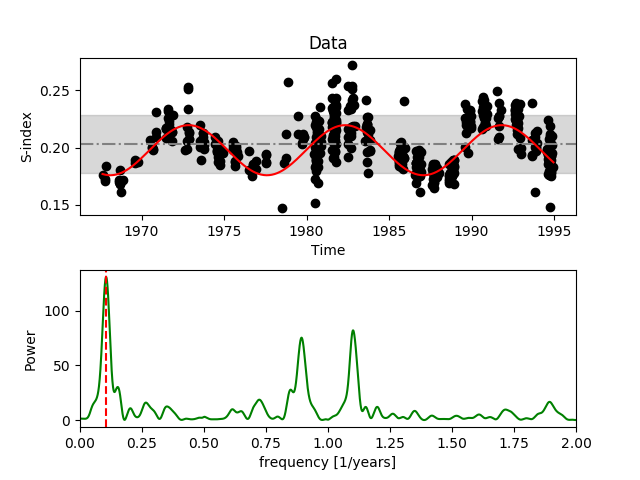
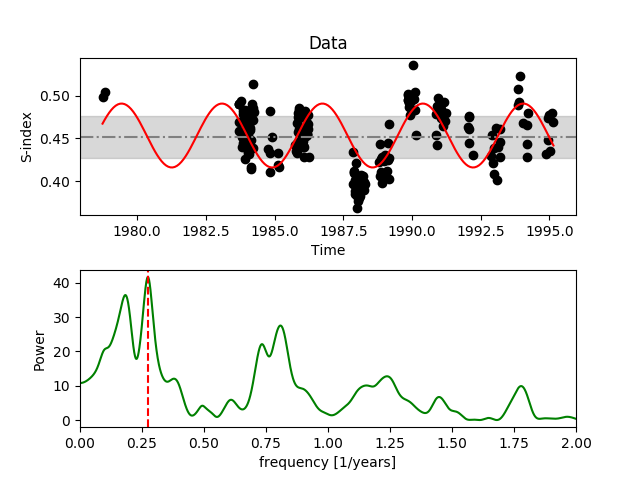
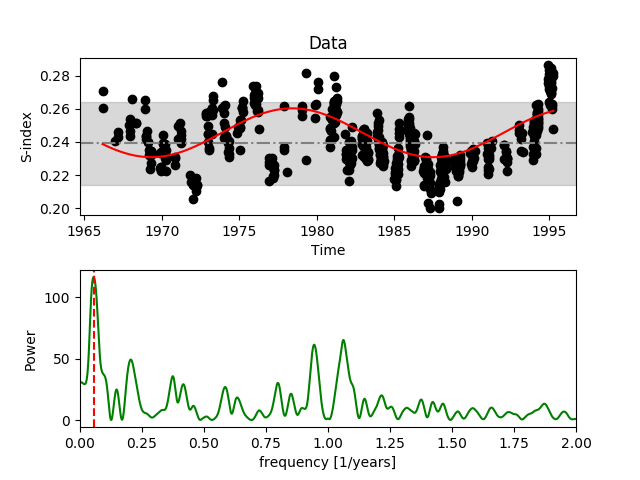
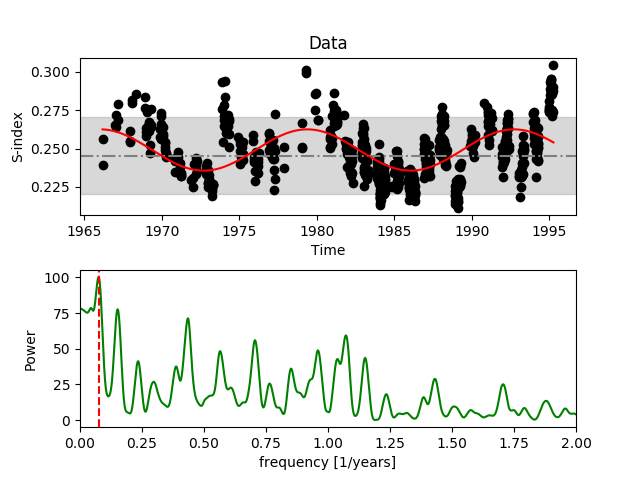
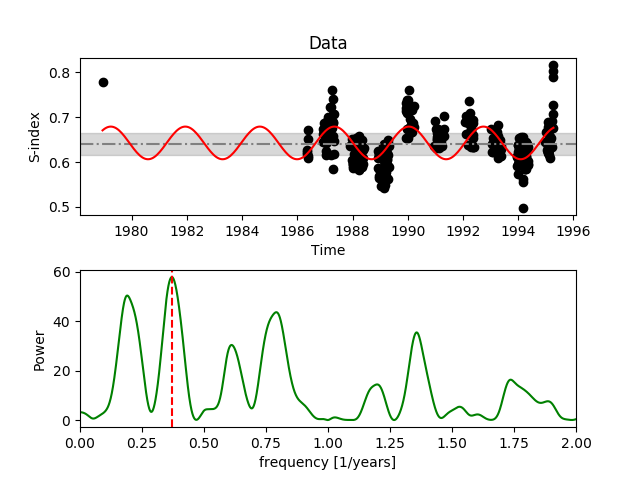
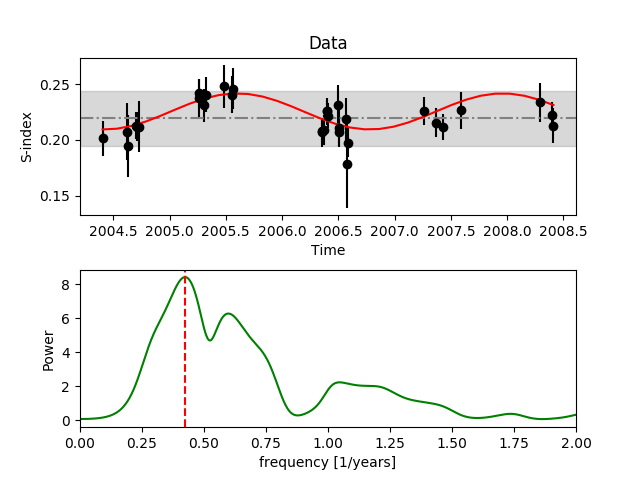
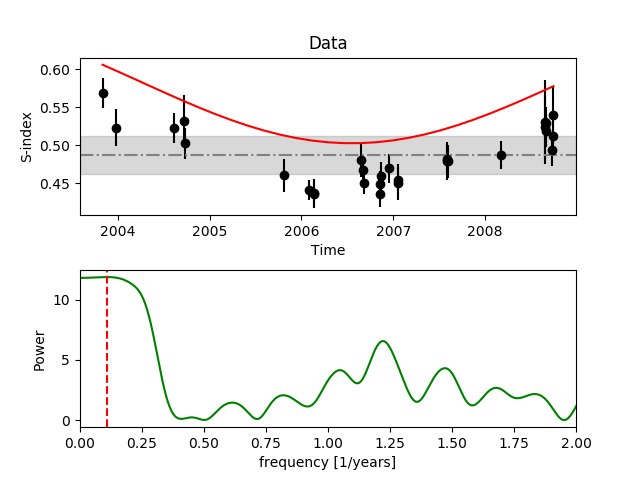
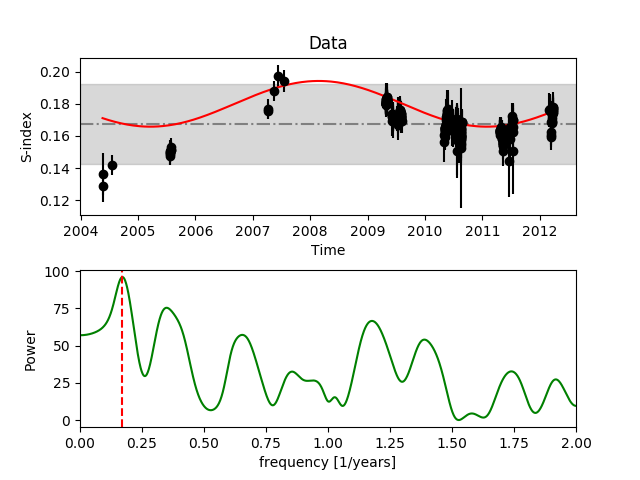
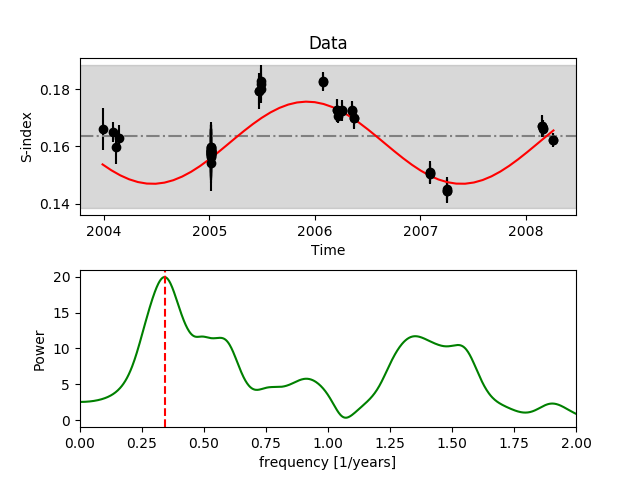
Our analysis showed that while some stars exhibit solar-like activity cycles, some show irregular cycles; irregular cycles were also reported by Baliunas et al. (1995). We divided the stars into three categories: Class A (CA), Class B (CB), and Class C (CC); they are listed in Table 3.3. Four factors were considered for classifying the stars: (i) visual confirmation of the signal, where the periodic signal can be easily detected; (ii) amplitude of the periodic signal, where the amplitude is at least similar to the solar case; (iii) repetition of the signal over the time series, to confirm that it is indeed a regular cycle; and (iv) the FAP of the periodic signal. A considerable difference in the FAP is seen for stars belonging to the three groups. A brief description of the three categories is given below.
CA: Stars with well-defined cycles
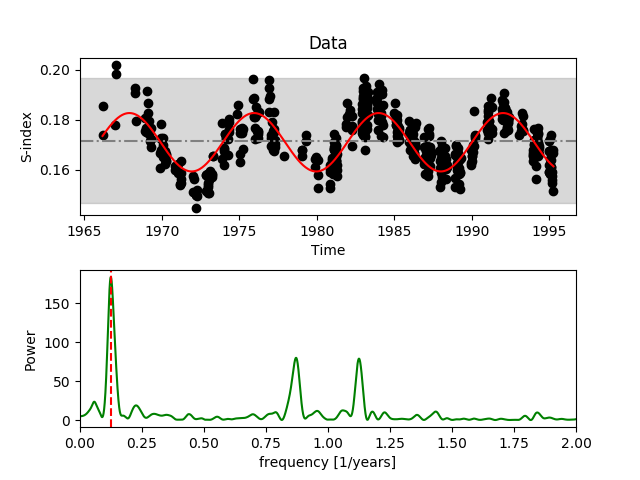
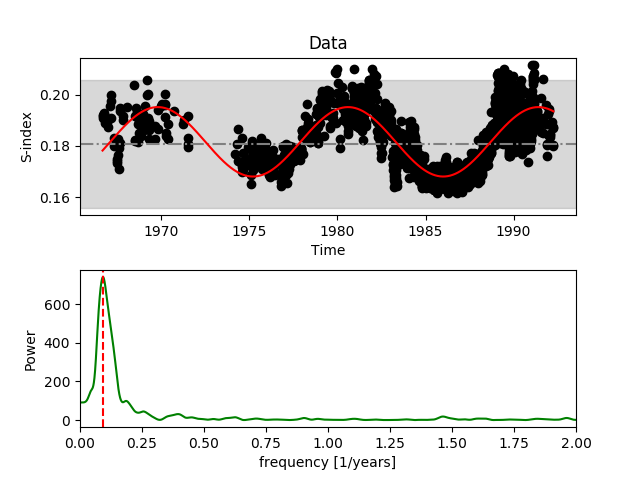
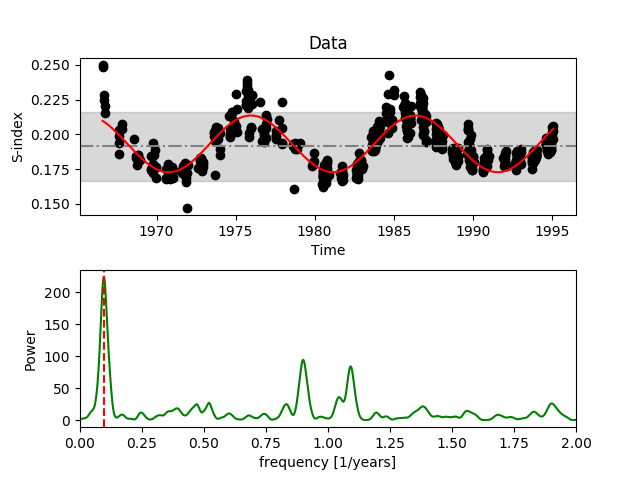
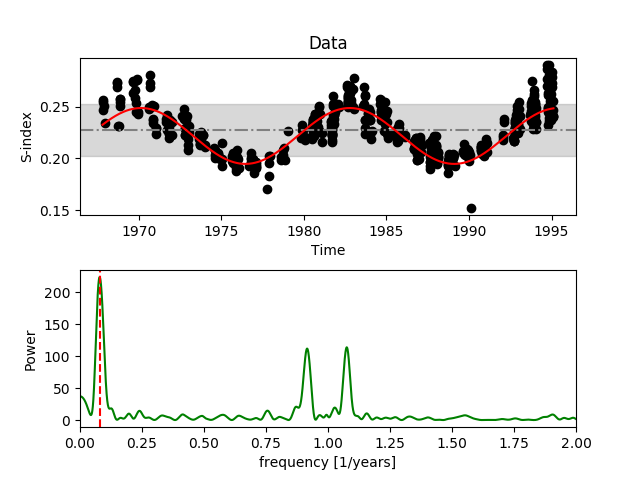
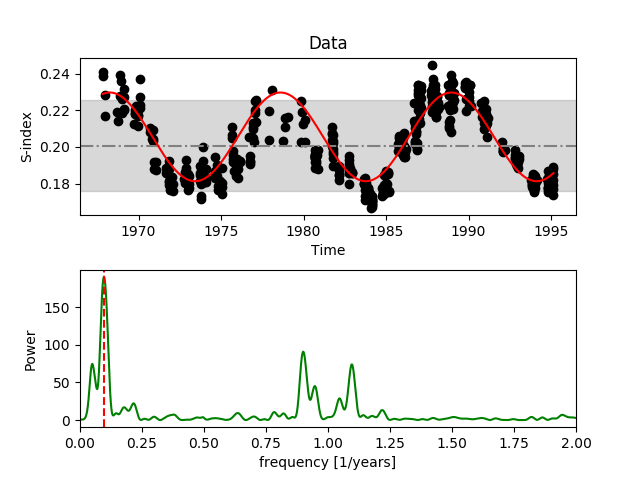
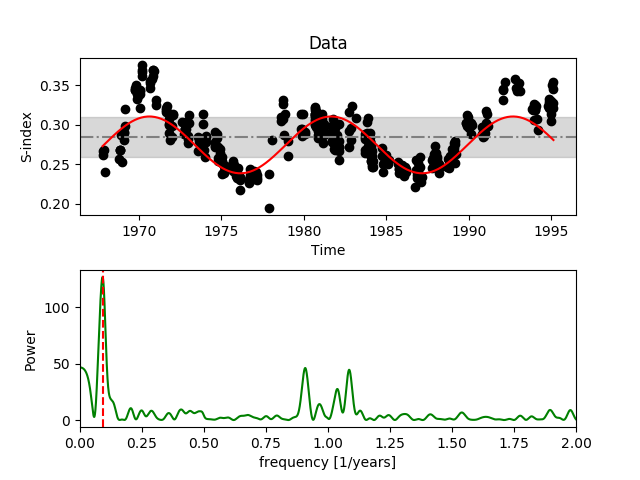
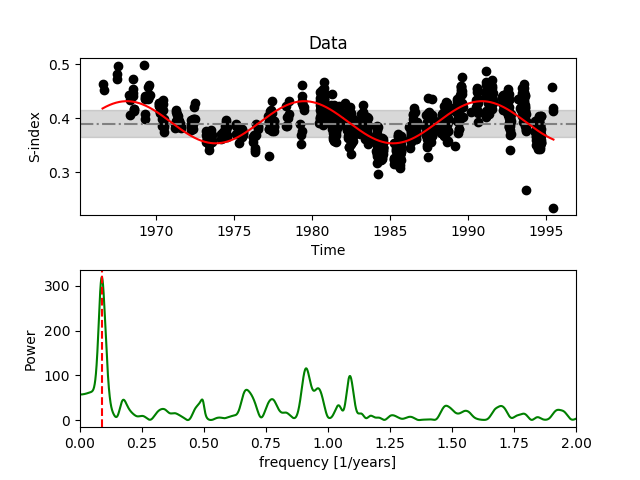
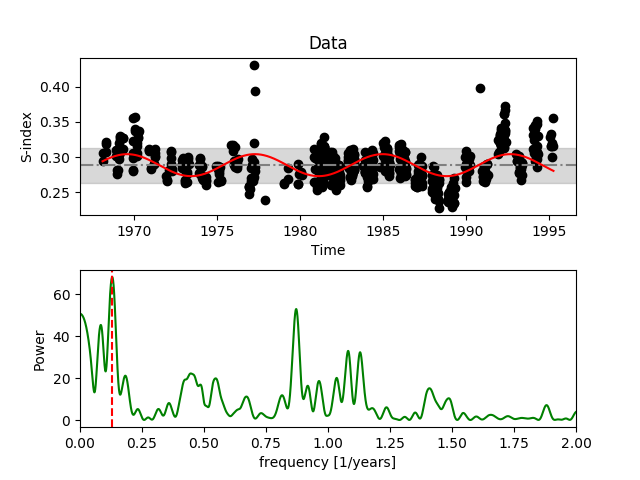
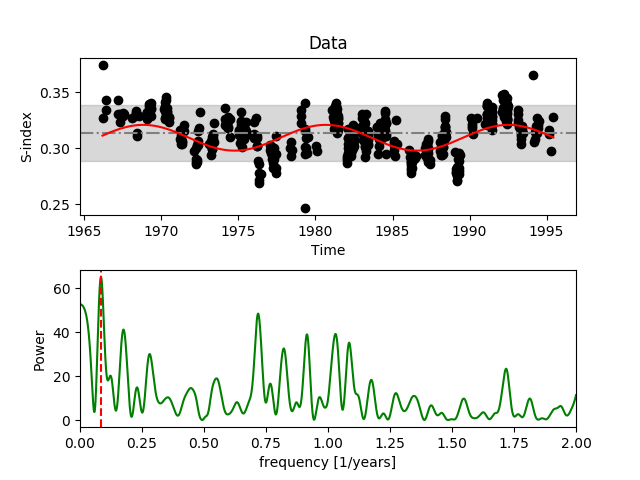
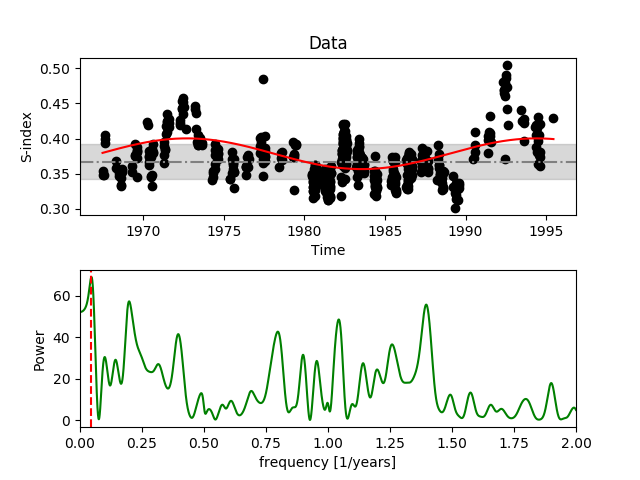
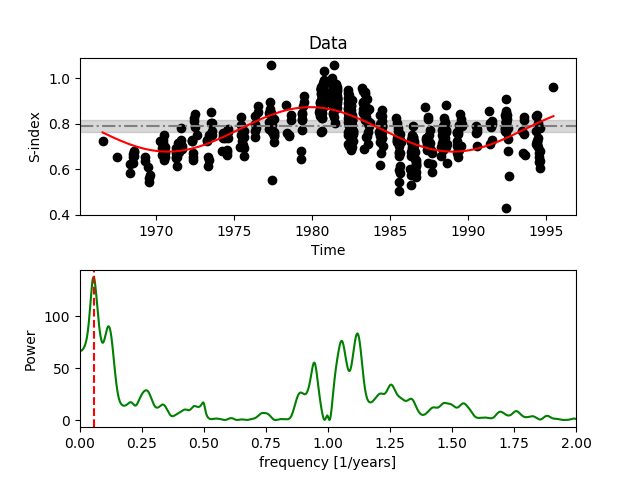
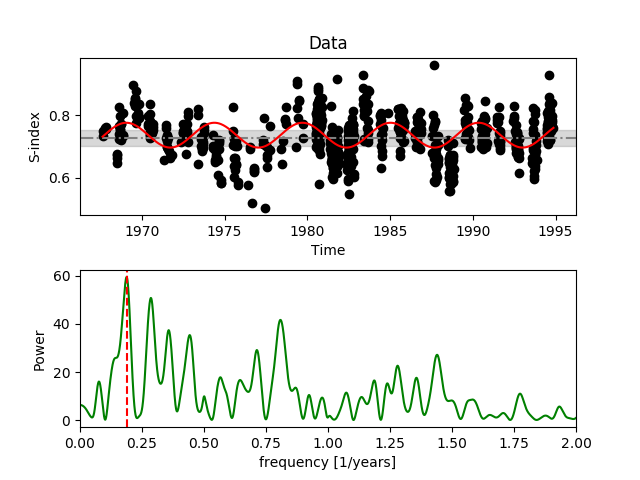
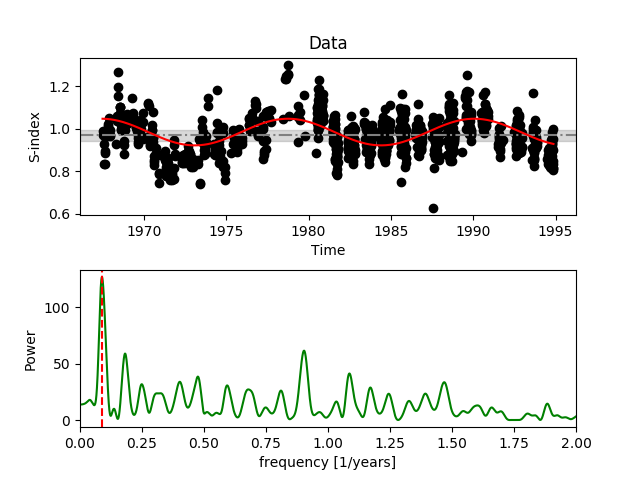
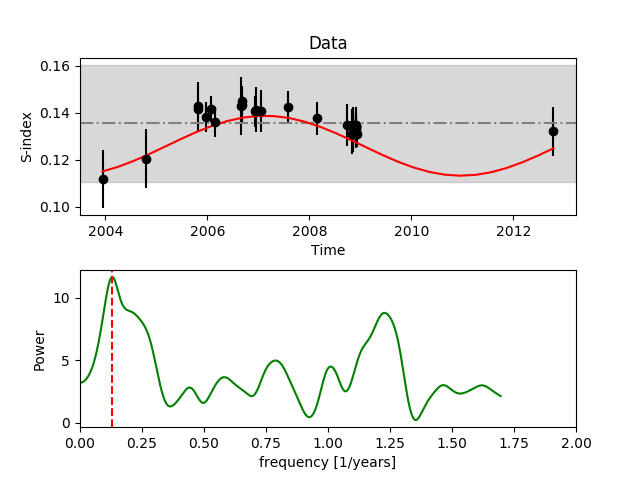
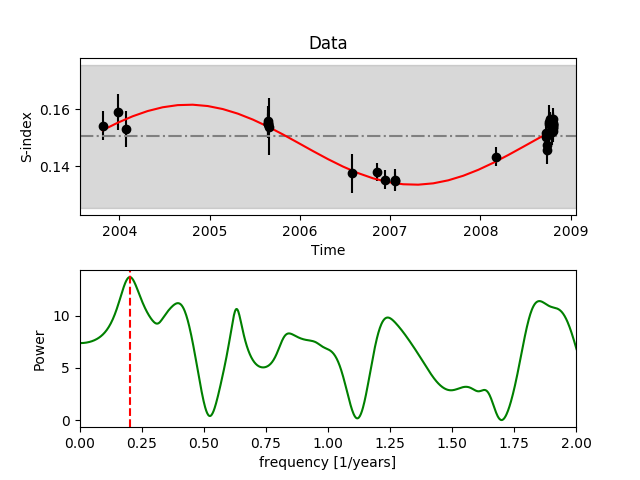
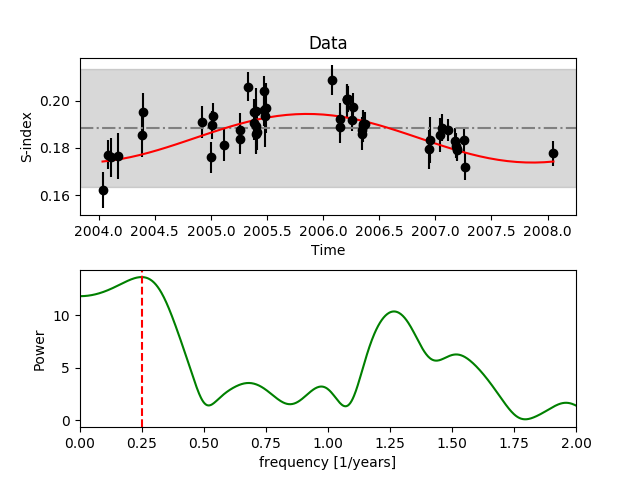
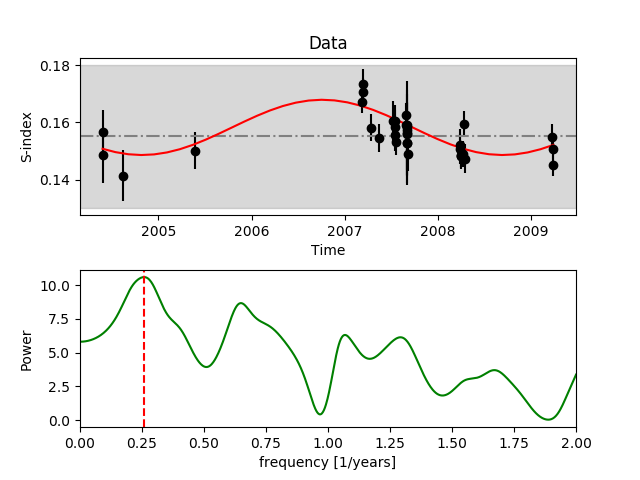
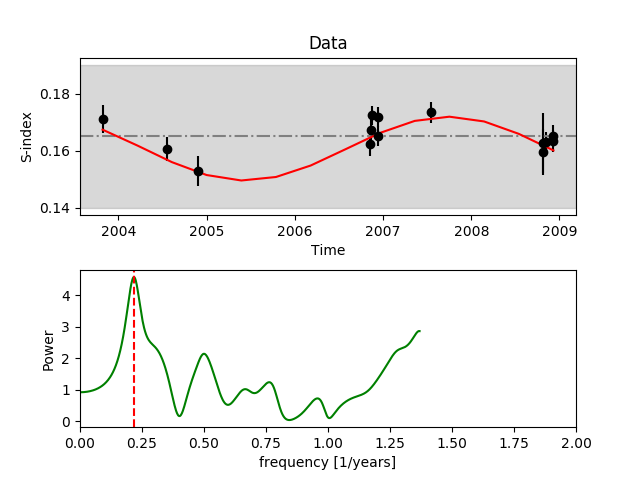
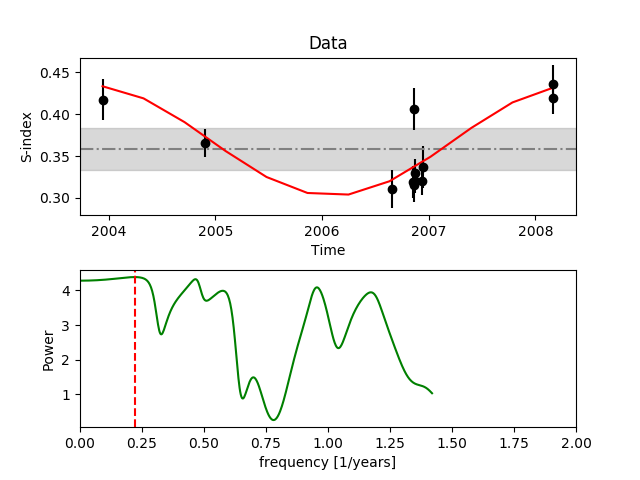
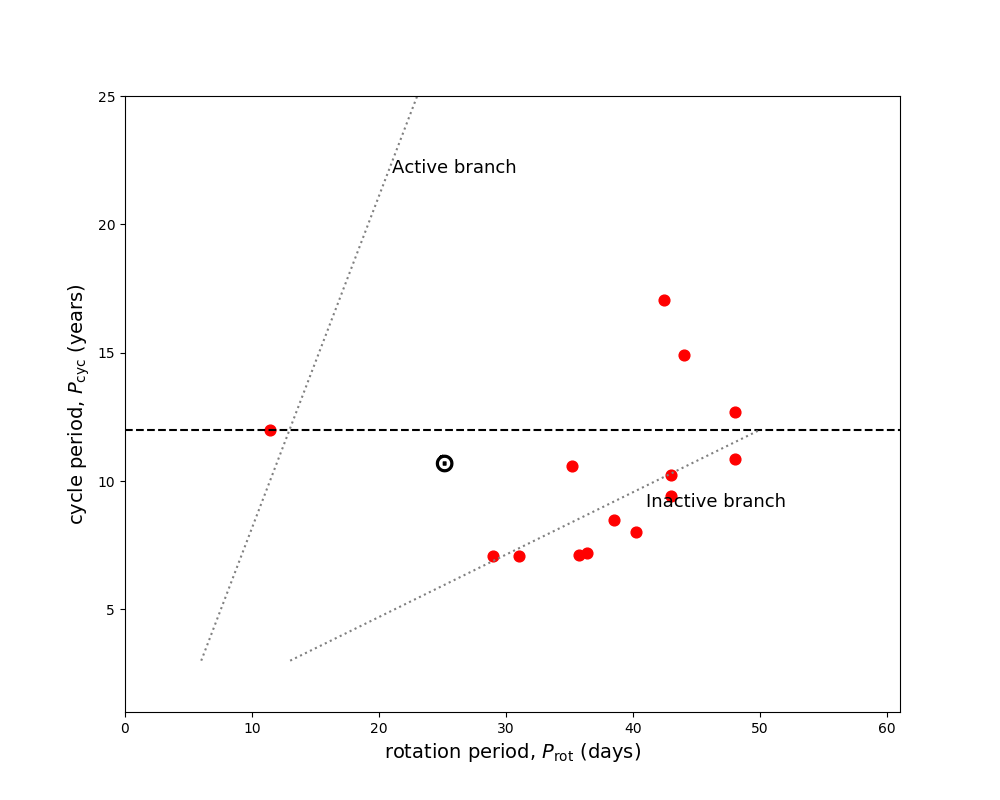
Stars that show a clear solar-like sinusoidal activity cycle are included in this category. Figure 5 shows an example where the cycle period is repeated in the long-term observations and the amplitude of the cycle is at least similar to the solar case. This provides additional confidence in the activity-cycle period. As shown in Table 3.3, the majority of these stars (a total of 15 stars including the Sun) are slowly rotating stars with rotation periods equivalent to or longer than the solar rotation period. Only HD152391 has a rotation period shorter than 12 days, and is not classified as an inactive branch star by Saar & Brandenburg (1999) either. The time series and corresponding fit from the period search for these well-defined cycles are shown in Fig. 14. The stars belonging to this category were taken from the Mount Wilson survey. A secondary period close to one year is also detected in a majority of these stars. This is not a cycle period but a harmonics seen due to the nature of the seasonal observations.
CB: Stars with multiple or chaotic cycles
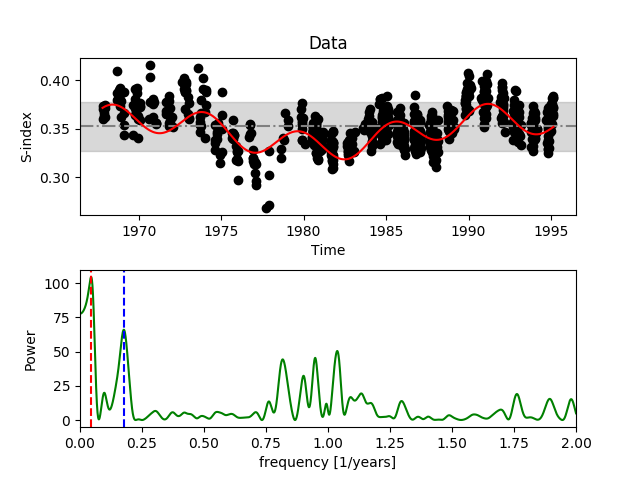
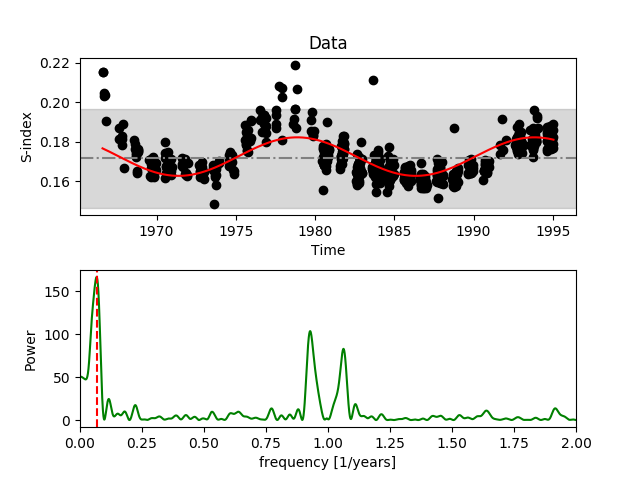
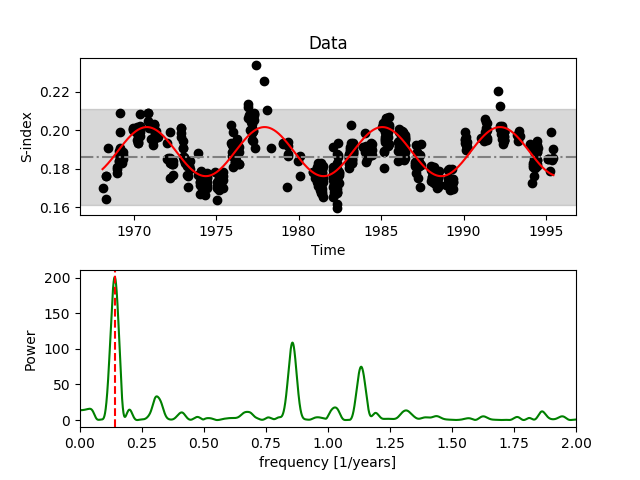
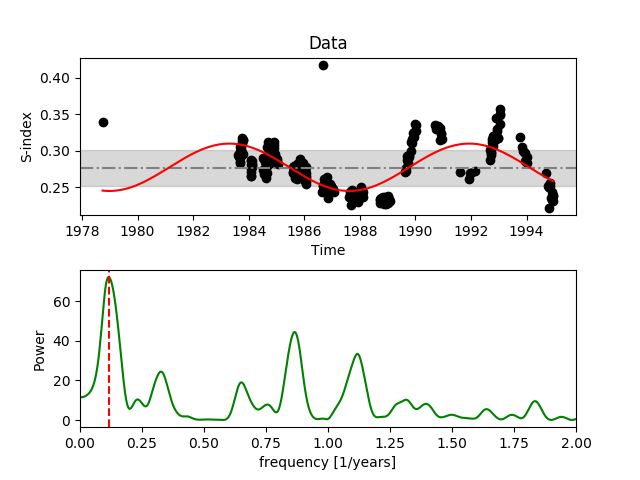
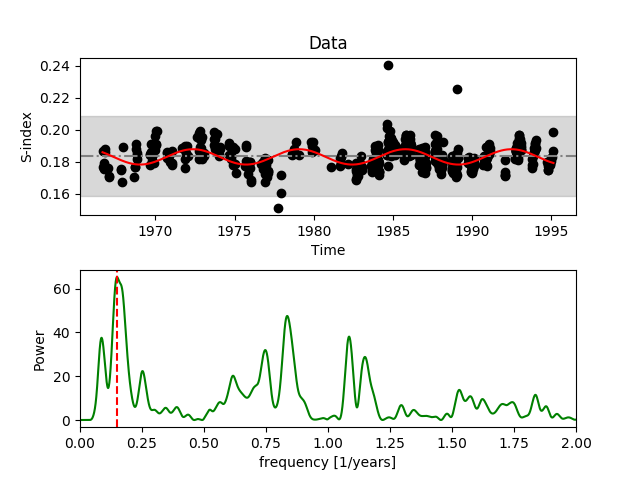
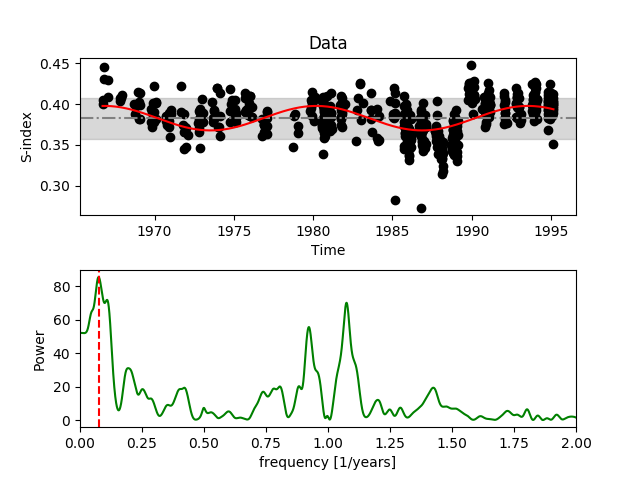
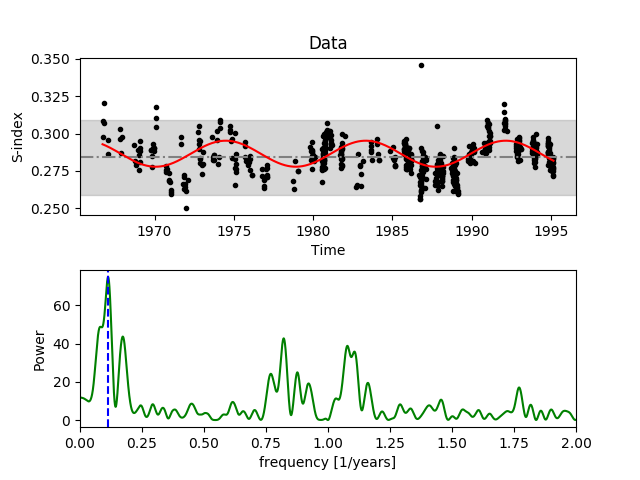
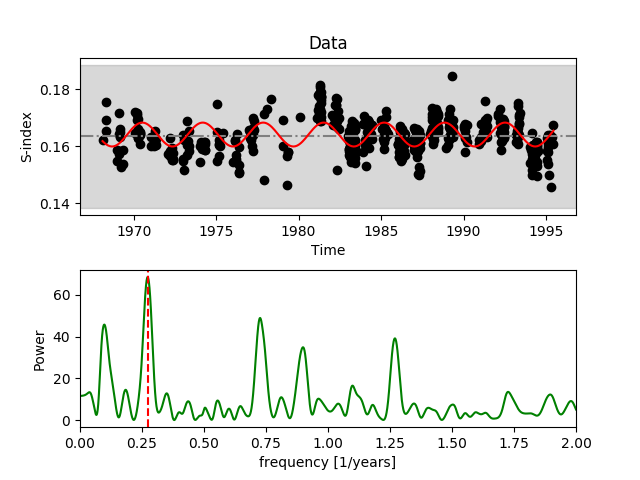
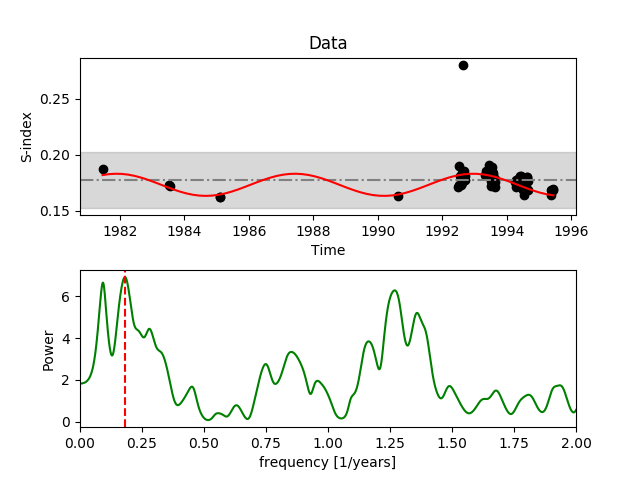
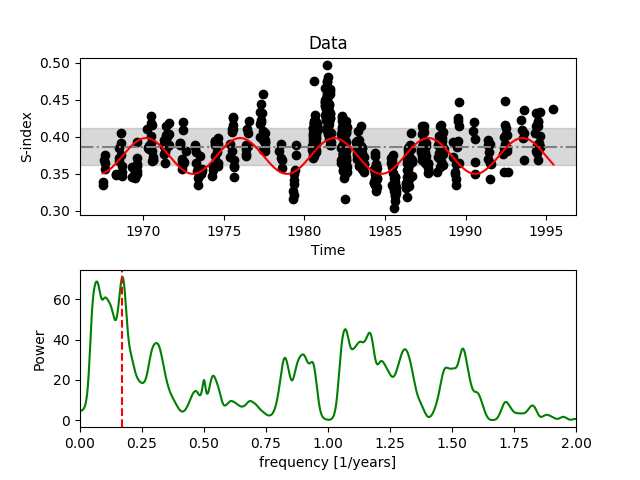
This group of stars shows chaotic or multiple cycles. An example of such a star is shown in Fig. 6. There are only five stars in this group, and they are taken from the NSO Mount Wilson survey. Although a few other stars exhibited possible multiple periodicity, their FAPs were not reliable for the secondary periods. Additionally, they could be aliases and were discarded. A further detailed analysis is required for some individual stars to confirm their multiple periods. The time series and the corresponding periodograms are shown in Fig 15.
CC: Stars with unconfirmed cycles
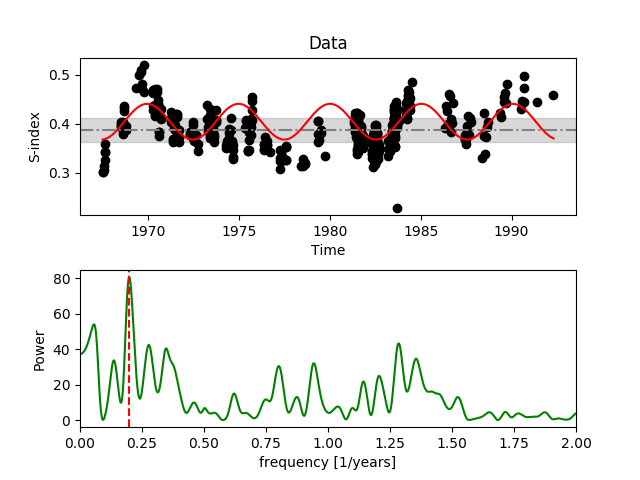
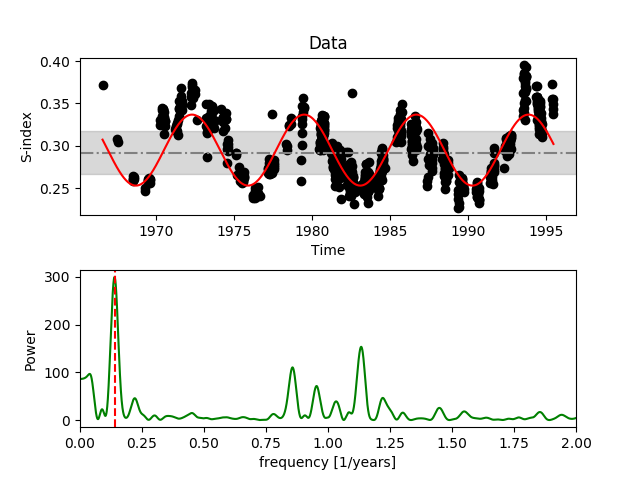
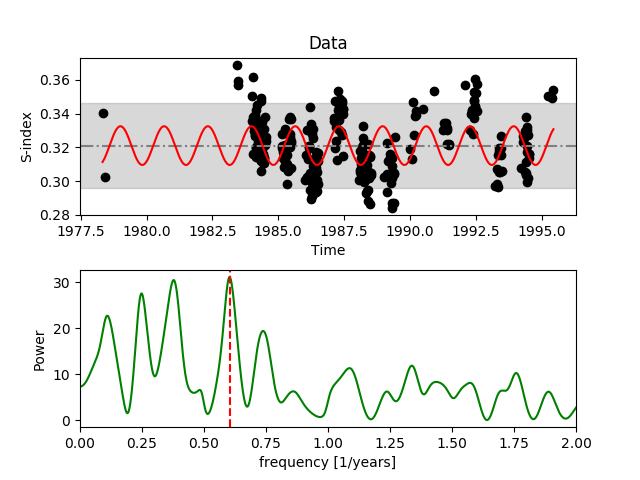
The stars in this category exhibit possible solar-like cycle periods. Thirty-three stars fall in this category. The confidence level in the FAP, the amplitude of the signal, or the sampling are too low for them to be included in the CA category. An example of such a cycle is shown in Fig. 7. Further observations are required to confirm the nature of these activity cycles. Both Mount Wilson and HARPS stars can be found in this category. Figs. 16 and 17 show the time series of these stars.
5 Long-term evolution of chromospheric activity versus rotation
Previously, Saar & Brandenburg (1999); Böhm-Vitense (2007) have shown that there is a possible relationship between activity-cycle period and rotation period, and the stellar activity cycles classify stars into two branches. We investigate the activity cycle versus rotation relation for the cycle periods determined in this work.
5.1 versus
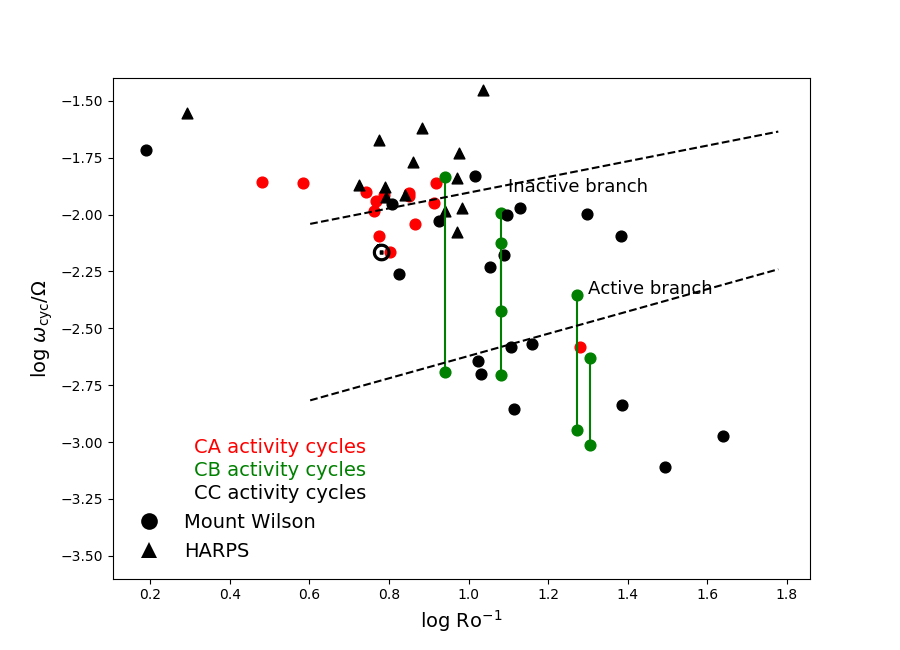
To investigate the rotation versus activity-cycle period relation, we list our stars in Table 3.3 in the versus Ro-1 plane (see Fig. 8), similar to Fig. 1 of Saar & Brandenburg (1999). Following the definition of Noyes et al. (1984a), the number used here is determined using an empirically determined . The used by Saar & Brandenburg (1999) in their analysis is theoretically determined. Since the empirical of Noyes et al. (1984a) and theoretical of Saar & Brandenburg (1999) are in good agreement (see Fig 3. in Saar & Brandenburg (1999)), we used the Noyes et al. (1984a) definition. Based on the Mount Wilson long-term survey, previous work investigating activity cycles in cool stars has shown that stars are segregated into two branches, the active and inactive branch (Saar & Brandenburg 1999; Brandenburg et al. 1998; Böhm-Vitense 2007). They also noted that there is a clear lack of stars in between these two branches.
It is worth noting that the following stars from Saar & Brandenburg (1999) are not included in our analysis: HD98230B is excluded because of the lack of available data, HD187691 is excluded because of the lack of significant variability in its S-index values, and HD154417 was excluded as the measured cycle periods fall outside of our selection boundary. The stars marked with a dagger in Table 3.3 are the stars that have previously been published by Saar & Brandenburg (1999). 444Not all the entries in Table 1 of Saar & Brandenburg (1999) were included in their analysis. They stated that they only included stars with weights greater than 0. The cycle periods of some of our common stars vary from the periods in Table 1 of Saar & Brandenburg (1999). This discrepancy is most likely caused by the difference in the data used because Saar & Brandenburg (1999) also used results from Radick et al. (1998), which are not included in our analysis. Additionally, we used the new release of the Mount Wilson sample, which has more observations. Overall, our results are consistent with those of Baliunas et al. (1995), except in a few cases. In this version of the generalised Lomb-Scargle periodogram, measurement errors are weighted and an offset is introduced to account for the floating mean. These modifications make it a more robust algorithm than the periodogram (Scargle 1982) used in Baliunas et al. (1995).
Figure 8 shows that stars with clear activity cycles (CA), including our Sun, all lie on the inactive branch, except for one star that lies on the active branch of Saar & Brandenburg (1999). Almost all stars with cycles classified as CA have 1. Mount Wilson stars whose cycles fall in the CB and CC category mostly exhibit 1, and some of them populate the intermediate region between the active and inactive branch. Two of the five CB stars exhibit cycle periods that alternate between the inactive branch and the active branch. The primary and secondary periods of HD149661 lie in the intermediate region. The primary and secondary cycles of HD1835 and HD20630 lie outside the active branch. The CC stars are spread throughout the rotation and cycle period plane. The HARPS CC stars lie close to the inactive branch. The Mount Wilson CC stars, on the other hand, can be found around the inactive branch, the active branch, and the intermediate region.
When the three classifications (CA, CB, and CC) are combined, no clear distinction between the inactive and active branch is detected. Figure 8 also shows that log decreases with increasing log . This linear trend is not a physical effect and is caused by the selection bias. Based on our selection criteria, the stars with cycle periods shorter than 1.6 years and greater than 25 years were not included in our analysis. This creates the effect in Fig 8. Our results show that stellar activity cycles could lie in the intermediate region between the active and inactive branches. It is hard to discern where the inactive branch ends and the active branch begins. Figure 8 does not show any clear indication of the positive slopes that have been proposed for the activity branches, unless we only focus on the stars classified as CA. If we do not include the CB and CC stars, then only the inactive branch stars are left. This strengthens our argument that the classification into active or inactive branches might not be a true representation of the complex relationship between cycle periods and stellar rotation.
Our results are in qualitative agreement with the recent results of Olspert et al. (2017), where the authors find an indication of an inactive branch, but not an active branch by re-analysing the Mount Wilson sample. Furthermore, recent numerical studies of global convective dynamo simulations for a wide range of rotation rates find no indication of activity branches (Viviani et al. 2017; Warnecke 2017). In these studies, the distribution of dynamo cycles also agrees well with the one found in this work, see in particular Figure 9 of Warnecke (2017).
5.2 versus
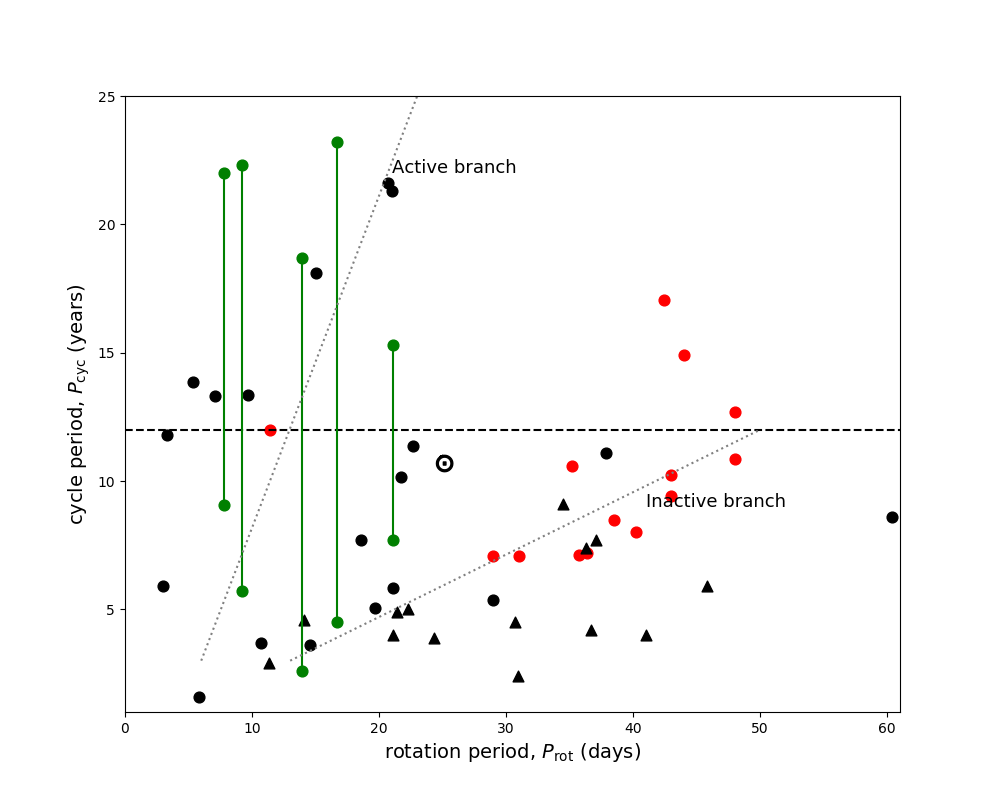
In order to investigate the magnetic activity cycles versus rotation relation independent of any empirical trend, we plot the activity-cycle period as a function of rotation period similar to Fig. 1 in Böhm-Vitense (2007). Figure 9 shows that the well-defined cycles, classified as CA, mostly lie on the inactive branch of stellar cycles. However, the active branch of stellar cycles is less distinct than other studies. Additionally, for the first time, the region around the Sun is populated. We also detect stellar cycles that lie in the lower regions of the inactive branch. However, these stars are classified as CC, and care should be taken as further observations are required to be certain.
Previous work by Böhm-Vitense (2007) showed that stellar activity cycles are clearly separated into active and inactive branches, and activity cycles of stars on the active branch can migrate to the inactive branch. Our results show that a limited number of stars exhibit multiple cycles, and only two of these show cycle periods migrate from the inactive branch to the active branch. The multiple periods of one star lie in the intermediate region, where the Sun is accompanied by a few other stars. Furthermore, the inclusion of the HARPS stars shows that stars could also lie in the region below the inactive branch, which makes it hard to clearly classify activity cycles into branches. Figure 9 also shows that stellar activity cycles cannot be clearly divided into two branches. Only stars classified as CA exhibit a possible linear trend with rotation. The linear trend disappears when CB and CC stars are also included in the analysis. Finally, if we only consider the CA stars in Fig. 9, then the linear trend on the inactive branch could have a different slope (see Appendix 18). Under these conditions, the Sun appears to lie much closer to the inactive branch. In both cases, whether we consider the three different classifications or the CA classification alone, the active branch appears to be very weak and non-existent.
5.3 Multiple periodicity in some stars
In addition to the clear solar-like cycles detected in the CA stars, multiple cycles were also observed in Figs. 8 and 9. Multiple cycles are observed on stars rotating faster than the Sun. The solar cycle used here is determined from chromospheric activity measurements. Long-term monitoring of solar activity has shown that although the solar cycle is cyclic in nature, it is not purely periodic. The Sun also exhibits several cycles that are not as dominant as the 11-year cycle (see Solanki et al. 2006, for more details on solar activity). For example, the long-term modulation of the sunspot numbers also indicates an 80-year cycle known as the Gleissberg cycle, as well as periodicities of 51.34 years, 8.83 years, and 3.77 years that are seen in the difference in activity levels between the two hemispheres (see Deng et al. 2016). When viewed as a star from the ecliptic, the north-south asymmetries cancel, and we are left with only the 11-year activity cycle (and periodicities associated with its longer term modulation). However, when viewed from outside of the ecliptic, the north-south asymmetries no longer exactly compensate for each other, and a number of additional frequencies are expected. The amplitude of the Sun’s activity cycle, as seen in sunspots, is considerably higher than the amplitude of these other cycles, but this comparison is based on data that include the current grand maximum (Solanki et al. 2004), and it does not take into account that the amplitude of the other cycles varies strongly in time (Deng et al. 2016). In other stars, and at other times for the Sun, it is possible that the relative amplitudes of all these cycles could be different. Hence, the presence of multiple cycles in some stars is not surprising and is most likely caused by various factors: inclination, complex magnetic field geometry, observational epoch, or any combination of the three.
We ran the generalised Lomb Scargle periodogram on the solar S-index data but were only able to detect the activity cycle of 10.7 years. This cycle period is in agreement with the sunspot cycle of 11 years. We did not detect any multiple periodicity on the S-index time series. The data were not sampled at a high enough cadence to detect these shorter and much weaker additional periodicities.
6 Comparison with results from Zeeman Doppler imaging
One theory explaining the division of activity cycles into two branches is that two different magnetic geometries are sustained by two different dynamo mechanisms (Böhm-Vitense 2007). In order to investigate the magnetic geometry of stars in Figs. 8 and 9, the Zeeman Doppler imaging (ZDI) technique has to be used. ZDI is the only technique that can reconstruct the large-scale surface magnetic geometry of cool stars. One way of comparing if stars have similar magnetic geometry is to investigate if their surface magnetic field geometry is poloidal or toroidal. ZDI reconstructs magnetic field geometries in the spherical harmonics frame, which allows us to express the magnetic field in its poloidal and toroidal field components.
The magnetic field geometry of stars along the inactive and active branches was studied by See et al. (2016) on 12 ZDI targets, only 5 of which had observations spanning multiple epochs. See et al. (2016) showed that the stars that lie on the active branch exhibit strong toroidal geometry. However strong poloidal geometry is also detected for a few active branch stars (Hackman et al. 2016; Rosén et al. 2016). For active stars with multi-epoch observations, the toroidal fraction exhibits strong modulation over time and sometimes changes to strong poloidal field components, although one active branch star, HD78366, shows a strong poloidal field that remains consistently poloidal over several years of observations (Morgenthaler et al. 2011), (Jeffers et al. 2018 (in prep)).
Stars on the inactive branch, on the other hand, exhibit strong poloidal geometry. However, the sample size of stars on the inactive branch is much smaller: there are only four stars. Additionally, it is not fully known if there is any modulation in the poloidal fraction over time. Only one star was observed over multiple epochs; this was 61 Cyg A (Boro Saikia et al. 2016). This star shows a slight increase in its toroidal fraction over its activity cycle. Young fast-rotating solar-type stars such as HD206860 (Boro Saikia et al. 2015) and Ceti (do Nascimento et al. 2016), however, exhibit a complex large-scale magnetic geometry with a significant toroidal component. For comparison, the Sun has a strong poloidal field, and its large-scale field is more than 90 poloidal at the surface (Vidotto 2016).
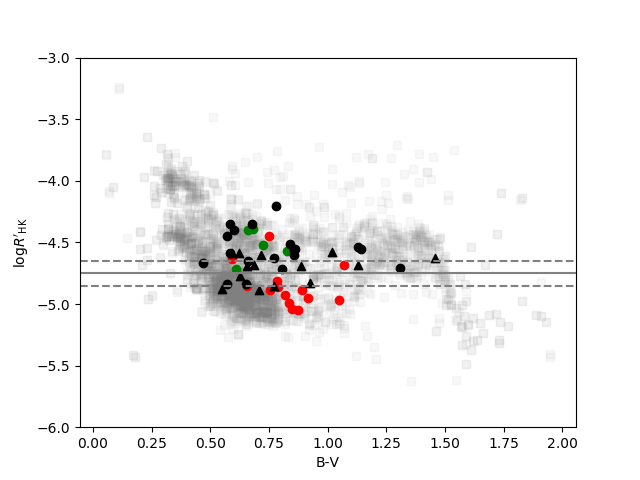
Recent work by Metcalfe et al. (2016) investigated the magnetic topology of a handful of solar analogues that have also been observed using the Kepler satellite. The results of Metcalfe et al. (2016) show that there is a difference in field geometry for stars above and below the Vaughan-Preston gap and also for stars that lie on the active and inactive branches. However, one should be careful while interpreting the results, as the Vaughan-Preston gap and the active and inactive branch do not refer to the same phenomena, as shown by Fig. 19, where the gaps in the two cases are not the same. It is clearly shown that stars that lie on the inactive branch (red symbols) do not necessarily lie on the inactive side of the gap, which would be the case if the Vaughan-Preston gap and the inactive and active branch were the same. The Vaughan-Preston gap is produced by the lack of stars with intermediate chromospheric activity, whereas the separation into inactive and active branches is made as a result of the lack of stars with activity-cycle periods that lie in the empty region near the Sun. Furthermore, the magnetic geometry sample used in Metcalfe et al. (2016) is very limited. The stars they included only show limited epochs and in some cases only one observation epoch. This might be highly misleading in this context, as the poloidal and toroidal fraction for a single star is known to change quite significantly over time, and the sample is too small to have any statistical significance.
The magnetic field topology changes even for the Sun from a more simple dipolar field to a more complex higher-order field during one activity cycle. For solar analogues the field geometry could change dramatically from one month to the next (Jeffers et al. 2017). For example, the field geometry could exhibit a strong poloidal field in one epoch, but turn into a toroidal field in a matter of a few months (See et al. 2015; Jeffers et al. 2017). Hence, it is very important to monitor stars over the long term to understand whether the magnetic geometry is indeed different for stars with different levels of activity. Understanding the evolution of magnetic field geometry during the dynamo-operated activity cycle of a star is necessary to be able to determine whether the dynamo is indeed different for stars in the cycle period-rotation plane.
7 Conclusions
We introduced a chromospheric activity catalogue of 4454 cool stars. We explored the Vaughan-Preston gap for the stars in our catalogue. We also investigated the relationship between activity-cycle period and rotation period in a selected sample of stars. Our main conclusions are listed below.
-
•
The ratio of chromospheric to bolometric flux, , as a function of shows that the Vaughan-Preston gap is not as significant as previously thought; this distinction was made possible by our very large catalogue of stars. If the gap is indeed not real, then it suggests that main-sequence stars begin their lifetimes with strong activity, and as they spin down, they become less active, finally settling down with a quiescent activity level without any sudden break at intermediate activity. Robust measurements of stellar age and rotation are required for a reliable conclusion. Finally, ZDI magnetic geometry reconstructions of stars across the Vaughan-Preston gap combined with stellar dynamo models are required to investigate if active and inactive stars indeed have two different dynamo mechanisms.
-
•
Stars with well-defined clear activity cycles, cycles classified as CA, predominantly lie on the inactive branch, and they exhibit a possible linear relation with rotation. Stars with cycles classified as CB (multiple cycles) and CC (probable cycles) are scattered on the activity period-rotation plane, even filling the gap near the Sun, making the active branch less distinct. When all classifications of stars are considered, no linear relationship is detected between cycle period and rotation. The weakening of the active branch classification is still prevalent when the CC stars are not included. Our conclusions still stand when we include only the CA stars. Finally, the Sun’s position in the new cycle period-rotation plot indicates that it is not an exception and that its dynamo is most likely not in a transitional phase, as previously suggested.
Acknowledgements.
We thank A. A. Vidotto, M. J. Käpylä, D. Schleicher, M. Zechmeister, and V. See for the fruitful discussions that immensely improved the paper. S.B.S, C.J.M, and S.V.J acknowledge support from the SFB 963 (Projects A4 and A16) funded by the DFG. S.B.S also acknowledges funding via the Austrian Space Application Programme (ASAP) of the Austrian Research Promotion Agency (FFG) within ASAP11, the FWF NFN project S11601-N16 and the sub-project S11604-N16project. J.W. acknowledges funding from the People Programme (Marie Curie Actions) of the European Union’s Seventh Framework Programme (FP7/2007-2013) under REA grant agreement No. 623609. We also thank the Mount Wilson NSO project: the data derive from the Mount Wilson Observatory HK Project, which was supported by both public and private funds through the Carnegie Observatories, the Mount Wilson Institute, and the Harvard-Smithsonian Center for Astrophysics starting in 1966 and continuing for over 36 years. These data are the result of the dedicated work of O. Wilson, A. Vaughan, G. Preston, D. Duncan, S. Baliunas, R. Radick and many others.This research has made use of the VizieR catalogue access tool, CDS, Strasbourg, France. The original description of the VizieR service was published in AAS 143, 23.References
- Anglada-Escudé & Butler (2012) Anglada-Escudé, G. & Butler, R. P. 2012, ApJS, 200, 15
- Arriagada (2011) Arriagada, P. 2011, ApJ, 734, 70
- Baliunas et al. (1995) Baliunas, S. L., Donahue, R. A., Soon, W. H., et al. 1995, ApJ, 438, 269
- Baliunas & Vaughan (1985) Baliunas, S. L. & Vaughan, A. H. 1985, ARA&A, 23, 379
- Böhm-Vitense (2007) Böhm-Vitense, E. 2007, ApJ, 657, 486
- Bonfils et al. (2013) Bonfils, X., Delfosse, X., Udry, S., et al. 2013, A&A, 549, A109
- Boro Saikia et al. (2016) Boro Saikia, S., Jeffers, S. V., Morin, J., et al. 2016, A&A, 594, A29
- Boro Saikia et al. (2015) Boro Saikia, S., Jeffers, S. V., Petit, P., et al. 2015, A&A, 573, A17
- Brandenburg et al. (2017) Brandenburg, A., Mathur, S., & Metcalfe, T. S. 2017, ApJ, 845, 79
- Brandenburg et al. (1998) Brandenburg, A., Saar, S. H., & Turpin, C. R. 1998, ApJ, 498, L51
- Brown et al. (1991) Brown, S. F., Donati, J.-F., Rees, D. E., & Semel, M. 1991, A&A, 250, 463
- Charbonneau (2010) Charbonneau, P. 2010, Living Reviews in Solar Physics, 7, 3
- Deng et al. (2016) Deng, L. H., Xiang, Y. Y., Qu, Z. N., & An, J. M. 2016, AJ, 151, 70
- do Nascimento et al. (2016) do Nascimento, Jr., J.-D., Vidotto, A. A., Petit, P., et al. 2016, ApJ, 820, L15
- Donati et al. (1997) Donati, J.-F., Semel, M., Carter, B. D., Rees, D. E., & Collier Cameron, A. 1997, MNRAS, 291, 658
- Duncan et al. (1991) Duncan, D. K., Vaughan, A. H., Wilson, O. C., et al. 1991, ApJS, 76, 383
- Durney et al. (1981) Durney, B. R., Mihalas, D., & Robinson, R. D. 1981, PASP, 93, 537
- Eberhard & Schwarzschild (1913) Eberhard, G. & Schwarzschild, K. 1913, ApJ, 38
- Egeland et al. (2017) Egeland, R., Soon, W., Baliunas, S., Hall, J. C., & Henry, G. W. 2017, in IAU Symposium, Vol. 328, Living Around Active Stars, ed. D. Nandy, A. Valio, & P. Petit, 329–337
- Gaidos et al. (2000) Gaidos, E. J., Henry, G. W., & Henry, S. M. 2000, AJ, 120, 1006
- Gray (2005) Gray, D. F. 2005, The Observation and Analysis of Stellar Photospheres
- Gray et al. (2006) Gray, R. O., Corbally, C. J., Garrison, R. F., et al. 2006, AJ, 132, 161
- Hackman et al. (2016) Hackman, T., Lehtinen, J., Rosén, L., Kochukhov, O., & Käpylä, M. J. 2016, A&A, 587, A28
- Hall et al. (2009) Hall, J. C., Henry, G. W., Lockwood, G. W., Skiff, B. A., & Saar, S. H. 2009, AJ, 138, 312
- Hartmann et al. (1984) Hartmann, L., Soderblom, D. R., Noyes, R. W., Burnham, N., & Vaughan, A. H. 1984, ApJ, 276, 254
- Hempelmann et al. (2016) Hempelmann, A., Mittag, M., Gonzalez-Perez, J. N., et al. 2016, A&A, 586, A14
- Henry et al. (1996) Henry, T. J., Soderblom, D. R., Donahue, R. A., & Baliunas, S. L. 1996, AJ, 111, 439
- Isaacson & Fischer (2010) Isaacson, H. & Fischer, D. 2010, ApJ, 725, 875
- Jeffers et al. (2017) Jeffers, S. V., Boro Saikia, S., Barnes, J. R., et al. 2017, MNRAS, 471, L96
- Linsky et al. (1979) Linsky, J. L., McClintock, W., Robertson, R. M., & Worden, S. P. 1979, ApJS, 41, 47
- Lomb (1976) Lomb, N. R. 1976, Ap&SS, 39, 447
- Lovis et al. (2011) Lovis, C., Dumusque, X., Santos, N. C., et al. 2011, ArXiv e-prints: 1107.5325
- Messina et al. (1999) Messina, S., Guinan, E. F., Lanza, A. F., & Ambruster, C. 1999, A&A, 347, 249
- Metcalfe et al. (2016) Metcalfe, T. S., Egeland, R., & van Saders, J. 2016, ApJ, 826, L2
- Middelkoop (1982) Middelkoop, F. 1982, A&A, 107, 31
- Mittag et al. (2013) Mittag, M., Schmitt, J. H. M. M., & Schröder, K.-P. 2013, A&A, 549, A117
- Mohanty & Basri (2003) Mohanty, S. & Basri, G. 2003, ApJ, 583, 451
- Mohanty et al. (2002) Mohanty, S., Basri, G., Shu, F., Allard, F., & Chabrier, G. 2002, ApJ, 571, 469
- Morgenthaler et al. (2011) Morgenthaler, A., Petit, P., Morin, J., et al. 2011, Astronomische Nachrichten, 332, 866
- Noyes et al. (1984a) Noyes, R. W., Hartmann, L. W., Baliunas, S. L., Duncan, D. K., & Vaughan, A. H. 1984a, ApJ, 279, 763
- Noyes et al. (1984b) Noyes, R. W., Weiss, N. O., & Vaughan, A. H. 1984b, ApJ, 287, 769
- Oláh et al. (2016) Oláh, K., Kővári, Z., Petrovay, K., et al. 2016, A&A, 590, A133
- Olspert et al. (2017) Olspert, N., Lehtinen, J. J., Käpylä, M. J., Pelt, J., & Grigorievskiy, A. 2017, ArXiv e-prints :1712.08240
- Ossendrijver (2003) Ossendrijver, M. 2003, A&A Rev., 11, 287
- Pace et al. (2009) Pace, G., Melendez, J., Pasquini, L., et al. 2009, A&A, 499, L9
- Pérez Martínez et al. (2014) Pérez Martínez, M. I., Schröder, K.-P., & Hauschildt, P. 2014, MNRAS, 445, 270
- Petit et al. (2008) Petit, P., Dintrans, B., Solanki, S. K., et al. 2008, MNRAS, 388, 80
- Radick et al. (1998) Radick, R. R., Lockwood, G. W., Skiff, B. A., & Baliunas, S. L. 1998, ApJS, 118, 239
- Reiners & Basri (2008) Reiners, A. & Basri, G. 2008, ApJ, 684, 1390
- Reiners & Mohanty (2012) Reiners, A. & Mohanty, S. 2012, ApJ, 746, 43
- Rosén et al. (2016) Rosén, L., Kochukhov, O., Hackman, T., & Lehtinen, J. 2016, A&A, 593, A35
- Rutten (1984) Rutten, R. G. M. 1984, A&A, 130, 353
- Rutten (1987) Rutten, R. G. M. 1987, A&A, 177, 131
- Rutten et al. (1991) Rutten, R. G. M., Schrijver, C. J., Lemmens, A. F. P., & Zwaan, C. 1991, A&A, 252, 203
- Saar & Baliunas (1992) Saar, S. H. & Baliunas, S. L. 1992, in Astronomical Society of the Pacific Conference Series, Vol. 27, The Solar Cycle, ed. K. L. Harvey, 150–167
- Saar & Brandenburg (1999) Saar, S. H. & Brandenburg, A. 1999, ApJ, 524, 295
- Scargle (1982) Scargle, J. D. 1982, ApJ, 263, 835
- Schrijver (1987) Schrijver, C. J. 1987, A&A, 172, 111
- Schröder et al. (2009) Schröder, C., Reiners, A., & Schmitt, J. H. M. M. 2009, A&A, 493, 1099
- See et al. (2016) See, V., Jardine, M., Vidotto, A. A., et al. 2016, MNRAS, 462, 4442
- See et al. (2015) See, V., Jardine, M., Vidotto, A. A., et al. 2015, MNRAS, 453, 4301
- Solanki et al. (2006) Solanki, S. K., Inhester, B., & Schüssler, M. 2006, Reports on Progress in Physics, 69, 563
- Solanki et al. (2004) Solanki, S. K., Usoskin, I. G., Kromer, B., Schüssler, M., & Beer, J. 2004, Nature, 431, 1084
- Steenbeck et al. (1966) Steenbeck, M., Krause, F., & Rädler, K.-H. 1966, Zeitschrift Naturforschung Teil A, 21, 369
- Vaughan & Preston (1980) Vaughan, A. H. & Preston, G. W. 1980, PASP, 92, 385
- Vidotto (2016) Vidotto, A. A. 2016, MNRAS, 459, 1533
- Viviani et al. (2017) Viviani, M., Warnecke, J., Käpylä, M. J., et al. 2017, ArXiv e-prints: 1710.10222
- Warnecke (2017) Warnecke, J. 2017, ArXiv e-prints: 1712.01248
- Wilson (1968) Wilson, O. C. 1968, ApJ, 153, 221
- Wright et al. (2004) Wright, J. T., Marcy, G. W., Butler, R. P., & Vogt, S. S. 2004, ApJS, 152, 261
- Zechmeister & Kürster (2009) Zechmeister, M. & Kürster, M. 2009, A&A, 496, 577
Appendix A S-index versus


Appendix B versus


Appendix C Chromospheric activity cycles and the respective periodograms for CA, CB, and CC stars



Appendix D Rotation period versus activity cycle for CA stars alone
Appendix E Overlap of stars with activity cycles and the Vaughan-Preston gap
