A NLTE line formation for neutral and singly-ionised calcium in model atmospheres of B-F stars
Abstract
We present non-local thermodynamic equilibrium (NLTE) line formation calculations for Ca i and Ca ii in B-F stars. The sign and the magnitude of NLTE abundance corrections depend on line and stellar parameters. We determine calcium abundances for nine stars with reliable stellar parameters. For all stars, where the lines of both species could be measured, the NLTE abundances are found to be consistent within the error bars. We obtain consistent NLTE abundances from Ca ii lines in the visible and near infra-red (IR, 8912-27, 9890 Å) spectrum range, in contrast with LTE, where the discrepancy between the two groups of lines ranges from dex to 0.6 dex for different stars. Our NLTE method reproduces the Ca ii 8912-27, 9890 Å lines observed in emission in the late B-type star HD 160762 with the classical plane-parallel and LTE model atmosphere. NLTE abundance corrections for lines of Ca i and Ca ii were calculated in a grid of model atmospheres with 7000 K 13000 K, 3.2 log g 5.0, [Fe/H] , = 2.0 km s-1. Our NLTE results can be applied for calcium NLTE abundance determination from Gaia spectra, given that accurate continuum normalisation and proper treatment of the hydrogen Paschen lines are provided. The NLTE method can be useful to refine calcium underabundances in Am stars and to provide accurate observational constraints on the models of diffusion.
keywords:
line: formation – stars: atmospheres – stars: abundances.1 Introduction
Calcium is observed in the two ionisation stages, Ca i and Ca ii, in wide range of stellar parameters. This provides an opportunity to determine atmospheric parameters and also calcium abundance using Ca i and Ca ii lines. Therefore, one needs to explore how deviations from LTE influence on formation of Ca i and Ca ii lines.
Statistical equilibrium of Ca i- ii in late type stars is explicitly studied in the literature, for example by Drake (1991); Idiart & Thévenin (2000), and Mashonkina et al. (2007, 2017, and references therein).
In the early spectral type atmospheres with effective temperatures of 15000 K 20000 K and surface gravity of log g from 2.5 to 4.0, the NLTE line formation for Ca ii 3933 Å line was investigated by Mihalas (1973). In NLTE, he found the line strengthening, by a factor of about two and five, in terms of abundances, for main sequence stars and giants, respectively.
In the range from 8000 K to 13000 K, the NLTE calculations for Ca i- ii were not yet performed, although observations reveal signatures of strong deviations from LTE. Wahlgren & Hubrig (2004) mentioned the presence of the emission Ca ii lines of stellar origin in the spectrum of He-weak star 3 Cen A. In general, the emission lines can not be explained within a classical LTE approach. Alexeeva et al. (2016), for example, evaluated the NLTE line formation for C i- ii in atmospheres of B-F stars and explained a mechanism of C i emission line formation using plane-parallel and LTE model atmosphere.
The NLTE calculations for calcium are expected to be important for chemically peculiar stars, in particular, for Am (melallic-line) stars, which show underabundances of calcium and scandium and an overabundance of iron peak and rare-earth elements (Preston, 1974). Am stars are located on the main sequence with log g from 4.5 to 3.5. Berthet (1992) examined behaviour of calcium abundance in relation to the evolutionary stage of some Am stars in three star clusters and found that the more the Am star is evolved, the less is its calcium deficiency. In contrast to previous studies, from analysis of calcium abundance in field Am stars, Kunzli & North (1998) found that calcium abundance does not tend to be larger in evolved Am stars than in unevolved ones, for objects distributed along a given evolutionary track in the HR diagram. However, they found a significant correlation between calcium abundance and effective temperature, in the sense that the cooler objects are the most Ca-deficient, hence have the most pronounced Am peculiarity. The latter result was confirmed by Ryabchikova (2005). The above mentioned studies rely on assumption of local thermodynamic equilibrium (LTE).
In this study, we investigate the NLTE effects for Ca i- ii in atmospheres of BAF stars. This paper aims to understand a mechanism of the Ca ii emission in B-type stars and to treat the method of accurate abundance determination for BAF stars based on the NLTE line formation for Ca i- ii.
2 Method of NLTE calculations for Ca i- ii
We rely on a fairly complete model atom constructed by Mashonkina et al. (2007). The model atom includes 63 levels of Ca i, 37 levels of Ca ii, and the ground state of Ca iii. Energy levels up to 0.17/0.67 eV below the ionization threshold are included in the Ca i/Ca ii model atom. For Ca iii, only the ground state is considered because the first excited level has = 24 eV and its population is tiny compared to that of the ground state. Fine structure splitting sub-levels are included explicitly for the Ca i 4p3P∘ and 3d3D and Ca ii 3d2D, 4p2P∘ and 4d2D terms. For radiative transitions, accurate data on photoionisation cross-sections and transition probabilities from the Opacity Project (OP; see Seaton et al., 1994, for a general review) were used, which are accessible in the TOPBASE111http://cdsweb.u-strasbg.fr/topbase/topbase.html database. For electron impact excitation, detailed results from the matrix calculations are available for ten transitions from the ground state in Ca i (Samson & Berrington, 2001) and all the transitions between levels of the configurations of Ca ii (Meléndez et al., 2007). For the remaining bound-bound transitions, approximate formulae are used, namely, the formula of van Regemorter (1962) for the allowed transitions and the formula from Woolley & Allen (1948) with a collision strength of 1.0 for the radiatively forbidden transitions. Ionisation by electronic collisions is calculated with the Seaton (1962) formula using the threshold photoionisation cross-section from hydrogenic approximation.
In the model atmospheres with 7500 K, the statistical equilibrium (SE) calculations take into account inelastic collisions with neutral hydrogen atoms using the classical Drawin (1968, 1969) approximation as implemented by Steenbock & Holweger (1984). The collision rates are scaled by a factor of = 0.1 as recommended by Mashonkina et al. (2007). It is worth noting that, in the atmospheric parameter range with which we concern in this study, using approximate rates for Ca + H i collisions produces minor effect on the final NLTE results. For example, in the model with / log g = 7000/ 4.4, the abundance difference between neglecting and including this type of collisions does not exceed 0.02 dex for lines of Ca i and Ca ii in the visible spectrum range, however it amounts to 0.08 dex for Ca ii 9890 Å line, which is the most sensitive to the details of NLTE calculations.
The NLTE and synthetic spectrum calculations are performed with the codes described by Sitnova et al. (2016). As in Sitnova et al. (2016), model atmospheres were calculated with the code LLmodels (Shulyak et al., 2004). The exception is Sirius, for which model atmosphere was taken from R. Kurucz website222http://kurucz.harvard.edu/stars/sirius/ap04t9850g43k0he05y.dat.
3 Departures from LTE for Ca i- ii
3.1 Statistical equilibrium of Ca i- ii
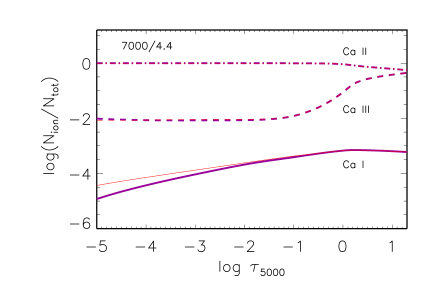
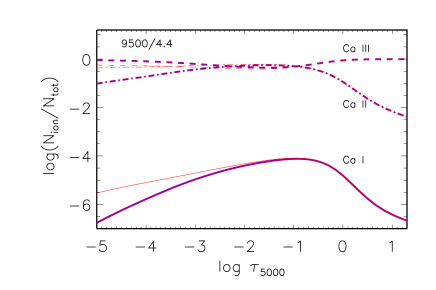
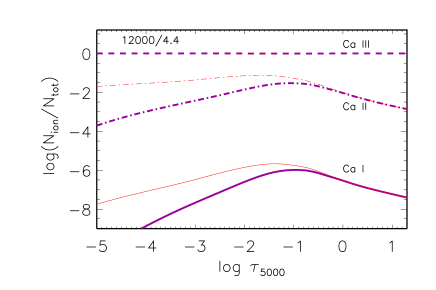
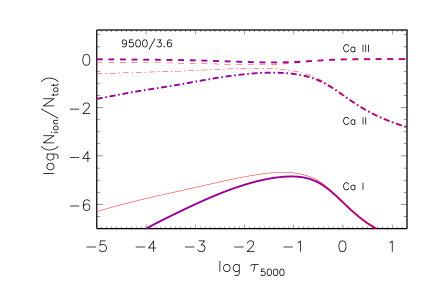
The NLTE and LTE number density fractions of Ca i, Ca ii, and Ca iii in different model atmospheres are presented in Fig. 1 as a function of the continuum optical depth log (referring to = 5000 Å). In stellar atmospheres with 7000 K, calcium is strongly ionised, with N(Ca i)/N(Ca ii) 10-4. NLTE results in underpopulation of Ca i relative to the thermodynamic equilibrium population in atmospheric layers above log = 0. In the deeper atmospheric layers, each species keeps its LTE fraction. In atmospheres with 7000 K 8000 K, Ca ii is a majority species, with N(Ca ii)/N(Ca iii) 10, which results in small deviations from LTE in the total number density of Ca ii. The ionisation degree increases toward higher and lower log g. In atmospheres with 9000 K 9500 K, Ca ii and Ca iii are competing species, and favorable conditions for overionisation of Ca ii appear. With a further increase of , Ca iii becomes the majority species, and overionisation of Ca ii increases.
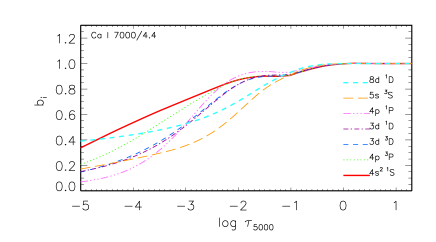
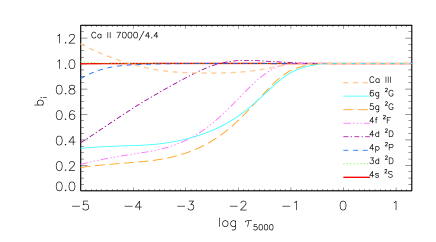
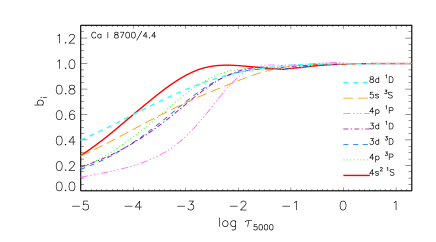
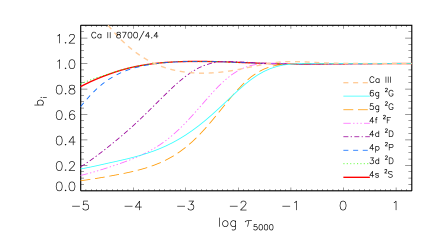
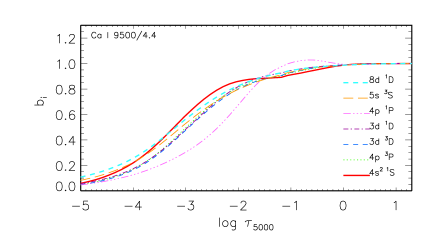
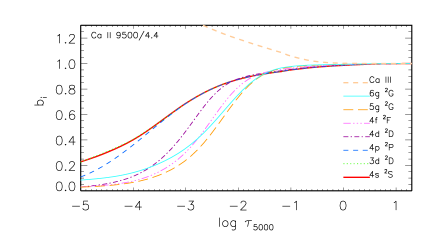
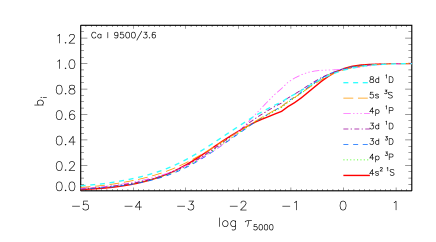
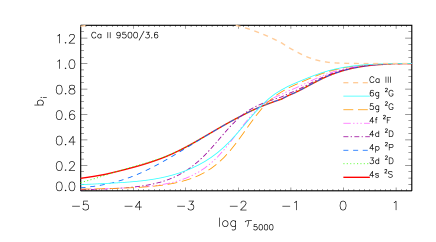
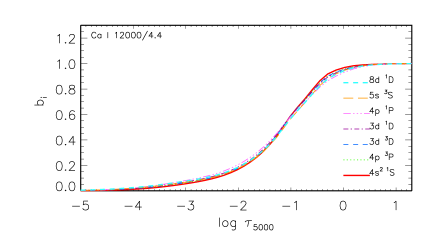
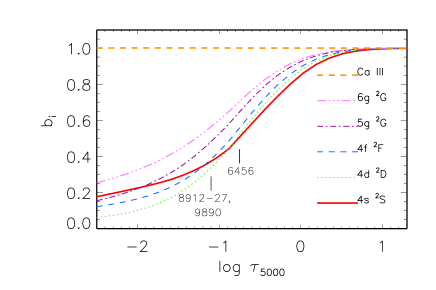
The deviations from LTE in level populations are characterized by the departure coefficients bi = n/n, where n and n are the statistical equilibrium and thermal (Saha-Boltzmann) number densities, respectively. The departure coefficients for the selected levels of Ca i, Ca ii, and ground state of Ca iii in different model atmospheres are presented in Fig. 2 as a function of log . In each model, all the levels retain their LTE populations in deep atmospheric layers below log = 0, where collisional processes dominate. Deviations from LTE grow toward higher atmospheric layers.
The low excitation levels of Ca i, with 4 eV, are underpopulated (b) above log = 0 due to overionisation, caused by superthermal radiation of non-local origin below the ionisation thresholds of these levels. In atmospheres with ranging from 7000 K up to about 8700 K (Fig. 2, top left panels), the overionisation of Ca i decreases toward higher temperature due to an increase of electron number density and collisional rates. In atmospheres with 8500 K 10000 K (Fig. 2, left column, 2nd to 4th rows), the Ca i 4p1P level (dash-three dotted line) is overpopulated relative to the ground state (solid line) at log between 0 and due to radiative pumping of the resonance 4226 Å transition.
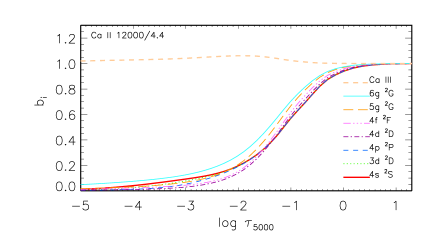
In atmospheres with 7000 K 8000 K, Ca ii is a majority species, and the ground state and 4p2P and 3d2D levels keep the LTE populations throughout all atmospheric depths. The levels of Ca ii with of 6-8 eV (see, for example 4d2D in Fig. 2, top right panel) are closely coupled to the lower excitation levels inwards at approximately log = and depopulated relative to their thermodynamic equilibrium (TE) population in the upper atmospheric layers due to spontaneous transitions. The high-excitation ( 8 eV) levels have depleted populations, starting from deep enough atmospheric layers (for example, log in the 7000/4.4 model, Fig. 2).
In atmospheres with 10000 K, the levels of Ca ii are underpopulated relative to LTE due to overionisation. The overionisation is smaller for energy levels with higher , compared to those, with the lower , due to collisional coupling of the upper levels with the ground state of Ca iii.
We calculated the SE of Ca i- ii in the grid of LL model structures (Shulyak et al., 2004) with: 7000 K 13000 K, with a step of 100 K for 10000 K and 250 K for 10000 K; 3.2 log g 5.0, with a step of 0.2 dex; [Fe/H ] , with a step of 0.5 dex; = 2.0 km s-1. The grid of departure coefficients can be implemented in any code for NLTE synthetic spectra calculations and is available on request.
3.2 NLTE effects for lines of Ca i and Ca ii depending on atmospheric parameters
| (Å) | Eexc (eV) | log gf | log | log /Ne | log /NH |
|---|---|---|---|---|---|
| Ca i | |||||
| 4226.728 | 0.000 | 0.244 | 8.360 | -6.031 | -7.562 |
| 4283.011 | 1.886 | -0.136 | 8.320 | -5.840 | -7.720 |
| 4289.367 | 1.879 | -0.233 | 8.320 | -5.760 | -7.720 |
| 4298.988 | 1.886 | -0.359 | 8.320 | -5.760 | -7.720 |
| 4302.528 | 1.899 | 0.292 | 8.167 | -5.997 | -7.804 |
| 4307.744 | 1.886 | -0.234 | 8.320 | -5.720 | -7.720 |
| 4318.651 | 1.899 | -0.139 | 8.320 | -5.760 | -7.720 |
| 4355.079 | 2.709 | -0.470 | 7.310 | -3.550 | -7.130 |
| 4425.437 | 1.879 | -0.358 | 8.025 | -5.610 | -7.163 |
| 4434.957 | 1.886 | -0.007 | 8.021 | -5.602 | -7.162 |
| This table is available in its entirety in a machine-readable form in the online journal. A portion is shown here for guidance regarding its form and content. | |||||
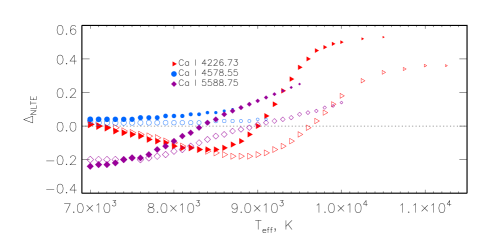
The NLTE abundance corrections, 333Here, log A = log (Nelem/Ntot), were computed for 55 lines of Ca i and 13 lines of Ca ii listed in Table 1 along with gf-values, excitation energies, and damping constants (log , log (/Ne), log (/NH). The line list was extracted from the VALD database (Ryabchikova et al., 2015). The NLTE abundance corrections are presented in Table 2 and Fig. 3.
In NLTE, spectral line strength is affected by the deviation of the line source function () from the Planck function (Bν) and by the change in the line absorption coefficient () at line formation depths:
,
.
Here, bl and bu are the departure coefficients of the lower and upper level of a transition, respectively. The quantity is the correction for stimulated emission that cancels part of the line absorption. For the visible and UV lines in the stellar parameter range we are concerned with, . Therefore,
,
.
The NLTE abundance corrections for lines of Ca i and Ca ii can be either positive or negative, depending on the line and atmospheric parameters. The weak lines of Ca i, such as 4578 Å, which has an equivalent width of EW 50 mÅ throughout the investigated range of atmospheric parameters, form in deep atmospheric layers, where an overionisation of Ca i dominates resulting in positive NLTE abundance corrections. For stronger Ca i lines, such as 5588 Å, with EW 100 mÅ, there are two effects, which influence the NLTE line profile. An overionisation leads to weakened line wings, while photon loss in high optically thin atmospheric layers strengthens the line core. The sign of the NLTE abundance correction depends on which of the two effects prevails at line formation depths. For 5588 Å, in atmospheres with 8500 K, while this line is weakened and at higher . Qualitatively similar behaviour is found for for the Ca i 4226 Å resonance line. However, due to larger equivalent width compared to 5588 Å, changes the sign at higher effective temperatures, of about 9000 K when log g = 4.4. It is worth noting that Drake (1991) and Mashonkina et al. (2007) found the similar core-wing effect for lines of Ca i in atmospheres of FG stars.
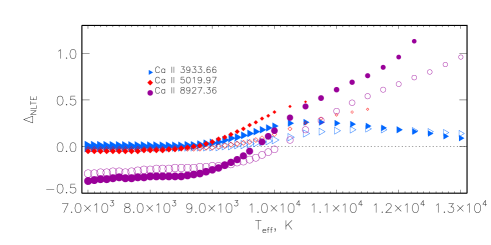
In atmospheres with 7000 K 8000 K, deviations from LTE for Ca ii 3933 Å resonance line and Ca ii IR triplet lines (8498, 8542, 8662 Å) are small. NLTE leads to strengthened high-excitation ( 6 eV) lines of Ca ii and negative NLTE abundance corrections. For high-excitation lines of Ca ii, is larger in absolute value for strong IR lines (8917-27 Å) compared to weak lines in the visible spectrum range (for example, 5019 Å, 6456 Å).
With increasing above 9000 K, an overionisation of Ca ii takes place and results in weakened lines of Ca ii and positive , up to 0.3 dex for Ca ii 3933 Å and 1 dex for 8927 Å (Fig. 3).
We provide the NLTE abundance corrections for the only Ca ii 8662 Å line out of the Ca ii IR triplet lines. The Ca ii 8498 Å and 8542 Å lines are located very close to the Paschen jump, where the hydrogen line profiles calculations for AB-stars can be uncertain (see Sect. 4.2).
The computed NLTE abundance corrections correspond to = 2 km s-1. We checked an effect of change in by 1 km s-1 on the results. The test calculations were performed with the model 7300/4.0/0.0 and = 1 km s-1. For lines of Ca i in the 3 mÅ EW 227 mÅ equivalent width range, the changes in do not exceed 0.02 dex. For Ca ii lines in the visible spectrum range and of 10 mÅ EW 55 mÅ, the changes in are minor and do not exceed 0.01 dex. We found the largest change for Ca ii 8927 Å with EW = 190 mÅ, which amounts to 0.04 dex.
| log g | 1, K | 2 | … | 42 | 43 |
| EW1, mÅ | EW2 | … | EW42 | EW43 | |
| 1 | 2 | … | 42 | 43 | |
| 7000 | 7100 | … | 12750 | 13000 | |
| Ca I 4226.728 Å, = 0.000 eV, log gf = 0.244 | |||||
| 3.2 | 258 | 244 | … | –1 | –1 |
| 0.00 | 0.00 | … | –1.00 | –1.00 | |
| … | |||||
| 5.0 | 109 | 103 | … | –1 | –1 |
| 0.01 | 0.01 | … | –1.00 | –1.00 | |
| … | |||||
| Ca II 9890.705 Å, = 8.400 eV, log gf = -1.200 | |||||
| 3.2 | 201 | 206 | … | –1 | –1 |
| –0.30 | –0.30 | … | –1.00 | –1.00 | |
| … | |||||
| 5.0 | 172 | 164 | … | 13 | 10 |
| –0.08 | –0.08 | … | 1.91 | 2.33 | |
| This table is available in its entirety in a machine-readable form in the online journal. A portion is shown here for guidance regarding its form and content. If EW = and = , this means that EW 5 mÅ in a given model atmosphere. | |||||
4 Calcium NLTE abundances of the reference stars
As a test of the NLTE method for Ca i- ii in atmospheres with 7000 K, we determine calcium abundances in the atmospheres of nine well-studied sharp-lined stars of B-F spectral types, which do not reveal the presence of pulsation, chemical stratification, and magnetic field. These stars were used in our previous studies for testing the NLTE methods for C i- ii (Alexeeva et al., 2016), O i (Sitnova et al., 2013a), and Ti i- ii (Sitnova et al., 2016). The list of program stars together with their atmospheric parameters is given in Table 3. We refer to Alexeeva et al. (2016) and Sitnova et al. (2016) for a description of the methods of atmospheric parameter determinations.
4.1 Observations
We use high-resolution, 40000, and high signal to noise ratio, S/N 100, spectra with wide wavelength coverage, allowing us to use Ca ii 3933 Å and 9890 Å lines. The exception is HD 145788, where only the 3780-6910 Å wavelength region is available. Details of the observations and of their reduction are given in the references (last column of Table 3).
Inspecting the observed spectrum of 21 Peg, we found additional absorption in the red wings of Ca ii 3933 Å and 3968 Å lines and the Na i 5889 Å and 5895 Å lines. These features have a similar radial velocity shift of 12 km s-1, with respect to the stellar spectrum, suggesting an interstellar origin.
It is not surprising that a nearby star 21 Peg (at a distance of 190 pc from the Sun and E(B-V) = 0.04) presents interstellar medium absorption lines. Fossati et al. (2017) concluded that the core of the Ca ii H&K lines in spectra of stars lying on average beyond 100 pc may be significantly affected by interstellar medium absorption. To derive calcium abundance from Ca ii 3933 Å, we use spectral fitting of the blue wing of the line.
| Star | , K | [Fe/H] | , km s-1 | Ref. | , 103 | source | ||
|---|---|---|---|---|---|---|---|---|
| HD 32115 | 7250 | 4.20 | 0.0 | 2.3 | F11 | 60 | 490 | CAO |
| HD 73666 | 9380 | 3.78 | 0.10 | 1.8 | F07 | 65 | 660 | F07 |
| HD 172167 | 9550 | 3.95 | -0.50 | 1.8 | CK93 | 40 | 750 | K99 |
| (Vega) | ||||||||
| HD 72660 | 9700 | 4.10 | 0.40 | 1.8 | S16 | 65 | 100 | K18 |
| HD 145788 | 9750 | 3.70 | 0.46 | 1.3 | F09 | 115 | 200 | F09 |
| HD 48915 | 9850 | 4.30 | 0.40 | 1.81 | H93 | 70 | 500 | F95 |
| (Sirius) | ||||||||
| HD 209459 | 10400 | 3.55 | 0.0 | 0.5 | F09 | 120 | 700 | CAO |
| (21 Peg) | ||||||||
| HD 17081 | 12800 | 3.75 | 0.0 | 1.0 | F09 | 65 | 200 | F09 |
| ( Cet) | ||||||||
| HD 160762 | 17500 | 3.8 | 0.02 | 1.0 | NP12 | 65 | 600 | CAO |
| ( Her) | ||||||||
| 1 Sitnova et al. (2013b); F11 = Fossati et al. (2011), S16 = Sitnova et al. (2016), CK93 = Castelli & Kurucz (1993), F07 = Fossati et al. (2007), F09 = Fossati et al. (2009), H93 = Hill & Landstreet (1993), NP12 = Nieva & Przybilla (2012), K18 = Khalack (2018), ESPaDOnS, Propisal ID = 1896062; K99 = A. Korn, private communication, FOCES; F95 = Furenlid et al. (1995), L98 = Landstreet (1998), CAO = taken from the Common Archive Observation database http://www.cfht.hawaii.edu/Instruments/Spectroscopy/Espadons/. | ||||||||
4.2 Analysis of Ca i and Ca ii lines in the reference stars
Here we determine NLTE and LTE abundances from different lines of Ca i and Ca ii and check the Ca i– ii ionisation equilibrium in the investigated stars. We emphasize that the abundances are derived from the spectrum synthesis and not from equivalent widths. For each star, at least, six calcium lines were detected. We present the derived NLTE and LTE abundances obtained from individual lines of Ca i and Ca ii in Table 4. The lines of two ionisation stages are observed in seven stars out of nine. We separated the lines into four groups: Ca i lines, Ca ii lines in the visible spectrum range (3933, 4220, 5001, 5019, 5021, 5285, 5307, 5339, 6456 Å), Ca ii high excitation IR lines (4d 2D–4f 2F, 8912 Å and 8927 Å and 4f 2F–5g 2G, 9890 Å), and Ca ii IR triplet lines (3d 2D–4p 2P, 8498, 8562, 8662 Å). Further, we discuss separately the abundances, derived from each group of lines in the investigated stars.
Ca i lines. In the five A-type stars, namely HD 73666, Vega, HD 72660, HD 145788, and Siruis, the Ca i 4226 Å resonance line and the subordinate lines were used for abundance determination. In the F-type star, HD 32115, Ca i 4226 Å was excluded from the abundance analysis due to its large strength (EW mÅ) and blending with Fe i 4226.424 Å line. For A-type stars, NLTE leads to higher calcium abundance compared to LTE, by up to 0.33 dex in HD 145788. For HD 32115, the NLTE abundance corrections for different lines of Ca i have different sign (Fig. 4), resulting in 0.11 dex lower average abundance compared to the LTE case. In A-type stars, the NLTE abundance correction for Ca i 4226 Å is larger compared to that for the Ca i subordinate lines. For example, in HD 145788 dex, while for the subordinate lines, varies from 0.27 dex to 0.29 dex. For Ca i in each star, NLTE leads to smaller line-to-line abundance scatter compared to LTE (see Table 5).

Ca ii lines in the visible spectrum range. NLTE leads to higher calcium abundance compared to LTE, by up to 0.35 dex in 21 Peg. The exception is the coolest star of our sample, HD 32115, where the NLTE abundance corrections are either negative or minor for lines of Ca ii. NLTE leads to smaller line-to-line abundance scatter compared to LTE in each star.
Ca ii high excitation IR lines. These lines are the most sensitive to deviations from LTE. The NLTE abundance corrections are negative for the stars with the strongest lines, HD 32115, HD 73666, and HD 72660, and positive for the other stars of the sample. With increasing , the Ca ii IR lines weaken and form in atmospheric layers, where overionisation dominates, which leads to positive NLTE abundance corrections.
The Ca ii 8912-27 and 9890 Å lines were not detected in the observed spectrum of HD 17081. Our NLTE calculations with the NLTE abundance derived from Ca ii 3933 Å predict a tiny absorption in the IR lines, which is consistent with the observations, while LTE leads to strong absorption. The difference between LTE and NLTE abundances amounts to 0.8 dex.
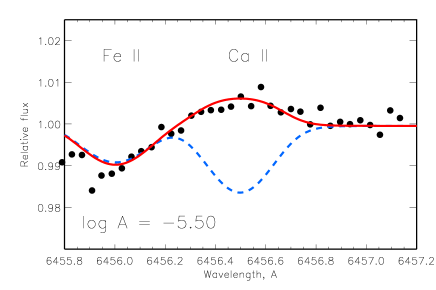
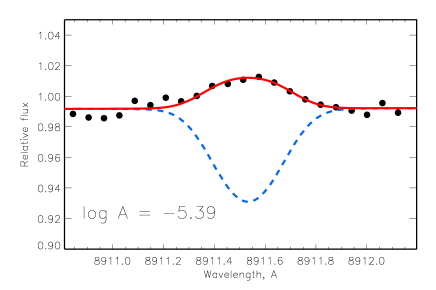
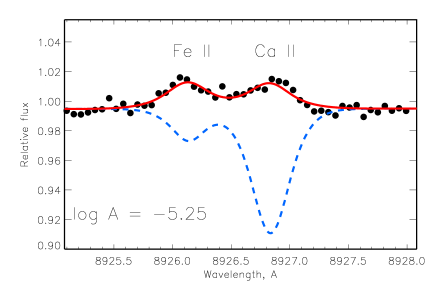
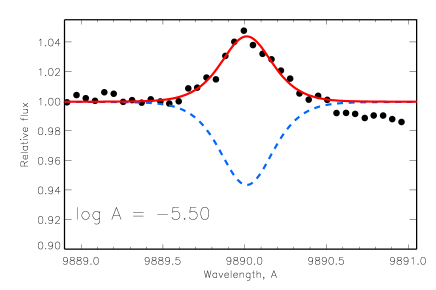
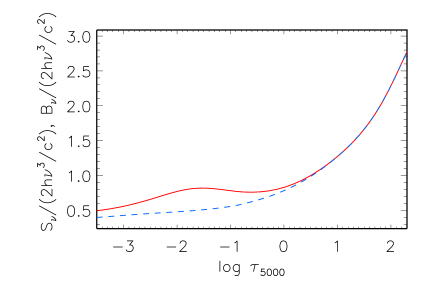
The emission lines of Ca ii in HD 160762. In the hottest star of our sample, we found out that the Ca ii 6456, 8912, 8927, and 9890 Å lines are observed in emission. There is no way to reproduce emission lines using classical hydrostatic model atmosphere and LTE level populations. Our NLTE calculations with the hydrostatic LTE model atmosphere and without any tuning, reproduce well the observed Ca ii 6456, 8912, 8927, and 9890 Å line profiles, as displayed in Fig. 5. To understand the emission mechanism, we show in Fig. 6 the departure coefficients of some important Ca ii levels. All of them are underpopulated compared to their LTE populations, with higher levels closer to LTE, which is typical for the levels of a minority species affected by overionisation and photon loss in high-excitation lines. As a result, for each of the Ca ii 6456, 8912-27 and 9890 Å lines, their line source function, Sν, exceeds the Planck function, Bν(Te), at the line formation depths. It is worth noting that the strength of the emission lines increases with wavelength. For example, the equivalent width of the Ca ii 6456 Å line is EW6456 = mÅ, while EW9890 = mÅ for the Ca ii 9890 Å line. In the IR region, deviations from LTE are larger compared to the visible spectral range due to the increasing importance of the stimulated emission, which also increases with temperature (see the relation in Sect. 3.1). Figure 7 displays Sν for Ca ii 9890 Å and the corresponding Bν(Te) in the atmosphere of HD 160762. The core of the Ca ii 9890 Å line forms around log = , where Sν exceeds Bν(Te) by a factor of 1.6. Note that the population divergence does not reach the regime of ”laser action” (negative line extinction and negative line source function), which would require bu/bl 2.7 and 4.7 for the 9890 Å and 6456 Å lines, respectively, when T = 14360 K and log = . The computed divergence remains below this value, and bu/bl 2 for any emission line.
Ca ii 8248-54 Å and the Ca ii IR triplet lines were analyzed in the eight stars of the sample, where the near IR observed spectra are available. We found consistent within 0.14 dex NLTE abundances from Ca ii lines in the visible spectrum range, the IR triplet, and 8248-54 Å lines in HD 32115, HD 73666, and Sirius. For HD 72660 and HD 17081, Ca ii 8248-54 Å lines are too weak to be detected, while NLTE abundances from the IR triplet and the other Ca ii lines are consistent within 0.09 dex. For Vega, 21 Peg, and HD 160762, different groups of Ca ii lines give different abundances either in NLTE or LTE, by up to 0.2 dex in absolute value. For example, the Ca ii IR triplet lines give higher abundances compared to Ca ii lines in the visible spectrum range in Vega and 21 Peg, while lower in HD 160762. Abundances from Ca ii 8248-54 Å are higher, lower, and consistent with those derived from Ca ii visible lines in HD 160762, 21 Peg, and Vega, respectively. The uncertainty in abundance from Ca ii 8248-54 Å and the Ca ii IR triplet lines can be caused by the following reasons.
The Ca ii 8248-54 Å lines lie near the Paschen jump and the Ca ii triplet lines lie near the cores of the hydrogen Paschen lines. This is not a trivial problem to normalise an observed spectrum in the wavelength region from 8200 Å to 8800 Å. To fit the theoretical spectrum to the observed one, we have to additionally correct a local continuum for individual IR lines. Moreover, in this wavelength region, there are uncertainties in the calculations of the theoretical spectrum for BA-type stars. Figure 8 shows the synthetic spectra calculated with different treatments of the hydrogen-line opacity in the model atmosphere with /log g = 10400/3.55 representing 21 Peg. The calculations were performed with the codes DETAIL (Butler & Giddings, 1985) and SynthV_NLTE (Tsymbal, 1996; Ryabchikova et al., 2016). Additionally, we calculated the synthetic spectrum with the SYNTHMAG code (Kochukhov, 2007), which uses HBOP procedure, developed by Barklem & Piskunov (2015), for treatment of the overlapping hydrogen lines and continuous opacity with the occupation probability theory (Hummer & Mihalas, 1988; Dappen et al., 1987; Hubeny et al., 1994; Nayfonov et al., 1999). The use of the occupation probability formalism significantly reduces Paschen line absorption compared to those from classical treatment of the hydrogen line opacity. Therefore, we do not provide abundance measurements from these lines in the investigated stars and do not recommend to use Ca ii 8248-54 Å and the Ca ii IR triplet lines for abundance determinations for BA type stars.
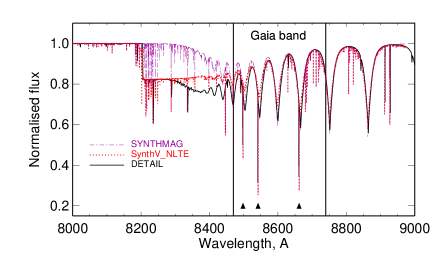
Table 5 summarises the results of calcium abundance determination from different groups of reliable lines, i. e. lines of Ca i, lines of Ca ii in the visible spectrum range, and lines of Ca ii in the IR spectrum range 8912-27, 9890 Å. We also show in Fig. 9 the NLTE and LTE abundance differences between these groups of lines. For each star, NLTE leads to average abundances from lines of Ca ii in the visible and the IR spectrum range consistent within 0.1 dex, while the abundance discrepancy between these groups of lines varies from 0.6 dex down to dex in LTE (Fig. 9, top panel). The exception is 21 Peg, where NLTE leads to better agreement between these two groups of lines compared to LTE, however, a discrepancy of 0.2 dex remains. For HD 160762, the LTE abundance difference is not shown in Fig. 9, because Ca ii 8912-27, 9890 Å lines are observed in emission and can not be fitted in LTE.
Fig. 9, bottom panel, shows the NLTE and LTE abundance differences between lines of Ca i and Ca ii in the visible spectrum range. For the majority of the investigated stars, an abundance difference = log A(Ca i)–log A(Ca ii, vis) does not exceed 0.1 dex in absolute value, independent of NLTE or LTE. However, for A-type stars, the absolute abundances from Ca i and Ca ii lines are higher in NLTE compared with LTE.


| HD 32115 | HD 73666 | Vega | HD 72660 | HD 145788 | … | ||||||||
| log A | log A | log A | log A | log A | |||||||||
| , Å | , eV | log gf | NLTE | LTE | NLTE | LTE | NLTE | LTE | NLTE | LTE | NLTE | LTE | |
| 4226.728 | 0.000 | 0.244 | -99.9 | -99.9 | -5.50 | -5.58 | -6.03 | -6.39 | -5.43 | -5.47 | -5.26 | -5.70 | … |
| 4302.528 | 1.899 | 0.292 | -5.63 | -5.44 | -5.53 | -5.66 | -99.9 | -99.9 | -5.47 | -5.56 | -99.9 | -99.9 | … |
| 4425.437 | 1.879 | -0.358 | -5.62 | -5.55 | -5.53 | -5.65 | -99.9 | -99.9 | -5.44 | -5.54 | -99.9 | -99.9 | … |
| This table is available in its entirety in a machine-readable form in the online journal. A portion is shown here for guidance regarding its form and content. If log A = , this means that a line was not used for abundance determination. | |||||||||||||
| Star | log A(Ca i) | NCaI | log A(Ca ii, vis) | [Ca/H](Ca ii, vis) | NCaII,vis | log A(Ca ii, IR) | NCaII,IR | |
| HD 32115 | NLTE | -5.68 0.05 | 22 | -5.62 0.05 | 0.09 | 5 | -5.51 0.11 | 3 |
| LTE | -5.57 0.13 | 22 | -5.60 0.06 | 0.11 | 5 | -5.11 0.20 | 3 | |
| HD 73666 | NLTE | -5.48 0.03 | 11 | -5.57 0.03 | 0.14 | 7 | -5.57 0.05 | 3 |
| LTE | -5.59 0.06 | 11 | -5.64 0.03 | 0.07 | 7 | -5.37 0.09 | 3 | |
| Vega | NLTE | -5.94 0.08 | 5 | -6.05 0.06 | -0.34 | 3 | -6.13 0.01 | 2 |
| LTE | -6.17 0.10 | 5 | -6.28 0.07 | -0.57 | 3 | -6.25 0.04 | 2 | |
| HD 72660 | NLTE | -5.38 0.06 | 14 | -5.45 0.10 | 0.26 | 9 | -5.53 0.12 | 3 |
| LTE | -5.45 0.07 | 14 | -5.50 0.11 | 0.21 | 9 | -5.33 0.18 | 3 | |
| HD 145788 | NLTE | -5.23 0.03 | 5 | -5.33 0.07 | 0.38 | 8 | ||
| LTE | -5.56 0.08 | 5 | -5.64 0.12 | 0.07 | 8 | |||
| Siruis | NLTE | -5.93 0.03 | 5 | -5.92 0.03 | -0.21 | 4 | -6.04 0.04 | 3 |
| LTE | -6.14 0.08 | 5 | -6.12 0.06 | -0.41 | 4 | -6.24 0.08 | 3 | |
| 21 Peg | NLTE | -5.49 | 1 | -5.59 0.08 | 0.12 | 4 | -5.81 0.04 | 2 |
| LTE | -5.99 | 1 | -6.00 0.09 | -0.29 | 4 | -6.31 0.01 | 2 | |
| HD 17081 | NLTE | -5.64 | 0.07 | 1 | -5.64 0.00 | 2 | ||
| LTE | -5.83 | -0.12 | 1 | -6.44 0.00 | 2 | |||
| HD 160762 | NLTE | -5.45 | 0.26 | 1 | -5.37 0.13 | 3 | ||
| LTE | -5.26 | 0.45 | 1 | emission | ||||
| solar calcium abundance log A⊙ = –5.71 (Lodders et al., 2009) | ||||||||
4.3 Calcium NLTE abundance determination with SME code
As it was written in Section 3.1, we calculated departure coefficients of Ca i and Ca ii levels for a grid of LLmodels atmospheres (Shulyak et al., 2004). Earlier, the same calculations were performed for grids of MARCS plane-parallel models (Gustafsson et al., 2008). These NLTE data are implemented in the current version of the SME (Spectroscopy Made Easy) package of automatic parameters and abundance determination based on high-resolution stellar spectra (Piskunov & Valenti, 2017). Atmospheric parameters and element abundances in SME are derived by the interpolation inside the grid models. For cool stars (MARCS model grids) the accuracy of authomatic NLTE Ca abundance determinations was tested in the paper by Piskunov et al. (2017, see Figs. 1 and 3 of this paper). Here, we tested the automatic method for hotter stars with HD 32115 and HD 72660. For HD 32115 the SME abundances are -5.680.07 (Ca i) and -5.600.14 (Ca ii). For HD 72660 the corresponding values are -5.440.13 (Ca i) and -5.520.10 (Ca ii), thus fully consists with the line-by-line NLTE abundance determinations (see Table 5). The larger error bars derived with SME are due to additional uncertainties caused by spectral noise which is included in the SME procedure. Our results allow to increase the range of stellar atmospheric parameters where we can carry out the NLTE calcium abundance determinations using automatic methods.
5 Conclusions
In this study, the NLTE line formation for Ca i– ii is investigated for the first time in the stellar parameter range corresponding to BAF-type stars. We use a fairly complete model atom of Ca i– ii from Mashonkina et al. (2007). The NLTE abundance corrections for lines of Ca i and Ca ii can be either positive or negative, depending on the line and atmospheric parameters.
Using nine stars, with well-determined atmospheric parameters, which cover the range from 7250 K to 17500 K, and high resolution and high S/N spectra available, we prove that NLTE leads to consistent abundances from different lines of the two ionisation stages, Ca i and Ca ii. To be precise, the NLTE abundances from Ca ii lines in the visible and IR (8912-27, 9890 Å) spectral range agree within 0.1 dex for each star, in contrast to LTE, where the abundance discrepancy between these two groups of lines ranges from dex to 0.6 dex for different stars. In case of 21 Peg, NLTE reduces the abundance difference compared to LTE, however, it remains still large and amounts to 0.2 dex. We obtain that, for each star, the average abundance difference between Ca i and Ca ii does not exceed 0.1 dex, independent of either NLTE or LTE. However, the NLTE abundances are higher and NLTE always leads to substantially smaller line-to-line abundance scatter compared to LTE.
We do not recommend to use the Ca ii IR triplet lines (8498, 8542, 8662 Å) for accurate abundance determination due to difficulties with continuum placement of the observed spectrum and uncertainty of background opacity calculations near the Paschen jump. It is worth noting that the Gaia spectrograph focuses exactly on that spectral region and the Ca ii IR triplet lines are going to be employed to determine calcium abundances of AB type stars. We caution against using Ca ii 8498 and 8542 Å and recommend to use 8662 Å, given that an observed spectrum normalisation is done properly.
Our NLTE method reproduces the Ca ii 8912-27, 9890 Å lines observed in emission in the late B-type star HD 160762 with the classical plane-parallel and LTE model atmosphere.
We provide NLTE abundance corrections for lines of Ca i and Ca ii in the following range of atmospheric parameters: 7000 K 13000 K, 3.2 log g 5.0, [Fe/H] , = 2.0 km s-1.
Our theoretical NLTE results can be useful for studies of calcium abundance of Am stars. For example, a correlation found in LTE between calcium abundance and effective temperature, in the sense that the cooler objects are more Ca-deficient than the hotter ones (Kunzli & North, 1998), is expected to be strengthened in NLTE. This can be useful to constrain the models of diffusion in Am stars from observations.
Acknowledgments
We thank V. Khalack for providing spectrum of HD 72660 that was obtained with ESPaDOnS at the CFHT and A. Korn for providing spectrum of Vega that was obtained with FOCES at the Calar Alto 2.2m telescope. This research is based on observations obtained with MegaPrime/MegaCam, a joint project of CFHT and CEA/IRFU, at the Canada–France–Hawaii Telescope (CFHT) which is operated by the National Research Council (NRC) of Canada, the Institut National des Science de l’Univers of the Centre National de la Recherche Scientifique (CNRS) of France, and the University of Hawaii. The operations at the Canada-France-Hawaii Telescope are conducted with care and respect from the summit of Maunakea which is a significant cultural and historic site. We used the DETAIL code provided by K. Butler, a participant of the ”Non-LTE Line Formation for Trace Elements in Stellar Atmospheres” School (July 29-August 2, 2007, Nice, France). TS and LM are grateful to the Russian Scientific Foundation (grant 17-13-01144 supported via Herzen University), and TR is grateful to the Russian Foundation for Basic Research (grant 15-02-06046). We also thank the referee, Luca Fossati, for useful comments and suggestions. We made use of the NIST, SIMBAD, and VALD databases.
References
- Alexeeva et al. (2016) Alexeeva S. A., Ryabchikova T. A., Mashonkina L. I., 2016, MNRAS, 462, 1123
- Barklem & Piskunov (2015) Barklem P. S., Piskunov N., , 2015, HLINOP: Hydrogen LINe OPacity in stellar atmospheres, Astrophysics Source Code Library
- Berthet (1992) Berthet S., 1992, A&A, 253, 451
- Butler & Giddings (1985) Butler K., Giddings J., 1985, Newsletter on the analysis of astronomical spectra, No. 9, University of London
- Castelli & Kurucz (1993) Castelli F., Kurucz R. L., 1993, in Dworetsky M. M., Castelli F., Faraggiana R., eds, IAU Colloq. 138: Peculiar versus Normal Phenomena in A-type and Related Stars Vol. 44 of Astronomical Society of the Pacific Conference Series, Models for VEGA. p. 496
- Dappen et al. (1987) Dappen W., Anderson L., Mihalas D., 1987, ApJ, 319, 195
- Drake (1991) Drake J. J., 1991, MNRAS, 251, 369
- Drawin (1968) Drawin H.-W., 1968, Zeitschrift fur Physik, 211, 404
- Drawin (1969) Drawin H. W., 1969, Zeitschrift fur Physik, 225, 483
- Fossati et al. (2007) Fossati L., Bagnulo S., Monier R., Khan S. A., Kochukhov O., Landstreet J., Wade G., Weiss W., 2007, A&A, 476, 911
- Fossati et al. (2017) Fossati L., Marcelja S. E., Staab D., Cubillos P. E., France K., Haswell C. A., Ingrassia S., Jenkins J. S., Koskinen T., Lanza A. F., Redfield S., Youngblood A., Pelzmann G., 2017, A&A, 601, A104
- Fossati et al. (2009) Fossati L., Ryabchikova T., Bagnulo S., Alecian E., Grunhut J., Kochukhov O., Wade G., 2009, A&A, 503, 945
- Fossati et al. (2011) Fossati L., Ryabchikova T., Shulyak D. V., Haswell C. A., Elmasli A., Pandey C. P., Barnes T. G., Zwintz K., 2011, MNRAS, 417, 495
- Furenlid et al. (1995) Furenlid I., Westin T., Kurucz R. L., 1995, in Sauval A. J., Blomme R., Grevesse N., eds, Laboratory and Astronomical High Resolution Spectra Vol. 81 of Astronomical Society of the Pacific Conference Series, The Spectrum of Sirius from 307 to 1040 NM. p. 615
- Gustafsson et al. (2008) Gustafsson B., Edvardsson B., Eriksson K., Jørgensen U. G., Nordlund Å., Plez B., 2008, A&A, 486, 951
- Hill & Landstreet (1993) Hill G. M., Landstreet J. D., 1993, A&A, 276, 142
- Hubeny et al. (1994) Hubeny I., Hummer D. G., Lanz T., 1994, A&A, 282, 151
- Hummer & Mihalas (1988) Hummer D. G., Mihalas D., 1988, ApJ, 331, 794
- Idiart & Thévenin (2000) Idiart T., Thévenin F., 2000, ApJ, 541, 207
- Khalack (2018) Khalack V., 2018, private communication
- Kochukhov (2007) Kochukhov O. P., 2007, in Romanyuk I. I., Kudryavtsev D. O., Neizvestnaya O. M., Shapoval V. M., eds, Physics of Magnetic Stars Spectrum synthesis for magnetic, chemically stratified stellar atmospheres. pp 109–118
- Kunzli & North (1998) Kunzli M., North P., 1998, A&A, 330, 651
- Landstreet (1998) Landstreet J. D., 1998, A&A, 338, 1041
- Lodders et al. (2009) Lodders K., Palme H., Gail H.-P., 2009, Landolt Börnstein
- Mashonkina et al. (2007) Mashonkina L., Korn A. J., Przybilla N., 2007, A&A, 461, 261
- Mashonkina et al. (2017) Mashonkina L., Sitnova T., Belyaev A. K., 2017, A&A
- Meléndez et al. (2007) Meléndez M., Bautista M. A., Badnell N. R., 2007, A&A, 469, 1203
- Mihalas (1973) Mihalas D., 1973, ApJ, 179, 209
- Nayfonov et al. (1999) Nayfonov A., Däppen W., Hummer D. G., Mihalas D., 1999, ApJ, 526, 451
- Nieva & Przybilla (2012) Nieva M.-F., Przybilla N., 2012, A&A, 539, A143
- Piskunov et al. (2017) Piskunov N., Ryabchikova T., Pakhomov Y., Sitnova T., Alekseeva S., Mashonkina L., Nordlander T., 2017, in Balega Y. Y., Kudryavtsev D. O., Romanyuk I. I., Yakunin I. A., eds, Stars: From Collapse to Collapse Vol. 510 of Astronomical Society of the Pacific Conference Series, Program Package for the Analysis of High Resolution High Signal-To-Noise Stellar Spectra. p. 509
- Piskunov & Valenti (2017) Piskunov N., Valenti J. A., 2017, A&A, 597, A16
- Preston (1974) Preston G. W., 1974, ARA&A, 12, 257
- Ryabchikova et al. (2015) Ryabchikova T., Piskunov N., Kurucz R. L., Stempels H. C., Heiter U., Pakhomov Y., Barklem P. S., 2015, Phys. Scr, 90, 054005
- Ryabchikova et al. (2016) Ryabchikova T., Piskunov N., Pakhomov Y., Tsymbal V., Titarenko A., Sitnova T., Alexeeva S., Fossati L., Mashonkina L., 2016, MNRAS, 456, 1221
- Ryabchikova (2005) Ryabchikova T. A., 2005, Astronomy Letters, 31, 388
- Samson & Berrington (2001) Samson A. M., Berrington K. A., 2001, Atomic Data and Nuclear Data Tables, 77, 87
- Seaton (1962) Seaton M. J., 1962, in Bates D. R., ed., Atomic and Molecular Processes The Theory of Excitation and Ionization by Electron Impact. p. 375
- Seaton et al. (1994) Seaton M. J., Yan Y., Mihalas D., Pradhan A. K., 1994, MNRAS, 266, 805
- Shulyak et al. (2004) Shulyak D., Tsymbal V., Ryabchikova T., Stütz C., Weiss W. W., 2004, A&A, 428, 993
- Sitnova et al. (2013a) Sitnova T. M., Mashonkina L. I., Ryabchikova T. A., 2013a, Astronomy Letters, 39, 126
- Sitnova et al. (2013b) Sitnova T. M., Mashonkina L. I., Ryabchikova T. A., 2013b, Astronomy Letters, 39, 126
- Sitnova et al. (2016) Sitnova T. M., Mashonkina L. I., Ryabchikova T. A., 2016, MNRAS, 461, 1000
- Steenbock & Holweger (1984) Steenbock W., Holweger H., 1984, A&A, 130, 319
- Tsymbal (1996) Tsymbal V., 1996, in Adelman S. J., Kupka F., Weiss W. W., eds, M.A.S.S., Model Atmospheres and Spectrum Synthesis Vol. 108 of Astronomical Society of the Pacific Conference Series, STARSP: A Software System For the Analysis of the Spectra of Normal Stars. p. 198
- van Regemorter (1962) van Regemorter H., 1962, ApJ, 136, 906
- Wahlgren & Hubrig (2004) Wahlgren G. M., Hubrig S., 2004, A&A, 418, 1073
- Woolley & Allen (1948) Woolley R. D. V. R., Allen C. W., 1948, MNRAS, 108, 292