Ordinary muon capture studies for the matrix elements in decay
Abstract
HPGe detectors were used to make a precise measurement of the -ray spectrum produced following ordinary (non-radiative) capture of negative muons by natural Se, Kr, Cd and Sm. The measurement was repeated for isotopically-enriched 48Ti, 76Se, 82Kr, 106Cd and 150Sm targets. By investigating energy and time distributions, the lifetime of negative muons in the different isotopes was deduced. A detailed analysis of the intensity of the -lines enabled the extraction of the relative yields of several daughter nuclei. The partial rates of capture to numerous excited levels of the 48Sc, 76As, 82Br, 106Ag and 150Tc isotopes (considered to be virtual states of the intermediate odd-odd nuclei in the decay of 48Ca, 76Ge, 82Se, 106Cd and 150Nd, respectively) were also extracted. These rates are important as an experimental input for the theoretical calculation of the nuclear matrix elements in decay.
pacs:
23.40.-s, 23.40.Hc, 27.40.+z, 27.50.+e, 27.60.+j, 27.70.+qI INTRODUCTION
The search for the hypothetical neutrinoless double-beta decay of atomic nuclei is currently the only practical method of determining the Majorana nature of the neutrino. In order to occur, the decay requires the violation of lepton-number conservation, and a non-zero neutrino mass. Due to the importance of the related beyond-the-Standard-Model physics, it is of interest to study -decaying nuclei, both by experimental and theoretical means. Large experimental collaborations have been established in order to measure the half-lives in current and future underground experiments. The connection between any measured half-life and the fundamental observables, like the electron neutrino mass, is provided by the nuclear matrix elements (NMEs) Suhonen and Civitarese (1998).
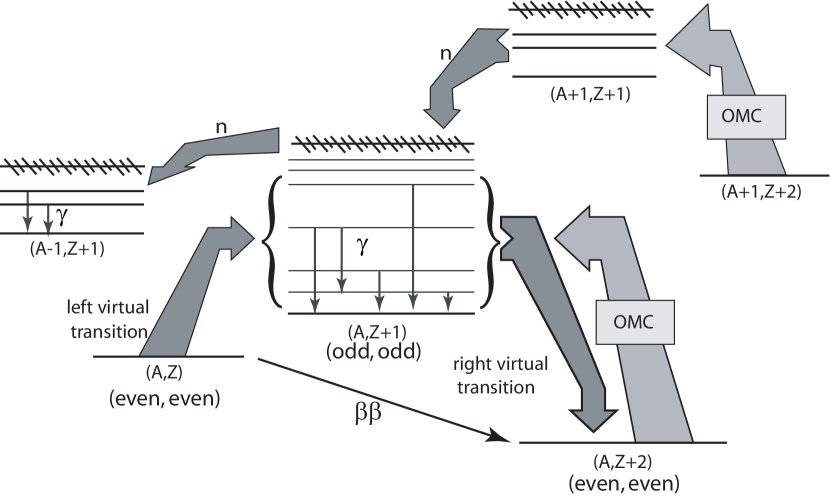
Nuclear models aimed at the description of the NMEs of decays have traditionally been tested in connection with two-neutrino () decays Suhonen and Civitarese (1998); Engel and Menéndez (2017) and decays Suhonen (2005). In Kortelainen and Suhonen (2002) it was proposed that the ordinary muon capture (OMC) could also be used for this purpose, as well. The and decays are low-momentum-exchange processes ( a few MeV), whereas both and OMC are high-momentum-exchange processes ( MeV). In this way the and OMC are similar processes and possess similar features: they are able to excite high-lying nuclear states with multipolarities higher than . The decay proceeds between the ground states of parent and daughter even-even nuclei through virtual states of the intermediate odd-odd nucleus. These same virtual states can be accessed by the OMC from either the daughter nucleus (electron-emitting decays, see Fig. 1) or the parent nucleus (positron-emitting/electron-capture decays).
The ability of the OMC to access high-energy and high-multipolarity virtual states of the decay is a strong asset of the process, as is the similarity of the two processes in terms of the energy scale of the momentum exchange. There are also differences between the processes, stemming from factors such as the neutrino potential generated by the propagator of the virtual Majorana neutrino in the decay M. Doi and Takasugi (1985). Despite this difference, the OMC can effectively probe the nuclear wave functions relevant for the decay, as shown for the light nuclei in the shell-model framework in Kortelainen and Suhonen (2004).
For the medium-heavy and heavy open-shell nuclei, the shell-model framework is unfeasible due to computational limitations. For these nuclei, the model framework of the quasiparticle random-phase approximation (QRPA) Suhonen (2007) is a good choice. In particular, the proton-neutron version of the QRPA (pnQRPA) can access the virtual intermediate states of the decays Suhonen and Civitarese (1998). The key issue with the pnQRPA approach is the uncertainty associated with one of its key parameters, the particle-particle interaction strength . This parameter is used to introduce a phenomenological overall scaling of the particle-particle part of the proton-neutron interaction Vogel and Zirnbauer (1986). It is not clear how this scaling should be modelled for decays since there is no experimental data for transitions from either the mother or daughter nuclei to the multipole intermediate states. The , and to some extent, the , states can be probed by the and charge-exchange reactions Frekers et al. (2017). In this case the only viable method to investigate this “ problem” is the OMC Kortelainen and Suhonen (2003). By using experimental data on OMC to individual intermediate states, one can access the value of for each multipole separately, and at the same time can study the consistency of these values, by comparing with the measured OMC rates for a wider palette of nuclear states.
In order to give an experimental input to NME calculation, it was proposed in Kortelainen and Suhonen (2002); Egorov et al. (2002) to measure partial muon capture rates in corresponding isotopes (Fig. 1). Due to a high momentum transfer, numerous excited states of the intermediate nucleus are populated, and thus their “functions can be touched” through the transition intensities.
It should be mentioned that the OMC reaction is typically an order of magnitude less probable than the similar process where the muon capture is followed by the emission of one or two neutrons: , . As a result, even a small contamination of the target with heavier isotopes or could cause significant background, as , reactions in the contaminating isotope would populate the same excited daughter states as OMC interactions in the target. It is therefore very important to use isotopically enriched targets without significant content of or isotopes. In this work we describe -capture measurements on isotopically enriched 48Ti, 76Se, 82Kr, and 150Sm, all products of decay, and on 106Cd, which is the parent nucleus in decay. The preliminary results of this work are also published in Zinatulina et al. (2017).
II EXPERIMENT
II.1 Different types of events registered in the OMC experiment.
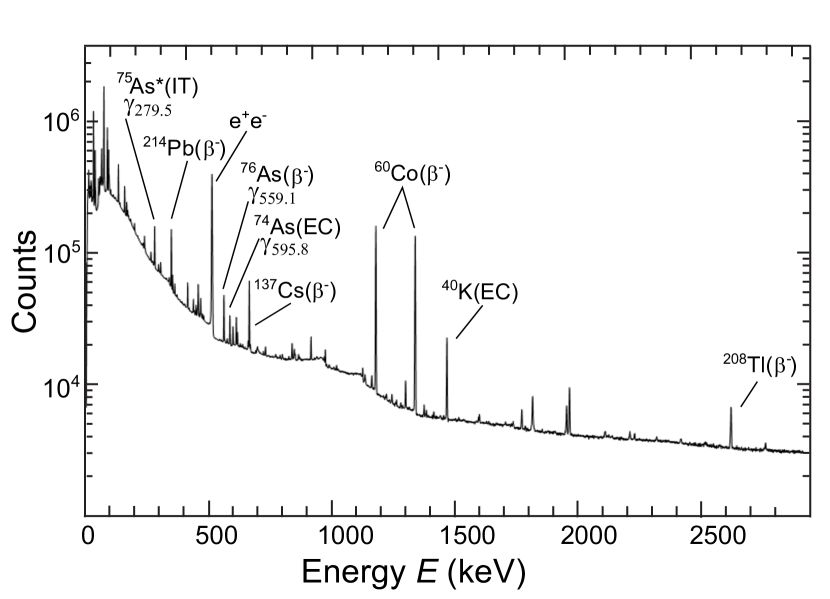
All information from detectors can be divided into two types – events correlated and uncorrelated in time with incoming muons. If a signal from the detector was not preceded by a muon stopped in the target within some time window 111The duration of should be set at a level of few microsecond depending on the expected muon life time in the given target. – then the event is considered as Uncorrelated. To save disk space, uncorrelated events may not be individually recorded, but their energies will be used to generate a U-spectrum of uncorrelated energy measurements.
A typical U-spectrum (Fig. 2) includes -lines of natural (40K, U- and Th-chains) and man-made (60Co, 137Cs) background, as well as beam-induced -reactions. The above lines could be used to calibrate the detectors. The OMC products are frequently unstable, emitting -rays as they decay. The intensity of these -rays in the U-spectrum allows the yield of the individual isotopes and isomers to be extracted.
Correlated events - those which occur within the time window immediately after the -stop - are more informative. The majority of these events are caused by a cascade of so-called muonic X-rays (X) – high energy photons emitted by muonic atom during its transition to the 1s-state from a Rydberg state (Fig. 3a). The de-excitation process takes place within picoseconds - negligible for this measurement - meaning that X-raycan be considered Prompt radiation.

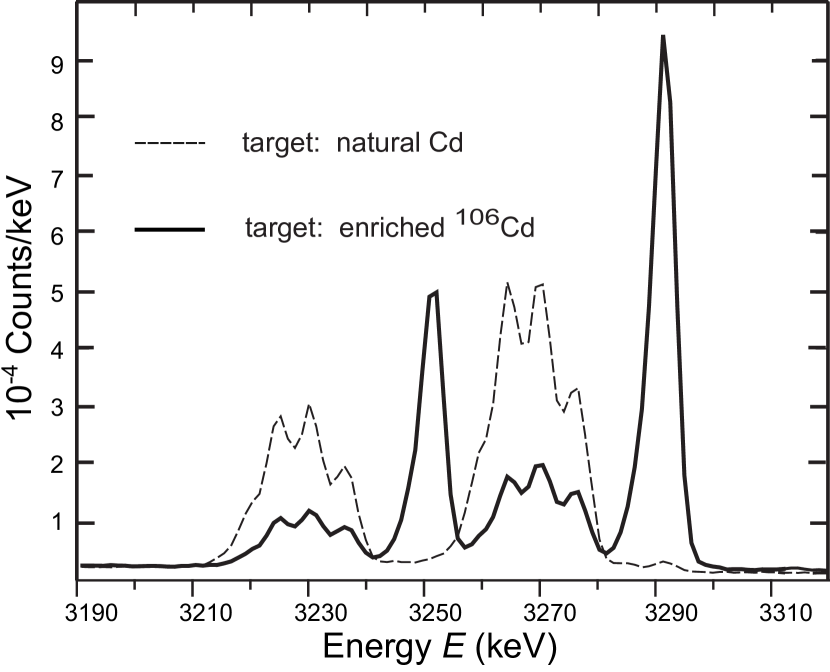
A muon is heavier than an electron by a factor of 200. Therefore, energy of X is higher by the same factor with respect to conventional X-rays, and the radius of the muonic orbit is comparable with nuclear dimensions. In fact, for muonic atoms with , the muon’s orbit is within the nucleus. As a result, an energy spectrum of X-rays becomes very sensitive to the collective properties of the nucleus (mass and charge distribution, etc.). Fig. 4 demonstrates isotopic shift of transition doublet measured with two targets: isotopically enriched (enrichment of 106Cd is about 63%) and natural (abundance of 106Cd is 50 times lower – 1.25%). A dedicated investigation of muonic X-rays is outside the scope of this work. However, as a by-product of this study, we have generated a catalogue of our muonic X-ray measurements Zinatulina et al. (2018); it is available in interactive mode at Egorov et al. (2016).
As each -stop in a target is followed by characteristic X-rays, the intensity of each spectral line reflects the number of -stops in the corresponding isotope. Therefore X spectra could be used to normalize any measurement by the number of muons.
In addition to these prompt events, Delayed correlated events correspond to the nuclear radiation following muon capture in the reactions. This particular radiation is the main subject of our work.
As it is related to muon decay, the rate at which the OMC process takes place has a probability distribution. As a result, the corresponding -rays do not appear immediately, but have an exponentially-distributed delay (Fig. 5). The exponent depends on the OMC probability.
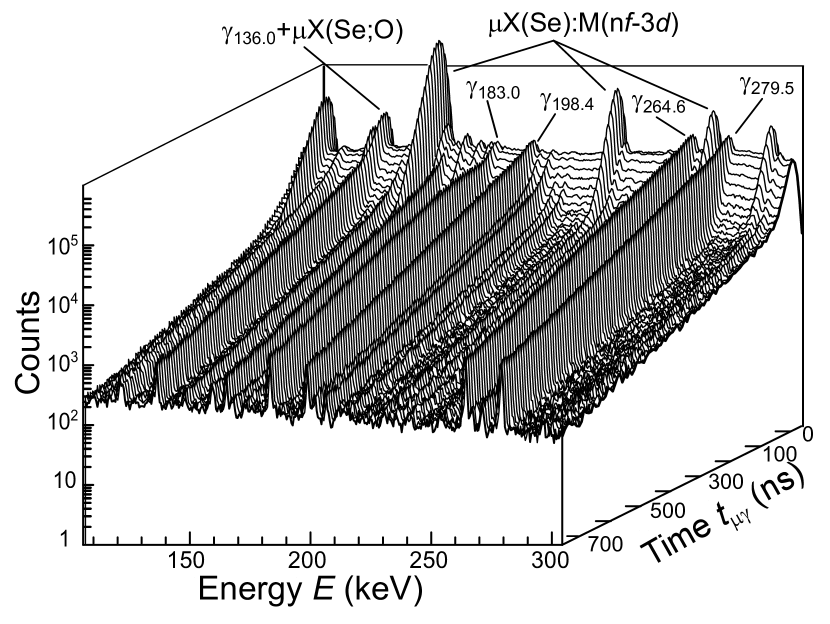
By analyzing the time evolution of the individual -line(s), one can extract the OMC probability for each corresponding product (contrast with the commonly used inclusive method, which is based on the detection of -decay electrons Measday (2001)). The relative intensity of the delayed lines (with respect to X-rays) allows the extraction of partial capture rates to the individual excited states of the daughter nucleus. Prompt and Delayed spectra (Fig. 3b) could be partially separated from each other using different time cuts (for instance, to simplify -line identification).
II.2 Experimental approach.
In order to optimize the experiment, the following conditions should be satisfied:
-
•
the muon energy must be high enough that it will enable muons to pass through materials upstream of the target (output window of the beam-line, muon counters, target entrance window, etc.);
-
•
the beam energy, and its dispersion, must be small enough to ensure that all muons will stop inside the target (especially in the case of gas, or low-mass enriched targets);
-
•
beam intensity must be high enough to provide good statistics;
-
•
the intensity must be low enough to prevent random coincidences;
-
•
the target must be thick enough to stop all the muons;
-
•
the target must be thin enough to prevent absorption of low-energy -rays;
-
•
the muon counters must be thick enough to produce good light signal;
-
•
the muon counters must be thin enough to prevent muons stopping in the counters.
Due to these conflicting requirements, only a few beams are able to satisfy all of the above conditions. It was eventually decided that three sets of measurements would be taken at the E4 and the E1 beam-lines of the Paul Scherrer Institute (Villigen, CH). The beam consisted of negative muons, emitted in a backward direction from pion decay in flight, yielding a muon momentum centered around 20–30 MeV/ with p/p at the level of 2%, and an intensity of approximately muons per second.
The target arrangement sketched in Fig. 6 consists of an active muon veto counter system C0 at the entrance of the target enclosure; two thin (0.5 mm) pass-through counters, C1 and C2; then the actual target area, surrounded by a cup-like counter C3. The target enclosure is constructed to accommodate both solid and gaseous materials. The C3 counter plays several roles: being a gas vessel itself, it is used, together with the pass-through counters, to define a -stop trigger:
| (1) |
as well as to discriminate against high-energy electrons from muon decay222Muon decay in the target area is a background process alternative to OMC. Electrons emitted have very high energy (up to 50 MeV), disturb operation of Ge detectors and produce intensive bremsstrahlung.. As it is made of low-Z material, C3 does not affect the measurement of low energy -rays with external detectors.
The beam momentum and position were tuned to maximize the intensity of X-ray from the target, while minimizing the background from the surrounding material. Under optimal conditions more than 95% of the data sample corresponded to muons stopped in the target. Typical rates during the experiments were between and and the total acquisition time was between and , depending on the target and isotopic enrichment.
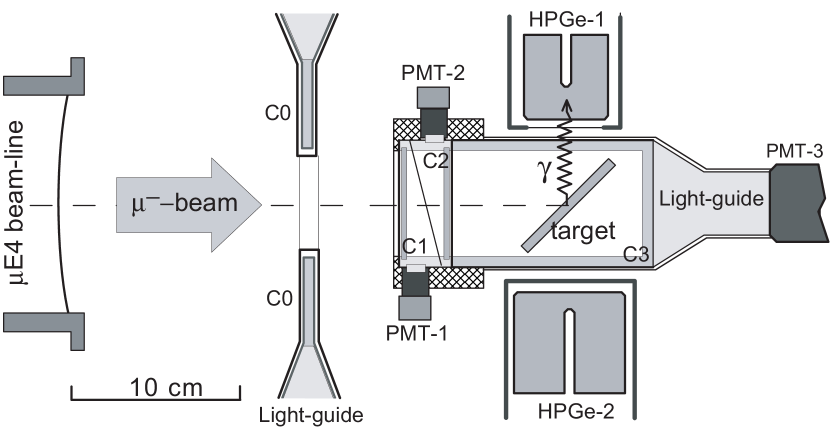
The X-rays and the delayed -rays following -capture were detected with four independent semi-coaxial HPGe detectors placed around the target at a distance of about 7–10 cm. The high-energy radiation that accompanies muon decay causes partial saturation of the analog electronics, generating artifacts in the energy spectrum. To reduce this effect, the shaping time of the spectroscopic amplifiers was kept as short as 1–2 s, which worsened the energy resolution, but optimized the general detector response function.
Three large-volume detectors (Ge-1 – Ge-3) were selected for detection of photon energies up to 10 MeV with good efficiency. The fourth (smaller) detector was dedicated to the detection of low-energy photons, typically below 100 keV, and was therefore equipped with a thin, low-absorptive beryllium entrance window.
In addition to calibrating with standard radioactive sources, several alternative methods were used to calibrate the energy and efficiency333Here, and henceforth, the “efficiency” refers to the probability that the whole of the absorption peak will be contained within the spectrum. The absolute efficiency value would also include the effect of the solid angle. over the full energy range (up to 10 MeV). The large-volume detectors were calibrated off-line using neutron-induced -rays from a NaCl radiator placed near a 252Cf neutron source. The 35Cl(n,)-reaction provides an intensive high-energy -ray line at 6111.0 keV and useful lines at 6619.7, 6627.9 and 6642.0 keV. In-beam neutron-capture processes on 56Fe and 28Si produce another series of high-energy -rays at well-known relative intensities up to about 8 MeV National Nuclear Data Center and Brookhaven National Laboratory (2007); Measday (2001). Prompt X-rays from oxygen, titanium, selenium, cadmium, samarium, gold and thorium, with energies ranging from 39 to 6319 keV, were also measured in several ad-hoc runs, each lasting a few hours. Other beam-induced radioactivity is also a source of useful high-energy -rays (i.e., 6128.6 keV from 16N decay). To get a wider dynamic range of the energy signals, each of the three large-volume detectors was connected to two independent spectrometric channels A and B with different gains, thereby providing seven energy signals in total (cf. Table 1).
A typical relative efficiency function constructed for the entire photon-energy range is shown in Fig. 7, together with an arbitrary smooth function describing its general energy dependence. The overall error for this function is estimated to be less then 5%. In the case of X-rays, the relative efficiency could be normalized by the overall number of -stop signals. Absolute efficiency obtained in this way, as well as some of the performance parameters of the various detectors, are quoted in Table 1.

| Det. | efficiency | efficiency | channel A | channel B | ||||
|---|---|---|---|---|---|---|---|---|
| @100 keV | @1.0 MeV | FWHM | FWHM | |||||
| Ge-1 | 1.32% | 0.43% | 4.34 | 2.85 | 7.66 | 10.0 | ||
| Ge-2 | 1.35% | 0.39% | 3.73 | 2.85 | 4.81 | 10.0 | ||
| Ge-3 | 1.12% | 0.32% | 3.84 | 2.85 | 10.32 | 10.0 | ||
| Ge-4 | 0.65% | 0.09% | 3.58 | 1.60 | — | — | ||
Large-volume semi-coaxial HPGe detectors are known to have relatively poor timing properties, especially at low -ray energy. Whereas high-energy -rays are detected more or less homogenously throughout the Ge crystal, low-energy -rays are absorbed in a thin layer close to the surface, which includes edge regions with relatively weak and non-uniform electric field. Charge collection in these regions is partially incomplete and spread out in time. As a result, a significant part of the low-energy signals experiences a time lag of up to a few hundred nanoseconds, and some missing charge, equivalent to up to a few hundred eV. Planar detectors with uniform field are free of this annoying property, but they come at a price of reduced efficiency in the MeV region. The measured timing characteristics of our current large-volume HPGe detectors are shown in Fig. 8, indicating the rapid deterioration of the timing resolution below about 200 keV. On the contrary, high energy X-rays are well-suited for monitoring timing stability throughout the experiment.

As both the Correlated and Uncorrelated spectra were important to us, signals from the HPGe detectors were given the highest priority, and served as a hard trigger. The event was identified as correlated or uncorrelated, using the -stop signal, delayed by the W value.
All the measured time and energy information for each target was saved as a separate subdirectory (RUN) once per hour. It consists of files with Uncorrelated (U) energy spectra (4 Ge detectors, A and B channels) and files with Correlated events. Each event includes values of energy and time corresponding to the signals registered by all HPGe detectors, as well as “flag” bits from the input register. The “flags” indicate the presence of other muons before or after the considered -stop, signals from C3 counter (caused by muon decay), Ge-Ge coincidences, “busy” signals, etc., which are used in off-line analysis. The time interval between the -stop and the Ge signal is used to distinguish between a Prompt (P) or a Delayed (D) signal, and to evaluate the muon lifetime in the target. In addition, each subdirectory includes a count rate of all HPGe detectors, counters C0-C3, number of -stops, dead time and other slow-control information.
As mentioned above, isotope-enriched targets are strongly preferable. On the other hand, measurements with the natural targets are also important for comparison and identification of numerous -lines in all spectra measured. Table 2 lists all the targets used in the present study.
| target | enrichment | composition | element | thickness |
|---|---|---|---|---|
| mass | mg/cm2 | |||
| 48Ti | 95.8% | TiO2 powder | 1.0 g | 250 |
| 76Se | 92.4% | Se granules | 5.0 g | 800 |
| natSe | – | Se granules | 5.0 g | 800 |
| 106Cd | 63.0% | Cd metallic foil | 5.0 g | 800 |
| natCd | – | Cd metallic foil | 5.0 g | 800 |
| 82Kr | 99.8% | Kr gas | 0.7 l (1 atm.) | 26.1 |
| natKr | – | Kr gas | 1.0 l (1 atm.) | 37.3 |
| 150Sm | 92.6% | Sm2O3 powder | 2.0 g | 320 |
| natSm | – | Sm2O3 powder | 2.0 g | 320 |
III EXTRACTION OF RATES
The time evolution of transitions in the daughter nucleus resulting from -capture in the target atom, is uniquely determined by the lifetime of the muonic atom. The total muon disappearance rate is
| (2) |
where and are the total -capture rate and free muon decay rate (0.4552 s-1), and is the Huff factor Huff (1961), which is introduced to account for the phase-space change in the decay of a muon bound in the atomic K-shell. A list of Huff factors used in the present analysis is given in Table 3.
| target | Huff factor |
|---|---|
| Ti | 0.98 |
| Se | 0.96 |
| Kr | 0.95 |
| Cd | 0.92 |
| Sm | 0.89 |
The procedure used to extract the total capture rate was developed in our previous work Fynbo et al. (2003); Egorov et al. (2006). It is based on observing the time evolution of the most intense -line. An example of the procedure is shown in Fig. 9.
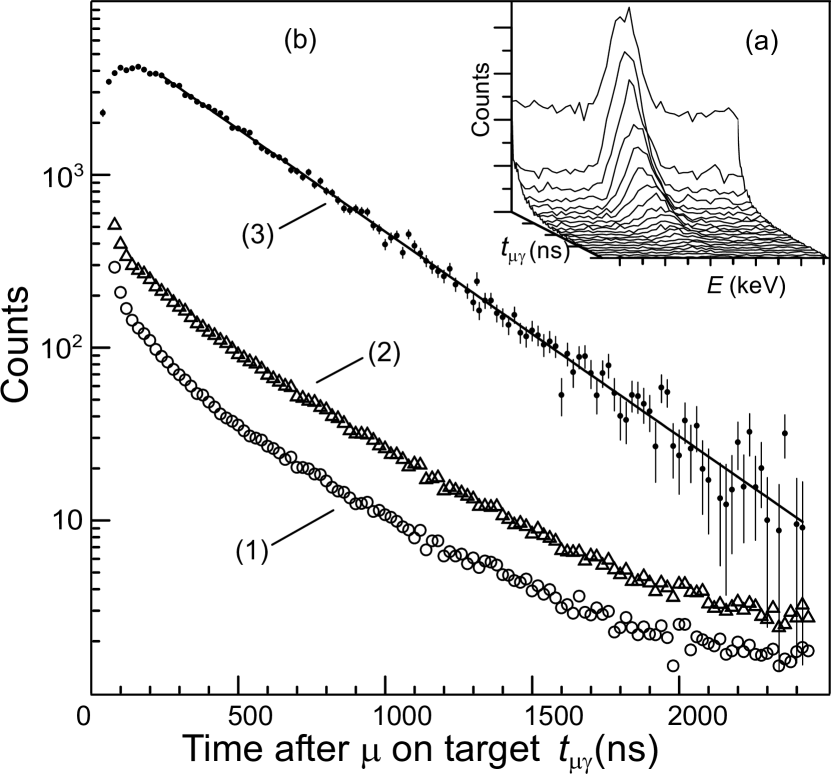
The measured -raycount is histogrammed in two dimensions: energy, and delay time , which is divided into bins of a few nanoseconds (see Fig. 9 inset). We then study a fragment of this histogram for the energy region containing a Line of Interest (LOI). The simplest way to analyze this is to plot the total count in the fragment containing the LOI (curve 1 in Fig. 9). However, this count contains not only -rayfrom muon capture, but also some background events. As the background may originate from different processes, it may therefore have a different time behavior (curve 2) from the signal; this means that curve 1 is not a pure exponential.
A more precise method involves fitting the energies in the fragment around the LOI to a Gaussian with five parameters:
| (3) |
where and represent parameters of the peak, and are the background parameters and is the extracted signal event count for energy fragment . Fitted values are presented as (3) in Fig. 9. Their exponential behavior is much more evident.
It should be mentioned that, for small values of , the exponential behavior is affected, not only by non-ideal detector timing, but also by the nonzero lifetime of the excited state (see, for instance, 183 keV line in Fig. 5). The later part of the time distribution is also slightly affected by random coincidences (which in our case are almost negligible). In order to estimate systematic error caused by the above effects and the analysis procedure, the exponent parameter was extracted several times: for each detector channel (Ge-1A…Ge-4B), for two different TDC and for different time bin intervals. An example of such extraction is given in Table 4. All of these results were averaged. The uncertainty was taken to be whichever was greater: the standard deviation of the weighted average value, or that of the statistical mean.
| /DoF | time bins | ||||
|---|---|---|---|---|---|
| [ns] | [ns] | from | – | to | |
| 143.92 | 0.54 | 2.04 | 5 | – | 70 |
| 141.84 | 0.69 | 1.79 | 5 | – | 65 |
| 142.83 | 0.95 | 1.86 | 5 | – | 60 |
| 143.73 | 1.09 | 1.97 | 10 | – | 60 |
| 142.28 | 0.77 | 1.91 | 10 | – | 65 |
| 143.51 | 0.66 | 1.95 | 10 | – | 68 |
All -lines observed for a given target should produce the same value (which is a property of the target, but not of the line). To obtain a central value for a target, individual measurements can be averaged as explained above. Some lines in the spectrum have ambiguous origins: an alternative reaction (as an example, being origin from the -capture in isotope with one neutron emission) or unknown admixture (-capture in other surrounding materials, the same energy of the -line produced by the different way ). In these cases, the value extracted will be unreliable, and should be excluded from the analysis.
As it was mentioned above in Eq. 2 muon disappearance rate includes the capture rate which in its turn consists of partial rates to the all states of the daughter nucleolus, including its ground state (=0), excited bound states (=1, 2, …), as well as higher excited states decaying with a nucleon(s) emission:
| (4) |
For the theoretical NME calculations it is important to know the partial capture rate or at-least the relative intensity of the -capture to the particular daughter state , i.e., a capture with no nucleon emission (the first term in Eq. 4). Defining the percentage of the muons captured to the particular state with respect to the total number of muons stopped in the given target isotope as a yield , the partial capture rate could be expressed as:
| (5) |
and the relative probability
| (6) |
While the total muon disappearance rate can easily be extracted using the above method, the extraction of partial -capture rates to the individual daughter states is less obvious, and requires a special approach. In a hypothetical ideal case the value of could be found as the ratio:
= .
In the reality, the state is populated not only by direct muon capture, but also by -feeding from the upper levels. That is why to extract the partial rates, it is necessary to evaluate in detail the relative intensities of the transitions between the bound states of the daughter nucleus (see for instance Gorringe et al. (1999); Siegbahn (1965); Beringer et al. (2012)). Unfortunately, the relevant level schemes of odd-odd final nuclei are poorly known444As normally they are not populated in conventional -decay., and therefore, in the present study one is forced to restrict oneself to the low-energy and well-established part of the level schemes.
Finally, the population of the state by OMC is found as a difference between the total intensity of the transitions discharging and feeding the particular level (here and thereafter all the intensities of -transitions, as well as the product yields are normalized by the number of -stops in the given chemical element):
| (7) |
The intensity of each555It should be mentioned that in principle there could be unobserved transitions (not intensive, highly converted, hidden by other intensive lines, etc.), but we believe that this contribution is not crucial. particular -line normalized by the number of -stops in the given isotope with the enrichment is extracted from the detailed analysis of D-spectra as:
| (8) |
where is the relative detector efficiency, and is the sum of intensities of the X-ray -series in the given isotope (cf. Fig. 3), and is an area of the peak in the spectrum. In case when the peak execution is doubtful (because of admixture from other isotopes/-lines, X-rays, etc.) its intensity could be estimated from intensity of other lines genetically related with the given one, using the branching information from the level scheme in National Nuclear Data Center and Brookhaven National Laboratory (2007).
As an example, Table 7 illustrates the detailed OMC data for the 48Ti target. The -lines which could not be identified and analyzed properly are not presented in that work.
The uncertainty of the partial capture rate was estimated as a full systematic error of indirect measurement (using the well known methods Beringer et al. (2012); Hudson (1963); Leo (1994)). The total error is a combination of the gamma-peak intensity error, uncertainties on the intensities of the K-series X-rays (used for gamma-peak normalization), the dispersions of the weighted average values of the and , the efficiency determination error, and the uncertainty on the relative intensity for the gamma-peak (taken from National Nuclear Data Center and Brookhaven National Laboratory (2007) database). The contribution of the uncertainty to the results in detailed balance is given in Table 5.
| Extracted | Origin of the | Uncertainty, | Comments |
| value | uncertainty | ||
| peak area | 1–25 | depends on the line intensity and the background | |
| detector efficiency | 5–20 | at low and high energy region it is increased | |
| relative branching ‡ | 2–30 | taken from National Nuclear Data Center and Brookhaven National Laboratory (2007) | |
| sum of the and | 22–43 | proportional to the total number of the feeding and discharging -lines | |
| 22–43 | |||
| 0.06–0.6 | dominated by admixture of heavier isotope in the enriched target | ||
| 0.06–0.6 | dominated by admixture of heavier isotope in the enriched target | ||
| ‡) was used only in case when the execution of the -peak is doubtful. | |||
The total capture rate of the produced nuclei (as well as total capture rate to all bound states ) and the probability that nuclei will be produced in reactions are:
| (9) | ||||
and
| (10) |
Unfortunately, the intensity of delayed -rays does not provide information on the partial capture rate to the ground () states, as they are not followed by the delayed -rays. Nevertheless, if the ground state of the daughter nuclei is unstable (//EC active) the gamma radiation with intensity (U) following decay of long-lived states can be found in U-spectra. That allowing us to estimate the activity of the daughter nuclei and to extract their total yield :
| (11) |
where is a branching ratio of the Uncorrelated -rays taken from the decay level scheme National Nuclear Data Center and Brookhaven National Laboratory (2007). Correction factor depends on the ratio between the measurement time and the life-time of the ground state . It takes into account the accumulation of long-lived activity and the resulting decay rates. If the nucleus is relatively short-lived () – then this factor is close to unity and could be neglected. Otherwise its estimation is more complicated (see for instance Leo (1994)) and in addition should include the target activation during the tuning periods, deactivation at the beam interrupts and variation of the beam intensity.
IV MEASUREMENT RESULTS
IV.1 48Ti target
1.5 g of 48TiO2 powder material was packaged into a thin mylar bag and placed inside the target compartment (cf. Fig. 6). The titanium was composed of: 46Ti – 0.8%, 47Ti – 1.2%, 48Ti – 95.8%, 49Ti – 1.4%, 50Ti – 0.8%. Total exposure time was 73 hours, and the average rate of -stops in the target was .
The X-rays in the prompt P-spectra, and the delayed -rays (in the D-spectra) that follow muon capture (corresponding to the de-excitation of the bound states of 48Sc) were investigated. The value was extracted, using the most intense delayed -lines. The results of the fit are shown in Fig.10. The exponential behavior of three lines, which share the same parameter, can be clearly seen. The -line at 370.3 keV the lowest energy of the three, which explains why the line demonstrates the highest deviation at short delay times (as explained in section II.2, Fig. 8). For the fourth -line (at 767.1 keV), the de-excitation of the corresponding isomeric state of 47Sc has a significant lifetime, leading to a non-exponential time dependence for this line.
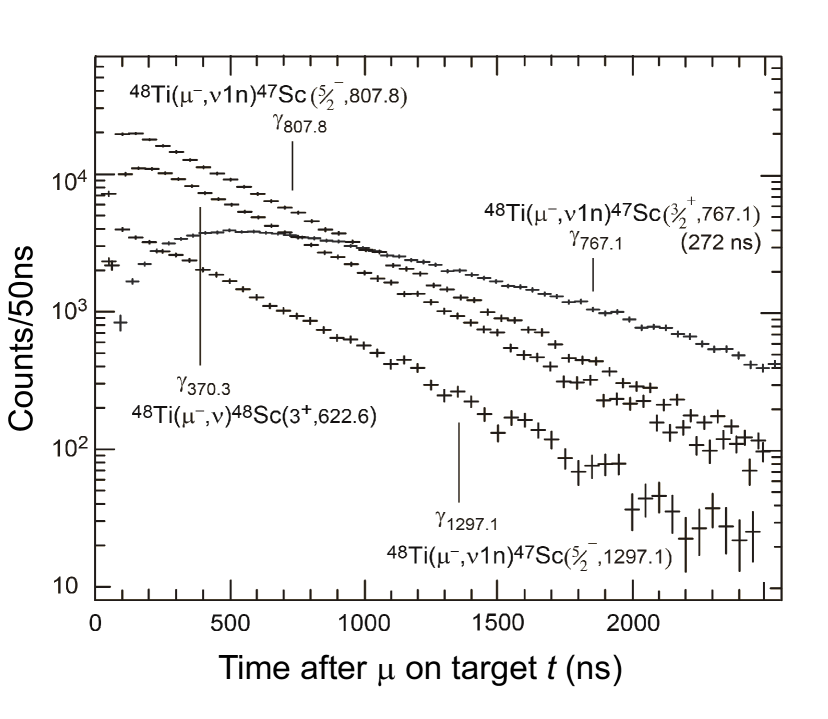
The obtained values of lifetime and total -capture rate are presented in Table 6, whereas the partial capture rates of the 48Ti(,)48Sc reaction are listed in Table 7.
| Target | Daughter | Target | Daughter | ||||||
| isotope | [keV] | [ns] | [s-1] | isotope | [keV] | [ns] | [s-1] | ||
| 48Ti | 48Sc | 370.3 | 363.8(26) | natSe | |||||
| 47Sc | 807.8 | 359.7(28) | 76As | 164.7 | 163.5(20) | 5.68(7) | |||
| 1297.1 | 358.0(40) | 77As | 215.5 | 165.9(19) | 5.59(7) | ||||
| Sc | 767.1 | 358(10)[+272] | 80Se | 79As | 109.7 | 185.5(27) | 4.96(7) | ||
| (*) | 361.1(24) | 2.323(15) | 82Se | 81As | 336.0 | 208.2(68) | 4.37(14) | ||
| 76Se | 75As | 198.6 | 148.4(7) | natCd | |||||
| 264.7 | 148.4(5) | 109Ag | 311.4 | 92.2(26) | 10.43(31) | ||||
| 279.5 | 148.6(5) | 110Ag | 483.7 | 95.0(70) | 10.11(75) | ||||
| 74As | 183.0 | 148.5(13) | 112Cd | 111Ag | 376.7 | 99.4(24) | |||
| (*) | 148.48(10) | 6.300(4) | 391.3 | 99.5(22) | |||||
| 106Cd | 105Ag | 346.8 | 73.2(5) | (*) | 99.45(5) | 9.600(5) | |||
| 433.2 | 72.4(8) | 114Cd | 113Ag | 270.8 | 102.2(16) | ||||
| (*) | 72.97(36) | 13.28(7) | 366.8 | 101.9(19) | |||||
| 82Kr | 82Br | 244.8 | 142.9(6) | 102.07(15) | 9.380(14) | ||||
| 81Br | 276.0 | 142.6(3) | 116Cd | 115Ag | 255.5 | 107.7(18) | 8.86(15) | ||
| 649.8 | 143.5(17) | natKr | |||||||
| 142.68(37) | 6.576(17) | 84Br | 408.2 | 160.1(27) | 5.81(10) | ||||
| 150Sm | 149Pm | 114.0 | 82.1(6) | 86Kr | 85Br | 345.2 | 173.5(26) | 5.33(8) | |
| 188.4 | 82.3(10) | ||||||||
| 198.6 | 83.0(10) | ||||||||
| 208.0 | 83.4(19) | ||||||||
| 211.2 | 81.8(9) | ||||||||
| 287.9 | 83.5(16) | ||||||||
| 148Pm | 219.8 | 83.1(21) | |||||||
| 233.0 | 81.7(21) | ||||||||
| 82.3(5) | 11.75(7) |
The experiment devoted to measuring -capture in 48Ti was performed twice, in 2001 and 2002. A great effort was made to achieve stability, and to acquire sufficient statistics to investigate the U-spectra. Unfortunately, in both experiments, the beam intensity was unstable. Most of the products of -capture in 48Ti are long-lived or stable; the shortest-lived isotope, 48Sc, has a lifetime of 43.67 hours, comparable with the total exposure. Investigation of the Uncorrelated spectra in this case was therefore very complicated, making it impossible to extract the total capture yield from the U-spectra with appropriate precision.
| Daughter OMC state | De-exciting transition | Final state | De-excitation ‡ | Feeding ‡ | Partial OMC ‡ | |||||
| [keV] | [keV] | [keV] | ||||||||
| 0 | ground state | |||||||||
| 130.9 | 130.9(4) | 100.0 | 0 | * | * | * | * | * | ||
| 252.4 | 121.4(4) | 100.0 | 130.9 | * | * | * | * | * | ||
| 622.6 | 370.3(5) | 100.0 | 252.4 | * | * | 57.7(523) | * | * | ||
| 1142.6 | 519.9(2) | 100.0 | 622.64 | 28.8(57) | 28.8(57) | 19.2(136) | 9.6(71) | 1.185(877) | ||
| 1401.6 | 259.1(2) | 4.2(11) | 1142.6 | 0.90(27) | 22.3(86) | 13.1(96) | 9.2(57) | 1.136(707) | ||
| 779.0(2) | 100.0(11) | 622.6 | 21.4(52) | |||||||
| 1891.1 | 489.3(3) | 72.5(20) | 1401.7 | 1.10(19) | 3.10(132) | 2.20(75) | 0.90(49) | 0.11(6) | ||
| 748.3(4) | 13.7(20) | 1142.6 | 0.20(4) | |||||||
| 1268.3(6) | 11.8(20) | 622.6 | 0.20(5) | |||||||
| 1638.8(3) | 100.0(20) | 252.4 | 1.60(34) | |||||||
| 2190.5 | 1567.7(3) | 28.2(13) | 622.6 | 1.90(84) | 8.80(486) | 4.4(8) | 4.40(256) | 0.55(32) | ||
| 1938.1(3) | 100.0(13) | 252.4 | 6.90(227) | |||||||
| 2275.5 | 1132.8(3) | 100.0(15) | 1142.6 | 4.0(16) | 5.7(34) | – | 5.70(337) | 0.71(42) | ||
| 1652.9(3) | 42.9(15) | 622.6 | 1.7(7) | |||||||
| 2517.3 | 1374.7(3) | 100.0 | 1142.6 | 4.1(18) | 4.1(18) | 0.0 | 4.10(181) | 0.52(23) | ||
| 2640.1 | 1238.4(3) | 100.0 | 1401.7 | 8.5(26) | 8.5(26) | – | 8.50(265) | 1.056(328) | ||
| 2670.3 | 1268.5(3) | 100.0 | 1401.7 | 1.5(5) | 1.5(5) | 0.0 | 1.50(47) | 0.19(6) | ||
| 2729.0 | 2476.6(8) | 100.0 | 252.4 | 1.5(6) | 1.5(6) | – | 1.50(63) | 0.19(8) | ||
| 2783.3 | 892.0(5) | 100.0(17) | 1891.1 | 2.20(75) | 3.8(27) | – | 3.80(267) | 0.47(33) | ||
| 1381.9(5) | 58(4) | 1401.7 | 1.30(55) | |||||||
| 2160.4(8) | 12(7) | 622.6 | 0.30(14) | |||||||
| 2980.8 | 1838.3(3) | 100 | 1142.6 | 4.3(24) | 4.3(24) | 0.0 | 4.30(235) | 0.53(29) | ||
| 3026.2 | 835.6(5) | 100(7) | 2190.5 | 4.4(8) | 9.5(58) | – | 9.5(58) | 1.175(717) | ||
| 1624.4(5) | 17(5) | 1401.7 | 0.70(25) | |||||||
| 1883.8(6) | 22(5) | 1142.6 | 1.0(3) | |||||||
| 2403.7(6) | 78(5) | 622.6 | 3.4(10) | |||||||
| 3056.5 | 1913.9(3) | 100 | 1142.6 | 3.6(19) | 3.6(19) | 0.0 | 3.60(192) | 0.45(24) | ||
| 3149.9 | 2007.3(3) | 100 | 1142.6 | 1.1(6) | 1.1(6) | – | 1.10(63) | 0.14(8) | ||
| ‡) the results of the present work. | ||||||||||
| *) the -line is distorted by other intense lines, and cannot be extracted. | ||||||||||
| –) no reference data available. | ||||||||||
IV.2 76Se and natSe targets
The targets for these measurements were made from metallic selenium powder (cf. Table 2) in a thin plastic bag. The enriched target was composed of: 74Se – 0.07%, 76Se – 92.4%, 77Se – 1.17%, 78Se – 2.28%, 80Se – 3.44%, 82Se – 0.64%. A measurement with a natural selenium target was also performed. The number of muon stops in the experiment with the enriched target was about and the exposure time was . The number of stops with the natural selenium target was about ; total acquisition time for the spectra was .
The -lines (corresponding to de-excitation of the bound states of 76As, as well as the most intensive -lines in the D-spectra of the enriched and natural targets) in P- and D-spectra were investigated. Measured -capture rates in different Se isotopes are shown in Fig. 11.
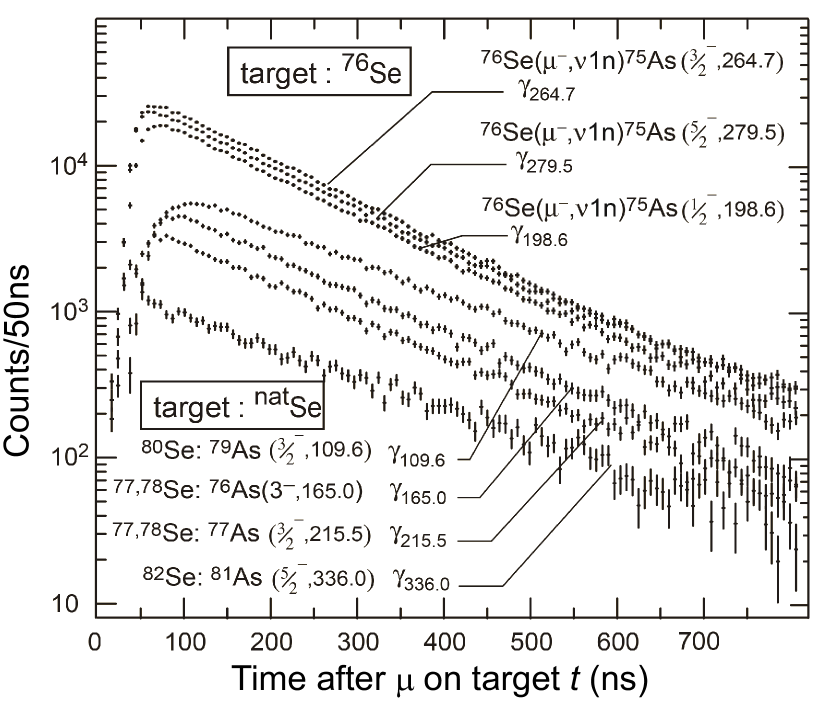
The curves in the figure are divided into two parts: the -lines corresponding to the enriched target 76Se, and the -lines measured with the natSe target. The exponential behavior of the lines corresponding to the enriched target, which share the same parameter, is clearly seen. The -lines corresponding to other isotopes have a different slope, and also show deviation at short times, corresponding to charge collection in the low-energy region. Extracted life-times and -capture rates in different selenium nuclei are presented in Table 6 and in Zinatulina et al. (2008). Partial capture probabilities for the 76Se(,)76As reaction are presented in Table 8.
| [keV] | [keV] | [keV] | ||||||
|---|---|---|---|---|---|---|---|---|
| 0.0 | g.s. | 499.6 | 0.99(36) | 802.4 | 0.17(10) | |||
| 120.3 | 0.32(12) | 505.2 | 0.25(6) | 863.3 | 0.27(20) | |||
| 122.2 | 0.21(11) | 517.6 | ) | 0.24(11) | 893.2 | 0.23(10) | ||
| 165.0 | 0.54(31) | 544.0 | 0.39(24) | 924.7 | ( 3)- | 0.24(10) | ||
| 203.5 | 0.08(4) | 610.0 | (1,2,) | 0.68(20) | 939.7 | 0.33(25) | ||
| 280.3 | 0.11(5) | 640.1 | (,) | 0.18(9) | 958.4 | 3 | 0.13(8) | |
| 292.6 | 0.05(1) | 669.1 | (,) | 0.64(20) | 985.5 | 0.21(12) | ||
| 328.5 | 0.09(4) | 681.1 | 0.33(10) | 1026.2 | 0.96(24) | |||
| 352.4 | 0.05(2) | 734.4 | ( 4)- | 0.08(4) | 1034.2 | 0.13(8) | ||
| 401.8 | 0.41(26) | 751.8 | (,1,2) | 0.37(19) | 1064.5 | 0.23(15) | ||
| 436.8 | 0.28(13) | 756.6 | 0.26(10) | |||||
| 447.2 | 0.46(23) | 774.4 | 0.23(11) | |||||
| 471.0 | 0.05(4) | 793.6 | 0.20(15) |
As mentioned above, (cf. in II.1 and in III) the intensities of transitions in U-spectra could be used to extract the production rates of the ground and isomeric states for the ( + 76Se) reaction. The results are presented in Table 9.
| isotope | decay type | s | ||
|---|---|---|---|---|
| 76As | 26.3 h | 0.86(3) | 13.65(255) | |
| 75mAs | IT | 17.6 ms | 0.41(7) | 6.5(11) |
| 75As | stable | unmeasured | ||
| 74As | , EC | 17.8 d | 1.1(2) | 17.5(32) |
| 73As | EC | 80.3 d | unmeasured | |
| 72As | 26 h | 0.15(3) | 2.4(5) | |
| 71As | 65.3 h | 0.061(18) | 0.96(28) | |
| 75mGe | IT | 48 s | 0.047(13) | 0.75(21) |
| 75Ge | 82.8 min | 0.054(2) | 0.86(3) | |
| 71mGe | IT | 20 ms | 0.020(3) | 0.32(5) |
| 74Ga | 8.1 min | 0.026(6) | 0.40(9) | |
| 72Ga | 14.1 h | 0.026(7) | 0.40(11) | |
| =43.7(43) | ||||
| 150Pm | 2.68 h | 1.45(11) | 12.3(9) | |
| 149mPm | IT | 35 s | 1.80(31) | 15.3(26) |
| 149Pm | 53.1 h | 2.93(60) | 24.9(51) | |
| 148Pm | 5.37 d | 0.77(26) | 6.6(22) | |
| 148mPm | IT | 41.3 d | 0.10(2) | 0.85(17) |
| 148mPm | 41.3 d | 0.21(6) | 1.79(51) | |
| 149Nd | 1.73 h | 0.78(35) | 6.6(29) | |
| 148Nd | stable | unmeasured | ||
| =68.3(69) | ||||
In the case when the half-life of the decaying nucleus is comparable with the exposure time (154 h), the value of the yield is corrected for the decay. The extracted probability of the bound states of 76As is in a good agreement with the sum of corresponding partial capture probabilities presented in Table 8. According to Measday (2001) it is expected that 75As is produced with the highest yield, since the most probable interaction emits a single neutron. The yields of other nuclei decrease with the number of nucleons emitted. Unfortunately, as 75As is a stable nucleus, it does not reveal itself in the U-spectrum. This also applies to the long-lived isotope 73As.
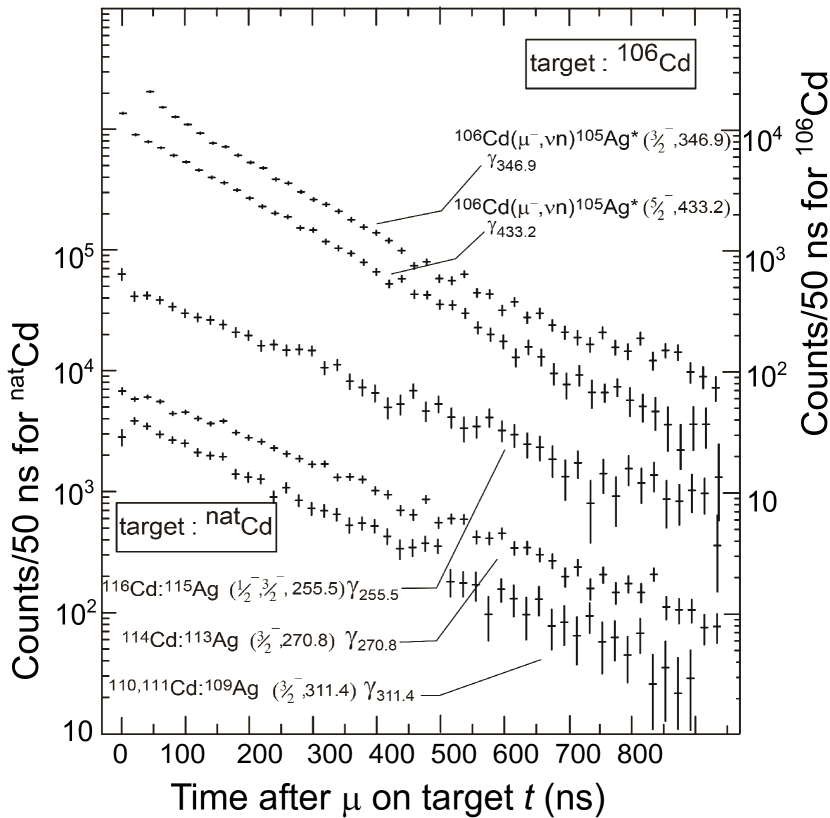
IV.3 106Cd and natCd targets
Both cadmium targets were made of metallic foil (cf. Table 2). The enriched target was composed of: 106Cd – 63%, 108Cd – 0.6%, 110Cd – 4.5%, 111Cd – 4.7%, 112Cd – 10.8%, 113Cd – 4.0%, 114Cd – 10.3%, 116Cd – 1.8%. The fragment of the P-spectrum shown in Fig. 4 demonstrates the isotopic shift of and X-ray doublet. The 106Cd enrichment of the target extracted from these spectra, 63(2)%, agrees with the certificate data. The 106Cd content of the enriched target is 50 times higher than its natural abundance (1.25%). The exposure with the enriched target was ; the number of stops was . With the natural target it was and , respectively.
The evolution of the strongest -lines following OMC in 106Cd and natCd is shown in Fig. 12. The difference in the exponential behavior (except for the two top lines, both of which correspond to 106Cd) is obvious, and is explained by the differing values for the different isotopes. The measured total -capture rates for different cadmium isotopes are presented in Table 6 (see also Zinatulina et al. (2008)). The muon lifetime in 106Cd was measured with the enriched target, while the muon lifetimes for different cadmium isotopes were measured with the natural target. The lifetime in 108Cd could not be measured because of its low abundance in the target, 0.89%.
The extracted partial muon capture probabilities are listed in Table 10. Analysis of D-spectra showed many -lines corresponding to the ROI. However, extracting the partial capture rates for this region was challenging, due to contamination from other -lines and from -rayproduced following OMC in the ( + 106Cd) reaction. Such results are not presented in the Table.
| [keV] | [keV] | [keV] | ||||||
|---|---|---|---|---|---|---|---|---|
| 0 | g.s. | 542.6 | 0.39(26) | 861.6 | 0.31(13) | |||
| 89.7 | isom.state | 565.1 | 1.07(66) | 917.4 | 0.30(17) | |||
| 110.7 | 0.67(47) | 596.0 | 0.60(49) | 936.5 | 0.23(13) | |||
| 205.9 | 0.37(34) | 597.3 | 0.72(52) | 1003.4 | 0.34(20) | |||
| 234.6 | 0.64(41) | 602.8 | 0.60(32) | 1063.2 | 0.26(11) | |||
| 277.0 | 1.43(115) | 661.3 | 0.61(33) | 1133.9 | 0.08(6) | |||
| 364.4 | 0.51(41) | 698.2 | 0.36(23) | 1145.1 | 0.18(12) | |||
| 389.1 | 0.66(50) | 730.4 | () | 0.34(13) | 1303.3 | 0.26(15) | ||
| 416.6 | 0.92(51) | 741.6 | 0.43(22) | 1329.5 | 0.37(20) | |||
| 425.0 | 0.57(37) | 765.2 | 0.23(19) | |||||
| 449.1 | 0.22(10) | 769.7 | 0.30(17) | (to g.s.)=12.36(201) | ||||
| 468.8 | 0.06(4) | 812.0 | () | 0.21(18) | (to and )=14.26(220) |
The U-spectra in the ( + 106Cd) reaction have been analysed. We do not observe the -lines that would follow electron capture in the isomeric state of 106Ag. Nevertheless, the (indirect) yield of this metastable state is non-zero - about 2%, which follows from the balance of -rays in D-spectrum. In U-spectra we observe the -lines following -decay and EC of the ground states of 106Ag, 105Ag and 104Ag. All these lines, unfortunately, are contaminated with other strong -lines of very similar energy and therefore it is impossible to extract their intensity with appropriate precision.
IV.4 The Sm and Kr results
For the measurements with Sm the targets (natSm and enriched 150Sm) were packed in thin mylar films containing samarium oxide (cf. Table 2). The enriched 150Sm target was composed of: 144Sm – 0.10%, 147Sm – 0.60%, 148Sm – 0.50%, 149Sm – 2.30%, 150Sm – 92.6%, 152Sm – 3.20%, 154Sm – 0.70%. A test measurement with the natSm target was used only to identify the -lines. Total irradiation of a 150Sm target was 68 hours with stops number of .
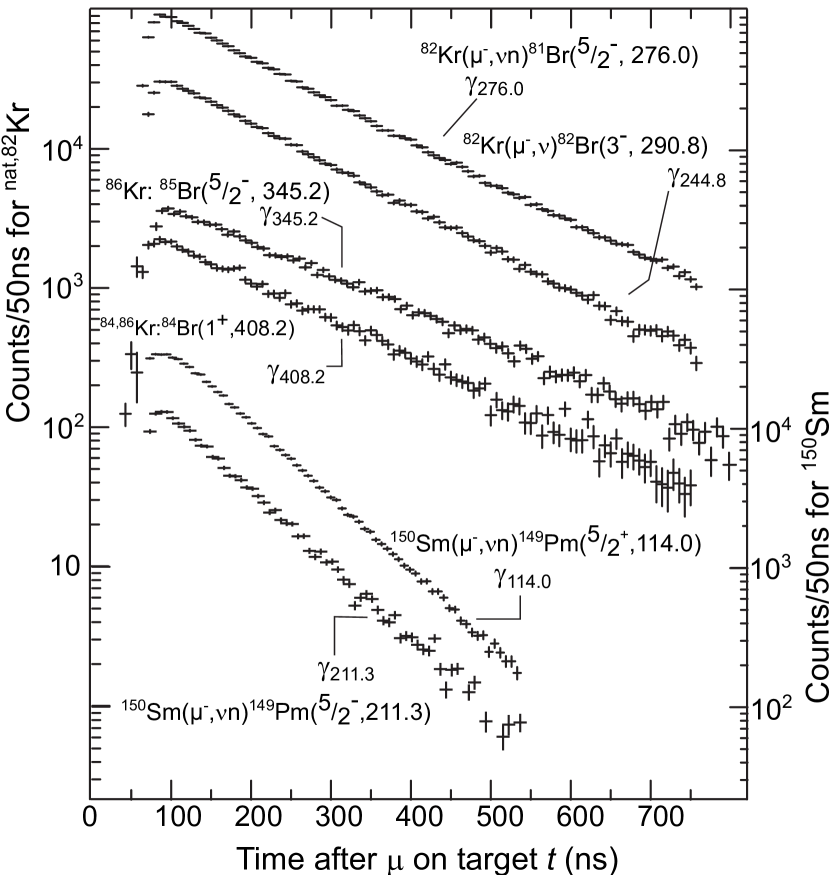
The results of two strongest lines from D-spectra in 150Sm are shown in Fig. 13. Lifetime and -capture rate in 150Sm nucleus are presented in Table 6. The procedure of this experiment with 150Sm and natSm was also presented in Zinatulina et al. (2010).
As mentioned in Zinatulina et al. (2010), it was impossible to extract partial capture rates, as no information about the excited 150Pm energy levels was available in National Nuclear Data Center and Brookhaven National Laboratory (2007) at the time of publication. However, Zinatulina et al. (2010) includes all the delayed transitions that we observed upon the irradiation of the 150Sm target by negative muons. Increased data on the energy levels has since become available Wang et al. (2012), and will be used in our group’s current studies.
Seven isotopes (isomers) in the -capture process in 150Sm were identified in the U-spectra. The decay -ray intensities of these isotopes were used to determine the yields of these nuclei. The obtained isotope yields are listed in Table 9.
The experiment with natKr and enriched 82Kr requires special construction of a gas target, in order to prevent any loss of this expensive noble gas; to minimize absorption of low-energy -rays; and to ensure maximum percentage of muon stops in the gas, but not in the entrance window or other construction materials Zinatulina et al. (2013, 2007). The isotopic composition of the enriched target was the following: 78Kr – 0.01%, 80Kr – 0.05%, 82Kr – 99.8%, 83Kr – 0.05%, 84Kr – 0.01%, 86Kr – 0.01%.
For the measurements on 82Kr and natKr, 0.7 liters and 1 liter of gas respectively were kept under a pressure of 1 atm. in a vessel, placed inside a similar setup to that used for the solid targets (cf. Fig. 6). The total exposure time with 82Kr was ; for natKr total exposure was . The number of -stops was and , respectively.
The total capture rates curves for different isotopes of Kr are shown in Fig. 13 and numerical results are presented in Table 6. Unfortunately, too many low-lying excited states of 82Br are populated in this reaction. Moreover, parallel reactions with neutron(s) emission produce -lines in the same ROI. As a result, we have not succeeded in extracting partial capture rates in the 0n channel with sufficient precision. Therefore, we present only muon lifetimes.
V CONCLUSIONS
The experimental investigation of OMC in 48Ti, 76Se and natSe, 106Cd and natCd, 82Kr and natKr, 150Sm and natSm was performed using the PSI muon beam and HPGe detectors.
Time and energy distributions for X- and -rays were measured precisely.
The time evolution of specific -lines, as well as the intensities of Prompt X-lines, and Delayed and Uncorrelated -lines, were analyzed. As a result, the total capture rates and partial capture probabilities were extracted for different isotopes, and the yield of radioactive daughter nuclei was estimated. The results are expected to be useful in calculating NME’s for decay.
The extraction of the partial capture rates in the ( + 150Sm) reaction is in progress. It has been proposed that the 82Kr rates will be remeasured at the RCNP Hashim et al. (2016) negative muon beam (MuSIC, Osaka, Japan), with the MuSIC and UTM groups Ejiri (2000); Hashim et al. (2018) in the near future.
Theoretical efforts are already in progress to incorporate the results presented here into calculations within the QRPA framework.
VI AKNOWLEDGMENTS
This work was supported in part by Russian Foundation for Basic Research (grant 06-02-16587).
The authors are grateful to H. Ejiri, V. Kuzmin, O. Civitarese and F. Simkovic, and appreciate their participation in the fruitful discussion of this work.
Authors are very grateful to Cheryl Patrick for the fruitful discussion of the paper and especially for the English proofreading.
References
- Suhonen and Civitarese (1998) J. Suhonen and O. Civitarese, Phys. Rep. 300, 123 (1998).
- Engel and Menéndez (2017) J. Engel and J. Menéndez, Rep. Prog. Phys. 80, 046301 (2017).
- Suhonen (2005) J. Suhonen, Phys. Lett. B 607, 87 (2005).
- Kortelainen and Suhonen (2002) M. Kortelainen and J. Suhonen, Europhys. Lett. 58, 666 (2002).
- M. Doi and Takasugi (1985) T. K. M. Doi and E. Takasugi, Prog. Theor. Phys. Suppl. 83, 1 (1985).
- Kortelainen and Suhonen (2004) M. Kortelainen and J. Suhonen, J. Phys. G: Nucl. Part. Phys. 30, 2003 (2004).
- Suhonen (2007) J. Suhonen, From Nucleons to Nucleus: Concepts of Microscopic Nuclear Theory (2007).
- Vogel and Zirnbauer (1986) P. Vogel and M. R. Zirnbauer, Phys. Rev. Lett. 57, 3148 (1986).
- Frekers et al. (2017) D. Frekers et al., Phys. Rev. C 95, 034619 (2017).
- Kortelainen and Suhonen (2003) M. Kortelainen and J. Suhonen, Nucl. Phys. A 713, 501 (2003).
- Egorov et al. (2002) V. G. Egorov et al., “PSI experiment R-02-02,” (2002).
- Zinatulina et al. (2017) D. Zinatulina, V. Brudanin, V. Egorov, M. Shirchenko, and N. Rumyantseva, Proceedings, Matrix Elements for the Double beta decay Experiments (MEDEX’17): Prague, Czech Republic, AIP Conf. Proc. 1894, 020028 (2017).
- Zinatulina et al. (2018) D. Zinatulina, C. Briancon, V. Brudanin, V. Egorov, L. Perevoshchikov, M. Shirchenko, I. Yutlandov, and C. Petitjean, Evropenian Physical Journal (2018), arXiv:arXiv:1801.06969[nucl-ex] and submitted to PRJ [nucl-ex] .
- Egorov et al. (2016) V. Egorov et al., “Mesoroentgen spectra catalogue,” http://muxrays.jinr.ru (2016).
- Measday (2001) D. F. Measday, Phys. Rep. 354, 243 (2001).
- National Nuclear Data Center and Brookhaven National Laboratory (2007) National Nuclear Data Center and Brookhaven National Laboratory, http://www.nndc.bnl.gov (2007).
- Huff (1961) R. Huff, Ann. Phys. 16, 288 (1961).
- Fynbo et al. (2003) H. O. U. Fynbo et al., Nucl. Phys. A724, 493 (2003).
- Egorov et al. (2006) V. Egorov et al., Czech. J. Phys. 56, 453 (2006).
- Gorringe et al. (1999) T. P. Gorringe, D. S. Armstrong, S. Arole, M. Boleman, et al., Phys. Rev. C 60, 055501 (1999).
- Siegbahn (1965) K. Siegbahn, Alpha-, beta- and gamma-ray spectroscopy, Vol. 1, chapter 8 (Amsterdam : North-Holland, 1965).
- Beringer et al. (2012) J. Beringer et al. (Particle Data Group), Phys. Rev. D86, 010001 (2012).
- Hudson (1963) D. J. Hudson, Lectures on elementary statistics and probability (JINR, Dubna, 1963).
- Leo (1994) W. R. Leo, Techniques for nuclear and particle physics experiments: a how-to approach; 2nd ed. (Springer, Berlin, 1994).
- Zinatulina et al. (2008) D. R. Zinatulina et al., Bulletin of the Russian Academy of Sciences: Physics. 72, 783 (2008).
- Thies et al. (2012) J. H. Thies et al., Phys. Rev. C 86, 014304 (2012).
- Zinatulina et al. (2010) D. R. Zinatulina et al., Bulletin of the Russian Academy of Sciences: Physics. 74, 825 (2010).
- Wang et al. (2012) M. Wang, G. Audi, A. Wapstra, F. Kondev, M. MacCormick, X. Xu, and B. Pfeiffer, Chinese Physics C 36, 1603 (2012).
- Zinatulina et al. (2013) D. Zinatulina et al., AIP Conf. Proc. 1572, 122 (2013).
- Zinatulina et al. (2007) D. Zinatulina et al., AIP Conf. Proc. 942, 91 (2007).
- Hashim et al. (2016) I. Hashim, H. Ejiri, et al., “Proposal to WSS-MuSIC beamtime,” (2016).
- Ejiri (2000) H. Ejiri, Phys. Rept. 338, 265 (2000).
- Hashim et al. (2018) I. H. Hashim, H. Ejiri, T. Shima, K. Takahisa, A. Sato, et al., Phys. Rev. C97, 014617 (2018), arXiv:1707.08363 [nucl-ex] .