Keck/Palomar Cosmic Web Imagers (KCWI/PCWI) Reveal an Enormous Ly Nebula in an Extremely Overdense QSO Pair Field at
Abstract
Enormous Ly nebulae (ELANe) represent the extrema of Ly nebulosities. They have detected extents of kpc in Ly and Ly luminosities erg s-1. The ELAN population is an ideal laboratory to study the interactions between galaxies and the intergalactic/circumgalactic medium (IGM/CGM) given their brightness and sizes. The current sample size of ELANe is still very small, and the few ELANe discovered to date are all associated with local overdensities of active galactic nuclei (AGNs). Inspired by these results, we have initiated a survey of ELANe associated with QSO pairs using the Palomar and Keck Cosmic Web Imagers (PCWI/KCWI). In this letter, we present our first result: the discovery of ELAN0101+0201 associated with a QSO pair at . Our PCWI discovery data shows that, above a 2- surface brightness of erg s-1 cm-2 arcsec-2, the end-to-end size of ELAN0101+0201 is kpc. We have conducted follow-up observations using KCWI, resolving multiple Ly emitting sources within the rectangular field-of-view of projected kpc2, and obtaining their emission line profiles at high signal-to-noise ratios. Combining both KCWI and PCWI, our observations confirm that ELAN0101+0201 resides in an extremely overdense environment. Our observations further support that a large amount of cool ( K) gas could exist in massive halos (M M⊙) at . Future observations on a larger sample of similar systems will provide statistics of how cool gas is distributed in massive overdensities at high-redshift and strongly constrain the evolution of the intracluster medium (ICM).
Subject headings:
Intergalactic medium, quasars: emission lines, galaxy: halos1. Introduction
Recent observations have lead to the discovery of the first sample of enormous Ly nebulae (ELANe) at (Cantalupo et al., 2014; Hennawi et al., 2015; Cai et al., 2017; Arrigoni Battaia et al., 2018). These ELANe have a Ly size exceeding the diameters of their massive dark matter halos and their Ly luminosities are greater than erg s-1. Their morphology and kinematics are ideal properties to constrain models of galaxy formation and galaxy-IGM interactions (Martin et al., 2015; Arrigoni Battaia et al., 2018).
Although Ly nebulae with sizes of 100 kpc are commonly found around luminous QSOs at (Borisova et al., 2016), two out of 17 nebulae in this sample have sizes kpc which meet the ELANe definition. Further, at , QSO-Ly nebulae appear to be rarer. Arrigoni Battaia et al. (2016) conducted deep narrowband images on 15 QSOs and did not detect bright nebulae with SB 10-17 erg s-1 cm-2 arcsec-2 at distances kpc around any of these QSOs. These observations suggest that typical QSOs may be surrounded by gas 100 times less dense than that responsible for ELANe (Hennawi & Prochaska, 2013; Cantalupo, 2017).
All ELANe found to date reside in local AGN overdensities: the Slug and MAMMOTH-1 nebulae (Cantalupo et al., 2014; Cai et al., 2017) contain two AGNs. The Jackpot nebula (Hennawi et al., 2015) is associated with an AGN quartet. There are two possible reasons for these detections. A stronger UV radiation field may boost the extended Ly emission into the detectable regime (Cantalupo et al., 2005; Kollmeier et al., 2010), and a higher CGM density may also yield brighter Ly fluorescence (e.g., Cantalupo et al., 2012). Thus, AGN pairs or groups may be ideal sites to search for ELANe, because they provide both the strong meta-galactic ionizing fluxes and gas overdensities required for detections. This has motivated our survey using QSO pairs. In addition, recent studies have suggested that SDSS QSO pairs trace protoclusters (Onoue et al. 2018), and thus the extended Ly, C iv, He ii lines traced by QSO pairs can be used to probe cool ( K) and warm ( K) gas in the early ICM (Valentino et al., 2016).
Guided by the above observational and theoretical insights, we have conducted a survey using the Palomar and Keck Cosmic Web Imagers (PCWI/KCWI) to search for ELANe associated with QSO pairs at . Our goals are to significantly enlarge the number of confirmed ELANe at , and then systematically understand the gas budget and kinematics throughout the dark matter halos of these objects. Our results will be compared to nebulae powered by isolated QSOs at and further used to constrain the ICM evolution.
In this letter, we present our first discovery in the survey: ELAN0101+0201, associated with the QSO pair at using both PCWI and KCWI observations. The projected separation of these two QSOs is (82.5 physical projected kpc) and the redshift separation is about 1000 km s-1. The brighter QSO (Q1) has an AB magnitude of and the fainter QSO (Q2) has (30 times fainter than Q1). The statistical results on the full sample of 12 sources will be presented in upcoming papers. In §2, we introduce our observations and data reductions. In §3, we provide the discovery of the ELAN and the gas kinematics. In §4, we provide a discussion of the results. We assume a CDM cosmology with , and .
2. Observations
2.1. Sample Selection
We searched for QSO pairs from the SDSS-IV QSO database which contains 200,000 QSO spectra at (Pâris et al., 2017). Our sample contains 12 QSO pairs, where each consists of two QSOs with 2D separation smaller than , and velocity offset km s-1. Further, we require at least one of them to have . The observations are conducted in two stages. Stage 1 is a shallow PCWI program to search for extended emission; stage 2 is a deeper targeted search with KCWI to conduct high resolution, high signal-to-noise observations to study the gas kinematics and emission lines in greater detail. ELAN0101+0201, at , is our first target from this sample with both PCWI and follow-up KCWI data.
2.2. PCWI and KCWI Observations, Data Reduction
The PCWI observations of ELAN0101+0201 were carried out on UT-20161130 and UT-20171215. The total exposure time is 4-hours on-source and 4-hours on the blank sky. Individual exposures were acquired using the standard CWI nod-and-shuffle technique (Martin et al., 2014). PCWI uses a 40 reflective image slicer with 24 slices. We put the brighter QSO (Q1) at the IFU center. We used the Richardson grating () and an Asahi/blue filter. We use the standard CWI pipeline to reduce the data (Martin et al., 2014).
The KCWI observations of ELAN0101+0201 were carried out on UT-20171021 and UT-20171119. The BM1 grating and medium slicer were chosen. This setting yields a field-of-view (FoV) of 16.8, and a spatial resolution of along the slicer and seeing-limited sampling () perpendicular to the slicer. The spectral resolution is . The datacube has wavelength coverage of Å, centered on the QSO Ly redshift ( Å). The total on-source exposure time is 120 minutes, in four 10 minute and four 20 minute individual exposures. To maximizing the observing efficiency, we used the “offset-target-field” to construct the sky datacube, rather than nod-and-shuffle. The offset-target has a different redshift and is within two degrees of ELAN0101+0201. We obtained the sky of each wavelength channel using the median value after masking the point-source of the offset-target. The KCWI pipeline***KCWI pipeline: https://github.com/kcwidev/kderp/blob/master was used to reduce the data. For each image, we subtracted the bias, corrected the pixel-to-pixel variation, removed cosmic-rays, corrected the geometric transformation, and perform the wavelength calibration. For each channel, we subtract the sky determined by the offset-target field. Flux calibration was performed using the standard star BD+28D4211 at the beginning of the night. The final datacube is combined from the inverse variance weight of individual exposures. In addition, we use CubeExtractor package to further perform the high order flat-field corrections and to remove the point spread function (PSF) of the bright QSO (Q1) (Cantalupo in prep; see also Borisova et al. (2016) for a description of main routines).
3. Results
3.1. The Discovery of an Enormous Ly Nebula
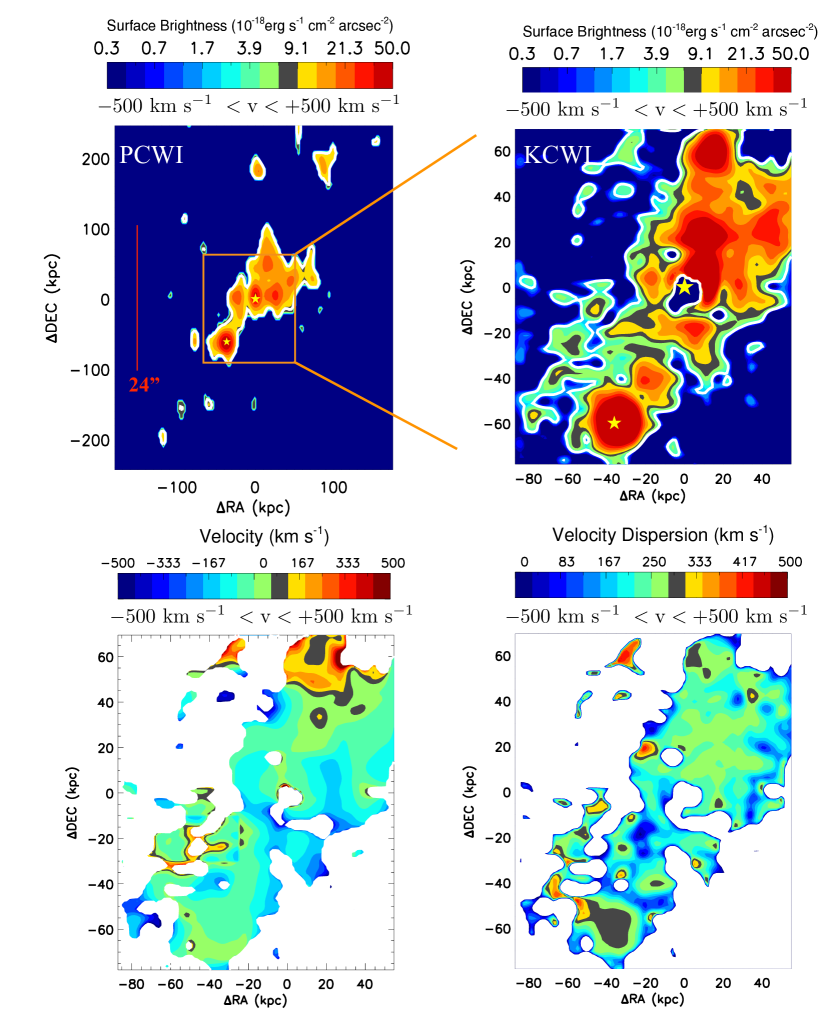
In the upper left panel of Figure 1, we present the PCWI PSF-subtracted Ly narrowband image. The 4-hour on-source integration with nod-and-shuffle mode yields a 1- of erg s-1 cm-2 arcsec-2 over a velocity range of 500 km s-1 around the systematic redshift of Q1 (). To a 2- contour, the ELAN has an extended size of 27.9, corresponding to a physical size of 232.2 kpc. The total Ly luminosity of ELAN0101+0201 is erg s-1.
In the upper right panel of Figure 1, we present the KCWI observations. The size of the ELAN exceeds the KCWI FoV (the orange box). The 2-hour integration yields a flux density of 1- erg s-1 cm-2 Å-1, corresponding to a 1- of erg s-1 cm-2 arcsec-2 over a velocity range of km s-1 around the systematic redshift of Q1, a factor of deeper than PCWI observations. KCWI has a much higher spatial resolution for resolving the sub-structures in the Ly nebula. Both PCWI and KCWI detect extended Ly emission and a projected filament that appears to connect both QSOs (yellow asterisks in Fig. 1).
3.2. The kinematics of the Ly Nebula
From the KCWI observations, we derive a flux-weighted velocity map (Figure 1, lower left). The zero-point of the velocity is set at the systematic redshift of Q1 (), determined from the MgII emission in the SDSS spectrum. From the velocity map, there are no clear velocity structures (e.g., rotation or bi-polar outflow signatures). The majority of the nebula has a velocity offset within km s-1 from the zero-point. A high velocity component with km s-1 is seen in the North-West, and this component corresponds to a LAE discussed below. The velocity dispersion map (Figure 1, bottom right) is obtained using the second moment of the flux distribution. The majority of the nebula has a velocity dispersion km s-1, indicating a Ly line width of km s-1 throughout most of the nebular region covered by KCWI.
3.3. Overdensity of Ly Emitters
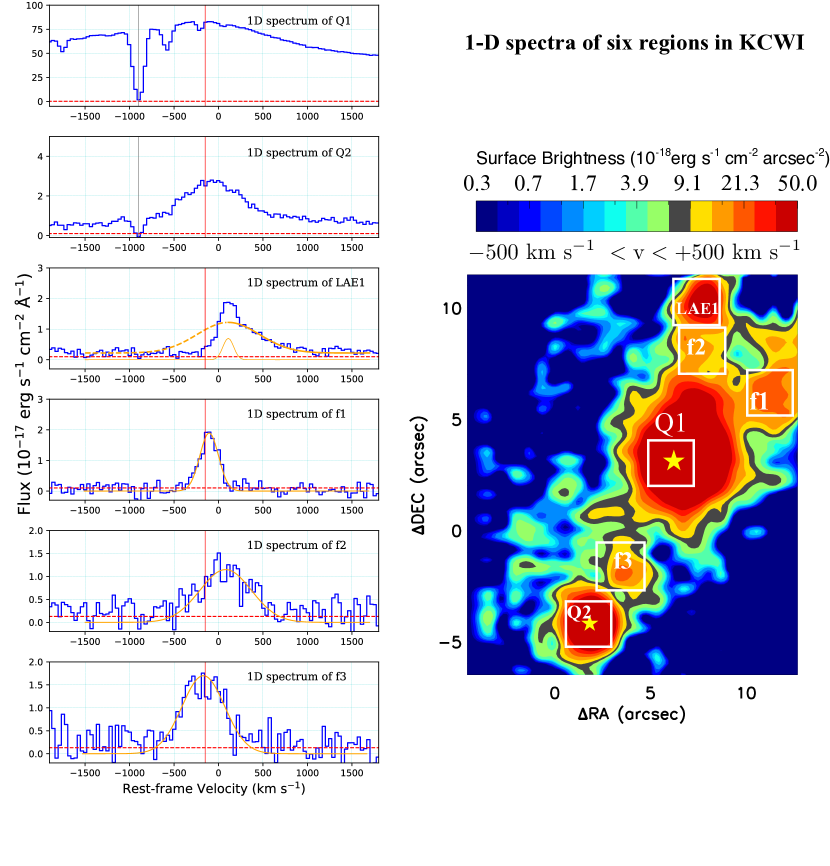
In Figure 2, we show six 1-D spectra from the KCWI datacube, including Q1 (), Q2 (), and a KCWI resolved bright LAE (LAE1). The positions labeled f1, f2 and f3 are bright nodes in the nebular region resolved by KCWI.
LAE1 has a higher velocity than the nebular redshift (Fig. 1). Figure 2 shows that LAE1 has a highly asymmetric Ly profile. The Ly emission can be fit using one broad (thick orange line) component with the FWHM of 840 km s-1 and one narrow component (thin orange line) with the FWHM of 170 km s-1. The left wing of the broad component is strongly absorbed. The possible causes of this absorption are discussed in §4.3.
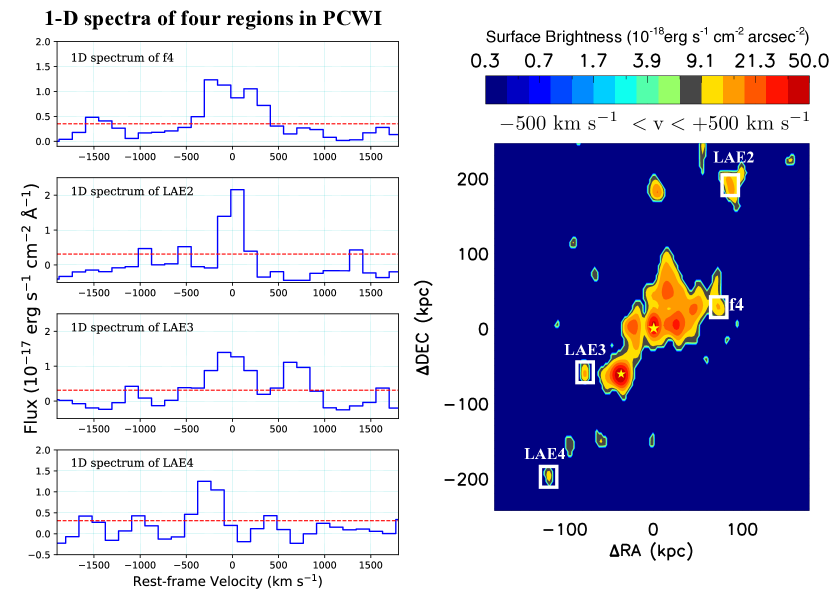
In Figure 3, we show four 1-D spectra from the PCWI datacube using a aperture. All sources have detection of the emission lines. These sources reside outside the KCWI FoV. Assuming all these emission lines are Ly, their Ly luminosities are erg s-1 ( erg s-1, Ciardullo et al. 2012). Including LAE1, we detect four LAE candidates and two QSOs in an area, within a redshift range of – 2.46 (Table 1).
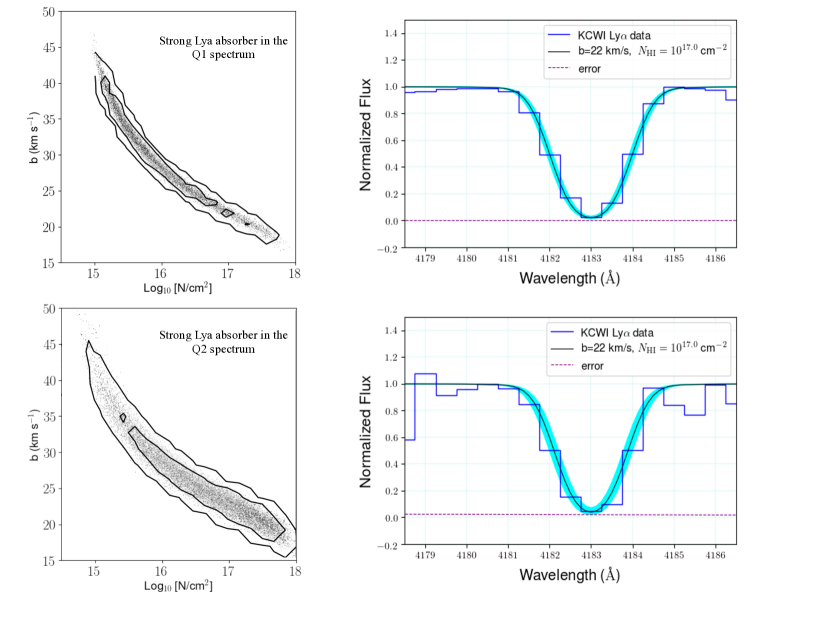
3.4. The Pair of Ly Absorbers
In the spectra of Q1 and Q2, we detect strong Ly absorbers at -710 km s-1 reference to QSO Ly emission () (gray vertical lines in Figure 2). Using a Markov-Chain Monte Carlo (MCMC) analysis (Figure 4), we found that the column density of both absorbers have cm-2 in (Fig. 4). These absorbers are not associated with any Ly-emitting galaxies in the KCWI observed field within a velocity offset of km s-1 around the absorption redshift. Within the KCWI FoV, we put a 5- upper limit of for the counterpart galaxy within projected kpc around Q1. This corresponds to a Ly-based SFR of M⊙ yr-1 (Kennicutt & Evans, 2012). Within the PCWI FoV, we put a 5- upper limit of within projected kpc, corresponding to a Ly-based SFR of M⊙ yr-1.
4. Discussion
We have identified ELAN0101+0201 with an end-to-end size of kpc. Such a large and luminous nebula is rarely found, especially around QSOs. The filament is elongated along the projected line connecting the two QSOs. With KCWI observations, we further resolved a LAE (LAE1 in Fig.2) which has a highly asymmetric Ly emission.
4.1. The Enormous Nebula at and its Powering Mechanism
Borisova et al. (2016) show that QSOs are generally associated with nebulae having projected sizes larger than 100 physical kpc. However, at , few isolated ultraluminous QSOs appear to power nebulae (Arrigoni Battaia et al., 2016). ELAN0101+0201 is associated with a QSO pair. To understand the physical properties, we investigate the powering mechanism of this nebula. A few processes can power the extended Ly emission: photoionization, shock-heated gas by an AGN outflow, and resonant scattering from the QSO broad-line-region (Cantalupo 2017 for a review).
The kinematics analysis disfavors that a strong outflow plays a major role in powering this nebula. The velocity map of ELAN0101+0201 (Fig.1) does not show obvious bipolar outflow signatures (Cai et al. 2017b). Alexander et al. (2010) and Harrison et al. (2014) also suggest that AGN outflows have a high-velocity of 1500 km s-1 which is not the case for ELAN0101+0201. The velocity pattern is similar to nebulae found by Borisova et al. (2016) at . The velocity dispersion measurement (§3.2 and Figure 1) is consistent with a nebula illuminated by a radio-quiet system (FWHM km s-1) (Villar-Martín et al., 2007; Borisova et al., 2016).
We now consider the photoionization scenario. Since Q2 is expected to be fainter than Q1 and most nebular emission is around Q1, we assume that the nebula is photoionized by Q1. We consider both optically thin and thick CGM photoionized by Q1.
Following Hennawi & Prochaska (2013), the surface brightness of an optically thin cloud due to recombination can be expressed as follows:
| (1) |
Arrigoni Battaia et al. (2015a,b) and Hennawi et al. (2015) presented that the smooth Ly morphology suggest the covering factor . Here we assume the . Using a statistical sample, Lau et al. (2016) find that cm-2 within 200 kpc in the QSO halo. We thus assume cm-2 in Eq.(1). Given the average SB erg s-1 cm-2 arcsec-2 at kpc from Q1, the hydrogen number density is cm-3. This value is typical for the interstellar medium, but not typical for CGM where simulations predict cm-3 (e.g., Shen et al., 2013). The ELAN0101+0201 has a CGM density 2–3 orders of magnitude higher than the statistical QSO sample at (Arrigoni Battaia et al. 2016), suggesting that this QSO pair may contain an unusually high-density CGM compared to typical isolated QSOs at .
If we consider the optically thick scenario, Hennawi & Prochaska (2013) suggest that the SB can be estimated as follows:
| (2) |
The -band magnitude of the bright QSO is 18.1, and the inferred Log , obtained from scaling the composite QSO spectrum to match the -band magnitude of Q1 (Arrigoni Battaia et al., 2015; Lusso et al., 2015). Assuming , the predicted SB erg s-1 cm-2 at kpc from Q1, two orders of magnitude higher than the observed SB. Thus, the UV-illuminated optically thick gas may have a small covering factor, or the illumination due to optically thick gas is not the dominant powering mechanism.
4.2. The Association of Cool Gas and Overdense Environements at
Using Hyper-Suprime-Cam survey and SDSS DR12 QSO database, Onoue et al. (2018) found that QSO pairs trace - overdense regions over 15 co-Mpc. These overdense regions could be protoclusters with M⊙. ELAN0101+0201 is associated with one of the smallest-separation QSO pairs at . In the KCWI FoV ( physical kpc), we revealed another bright LAE with a broad Ly emission. If this LAE is another AGN, then the AGN clustering in this field is even stronger than the AGN quartet system reported in Hennawi et al. (2015), implying a physical connection between this ELAN and a massive overdensity.
From Figure 3, over a larger FoV of , we detect another three bright LAE candidates from the PCWI data with (Table 1). In random fields, one expects LAEs within this luminosity range and survey volume at (e.g., Ciardullo et al., 2012) This further suggests that ELAN0201+0101 resides in the progenitor of a massive cluster.
From §4.1, to interpret the discovery of ELAN, we assume the optically-thin, cool gas ( K) that has an average column density of cm-2 across the ELAN. The cool gas mass can be calculated using the , where is the area of the nebula, and is the atomic hydrogen mass. One can calculate that this ELAN could contain a reservoir of cool gas with the mass of M⊙ (also see Hennawi et al. 2015). The association between cool gas reservoirs and massive overdensities is unexpected. Cosmological simulations suggest that by –3, baryons in the cluster progenitors ( M⊙) are dominated by a hot, shock-heated gas with K (Fumagalli et al., 2014; Faucher-Giguère et al., 2015). ELAN0101+0201 provides further challenges to these simulations. Recently, McCourt et al. (2018) and Ji et al. (2018) suggest that such inconsistencies may be solved if the cold gas takes the form of tiny fragments, sparsely distributed analogous to a mist.
4.3. The Profile of the Ly Emission
With KCWI, we reveal high S/N Ly emission and absorption throughout this system. From Figure 2, LAE1 has a highly asymmetric Ly profile, and contains a broad component (FWHM=840 km s-1). The broad component is much wider than typical star-forming galaxies (–400 km s-1, e.g., Trainor et al. 2016), indicating that LAE1 could be an AGN, making this field likely hosting three AGNs in a kpc scale. The left wing of the broad component is strongly suppressed by the absorption.
Ly is a resonant line and its profile may depend on the kinematics of the local interstellar medium (ISM). An ISM outflow could cause the asymmetric Ly emission (Dijkstra et al., 2006; Yang et al., 2014). An alternative source of asymmetry is enhanced IGM absorption along the sightline that could suppress the blue peak, making the Ly line asymmetric. From §4.2, ELAN0101+0201 resides in a massive overdensity. Such overdensities may be associated with a significant IGM H i overdensity (Cai et al., 2016). This H i reservoir is likely to absorb the blue wing of the LAE1 and make the Ly emission to be highly asymmetric.
In the future, we will present our complete sample of 12 QSO pairs, using PCWI and KCWI observations. Through deep IFS observations on this unique sample, we will conduct a statistical study of the Ly spatial extent and gas kinematics, revealing how CGM gas fuel massive halos. With this survey, we will build a unique statistical sample to study the multi-phase gas content in overdensities at and provide important constraints to the formation and evolution of the hot, shock-heated intracluster medium (ICM) observed in local Universe.
Acknowledgement: ZC acknowledges the supports provided by NASA through the Hubble Fellowship grant HST-HF2-51370 awarded by the Space Telescope Science Institute, which is operated by the Association of Universities for Research in Astronomy, Inc., for NASA, under contract NAS 5-26555. EH acknowledges the National Science Foundation under Grant No. AST-1402206. SC gratefully acknowledges support from Swiss National Science Foundation grant PP00P2_163824.
| Name | RA | DEC | IFS | ||
| (1042 erg s-1) | |||||
| Q1 (brighter QSO) | 01:01:16.54 | +02:01:57.4 | 2.4510 (Mg II) | KCWI | |
| Q2 (fainter QSO) | 01:01:16.85 | +02:01:49.8 | 2.459 (Ly) | KCWI | |
| LAE1 (could be an AGN) | 01:01:16.44 | +02:02:04.5 | 2.462 (Ly) | KCWI | |
| LAE2 | 01:01:16.30 | +02:02:25.2 | 2.449 (Ly) | PCWI | |
| LAE3 | 01:01:16.45 | +02:01:50.0 | 2.453 (Ly) | PCWI | |
| LAE4 | 01:01:17.34 | +02:01:38.5 | 2.446 (Ly) | PCWI |
References
- Alexander et al. (2010) Alexander, D. M., Swinbank, A. M., Smail, I., McDermid, R., & Nesvadba, N. P. H. 2010, MNRAS, 402, 2211
- Arrigoni Battaia et al. (2015) Arrigoni Battaia, F., Yang, Y., Hennawi, J. F., et al. 2015, ApJ, 804, 26
- Arrigoni Battaia et al. (2015) Arrigoni Battaia, F., Hennawi, J. F., Prochaska, J. X., & Cantalupo, S. 2015, ApJ, 809, 163
- Arrigoni Battaia et al. (2016) Arrigoni Battaia, F., Hennawi, J. F., Cantalupo, S., & Prochaska, J. X. 2016, ApJ, 829, 3
- Arrigoni Battaia et al. (2018) Arrigoni Battaia, F., Prochaska, J. X., Hennawi, J. F., et al. 2018, MNRAS, 473, 3907
- Borisova et al. (2016) Borisova, E., Cantalupo, S., Lilly, S. J., et al. 2016, ApJ, 831, 39
- Cai et al. (2016) Cai, Z., Fan, X., Peirani, S., et al. 2016, ApJ, 833, 135
- Cai et al. (2017) Cai, Z., Fan, X., Yang, Y., et al. 2017, ApJ, 837, 71
- Cantalupo et al. (2005) Cantalupo, S., Porciani, C., Lilly, S. J., & Miniati, F. 2005, ApJ, 628, 61
- Cantalupo et al. (2012) Cantalupo, S., Lilly, S. J., & Haehnelt, M. G. 2012, MNRAS, 425, 1992
- Cantalupo et al. (2014) Cantalupo, S., Arrigoni-Battaia, F., Prochaska, J. X., Hennawi, J. F., & Madau, P. 2014, Nature, 506, 63
- Cantalupo (2017) Cantalupo, S. 2017, Gas Accretion onto Galaxies, 430, 195
- Ciardullo et al. (2012) Ciardullo, R., Gronwall, C., Wolf, C., et al. 2012, ApJ, 744, 110
- Dijkstra et al. (2006) Dijkstra, M., Haiman, Z., & Spaans, M. 2006, ApJ, 649, 37
- Faucher-Giguère et al. (2015) Faucher-Giguère, C.-A., Hopkins, P. F., Kereš, D., et al. 2015, MNRAS, 449, 987
- Fumagalli et al. (2014) Fumagalli, M., Hennawi, J. F., Prochaska, J. X., et al. 2014, ApJ, 780, 74
- Kennicutt & Evans (2012) Kennicutt, R. C., & Evans, N. J. 2012, ARA&A, 50, 531
- Kollmeier et al. (2010) Kollmeier, J. A., Zheng, Z., Davé, R., et al. 2010, ApJ, 708, 1048
- Lau et al. (2016) Lau, M. W., Prochaska, J. X., & Hennawi, J. F. 2016, ApJS, 226, 25
- Lusso et al. (2015) Lusso, E., Worseck, G., Hennawi, J. F., et al. 2015, MNRAS, 449, 4204
- Harrison et al. (2014) Harrison, C. M., Alexander, D. M., Mullaney, J. R., & Swinbank, A. M. 2014, MNRAS, 441, 3306
- Hennawi & Prochaska (2013) Hennawi, J. F., & Prochaska, J. X. 2013, ApJ, 766, 58
- Hennawi et al. (2015) Hennawi, J. F., Prochaska, J. X., Cantalupo, S., & Arrigoni-Battaia, F. 2015, Science, 348, 779
- Ji et al. (2018) Ji, S., Peng Oh, S., & McCourt, M. 2018, MNRAS,
- Martin et al. (2014) Martin, D. C., Chang, D., Matuszewski, M., et al. 2014, ApJ, 786, 106
- Martin et al. (2015) Martin, D. C., Matuszewski, M., Morrissey, P., et al. 2015, Nature, 524, 192
- McCourt et al. (2018) McCourt, M., Oh, S. P., O’Leary, R., & Madigan, A.-M. 2018, MNRAS, 473, 5407
- Onoue et al. (2018) Onoue, M., Kashikawa, N., Uchiyama, H., et al. 2018, PASJ, 70, S31
- Pâris et al. (2017) Pâris, I., Petitjean, P., Aubourg, E., et al. 2017, arXiv:1712.05029
- Prescott et al. (2009) Prescott, M. K. M., Dey, A., & Jannuzi, B. T. 2009, ApJ, 702, 554
- Shen et al. (2013) Shen, S., Madau, P., Guedes, J., et al. 2013, ApJ, 765, 89
- Stewart et al. (2011) Stewart, K. R., Kaufmann, T., Bullock, J. S., et al. 2011, ApJ, 735, L1
- Trainor et al. (2016) Trainor, R. F., Strom, A. L., Steidel, C. C., & Rudie, G. C. 2016, ApJ, 832, 171
- Valentino et al. (2016) Valentino, F., Daddi, E., Finoguenov, A., et al. 2016, ApJ, 829, 53
- Villar-Martín et al. (2007) Villar-Martín, M., Sánchez, S. F., Humphrey, A., et al. 2007, MNRAS, 378, 416
- White et al. (2012) White, M., Myers, A. D., Ross, N. P., et al. 2012, MNRAS, 424, 933
- Yang et al. (2014) Yang, Y., Zabludoff, A., Jahnke, K., & Davé, R. 2014, ApJ, 793, 114