Pair fraction in a finite temperature Fermi gas on the BEC side of the BCS-BEC crossover
Abstract
We investigate pairing in a strongly interacting two-component Fermi gas with positive scattering length. In this regime, pairing occurs at temperatures above the superfluid critical temperature; unbound fermions and pairs coexist in thermal equilibrium. Measuring the total number of these fermion pairs in the gas we systematically investigate the phases in the sectors of pseudogap and preformed-pair. Our measurements quantitatively test predictions from two theoretical models. Interestingly, we find that already a model based on classical atom-molecule equilibrium describes our data quite well.
pacs:
03.75.Ss, 67.10.Db, 67.85.LmI Introduction
A unique feature of fermionic superfluids is the pairing. For a weakly interacting Bardeen-Cooper-Schrieffer (BCS) superfluid pairing occurs directly at the critical temperature for superfluidity Bardeen et al. (1957a). This pairing is accompanied with the emergence of an excitation gap which is identified with the superfluid order parameter and is proportional to the density of condensed pairs Bardeen et al. (1957b). For fermions with strong coupling, an excitation gap already emerges at a temperature above . This is referred to as the pseudogap regime Chen et al. (2005). The existence of the pseudogap has been observed early on, e.g. in underdoped high- superconductors Ding et al. (1996); Loeser et al. (1996). While its nature has been intensely studied, it is still not fully understood. Understanding the pseudogap is expected to be the key for revealing the mechanism behind high- superconductivity Stajic (2017); Mueller (2017). One interpretation of the pseudogap is based on the presence of non-condensed pairs with non-vanishing momentum Chen and Levin (2005).
Ultracold Fermi gases are an excellent system for investigating the gap and pseudogap physics from the BCS to Bose-Einstein condensate (BEC) regimes Stajic et al. (2004). Using radio-frequency (RF) spectroscopy in various forms, e.g. Chin et al. (2004); Schirotzek et al. (2008); Gaebler et al. (2010); Sagi et al. (2015), the excitation gap has been studied in the way similar to angle-resolved photoemission spectroscopy (ARPES) of solid state systems Hashimoto et al. (2014). Evidence for pairing above was found in the RF experiments, as well as in other physical quantities, such as viscosity Elliott et al. (2014), heat capacity Kinast et al. (2005), and Tan’s contact Palestini et al. (2010); Kuhnle et al. (2011).
In this article, we investigate pairing of fermions for various temperatures and interaction strengths on the BEC side of the BEC-BCS crossover. For this, we measure the total number of bound fermion pairs in our sample for . Such counting of fermion pairs is in general not possible for solid state systems and therefore complements existing methods. We determine the fermion pair number by converting all atom pairs to tightly-bound diatomic molecules, either by photoexcitation Partridge et al. (2005) or by a fast magnetic-field ramp Regal et al. (2004); Zwierlein et al. (2004) and measuring the decrease in atom number of the cloud. When we compare the measured and calculated pair numbers we find quite good agreement with two models: an ab initio -matrix approach and a classical statistical model of atom-molecule equilibrium Chin and Grimm (2004). We provide an explanation why the classical model achieves good results, despite the fact that strong interactions and quantum statistics play an important role in our system.
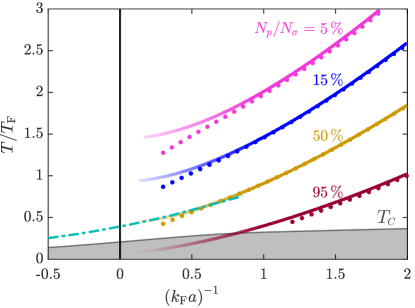
In the following, we consider an ultracold, spin-balanced, strongly-interacting two-component Fermi gas in a harmonic trap. Collisions lead to pairing of atoms with opposite spins, , . For a given temperature and interaction strength well defined fractions of pairs and atoms are established at thermal equilibrium, as long as collisional losses are negligible. Figure 1 shows the phase diagram of such a system in the vicinity of a Feshbach resonance at . Here, is the s-wave scattering length, denotes the norm of the Fermi wave vector, is the atomic mass, and is the Fermi energy in the trap center with the Boltzmann constant. The dash-dotted and solid lines are contours of constant molecular fractions for two different approaches. Here, is the number of all atoms per spin state regardless whether they are bound in pairs () or free (). The dotted lines are calculations based on a self-consistent -matrix approach Pini et al. (2019), while the solid lines correspond to a statistical mechanics approach treating the particles as a canonical ensemble of non-interacting molecules and atoms in chemical equilibrium (see Chin and Grimm (2004) and Appendix A). Here, the molecules have a binding energy of . Also shown is a calculation (cyan dash-dotted line) by Perali et al. Perali et al. (2004) of the BCS mean-field critical temperature which provides an approximate estimate of the pair breaking temperature. It partially coincides with the pair fraction line of the statistical mechanics approach.
We carry out our experiments with a spin-balanced two-component Fermi gas of atoms which is initially prepared at a magnetic field of . The atoms have magnetic quantum numbers () and () and correlate to the hyperfine level of the ground state at . They are confined in a harmonic 3D cigar-shaped trapping potential which is generated in radial direction mainly by a focused dipole trap laser beam and along the axial direction mainly by a magnetic field gradient. The temperature is set via evaporative cooling and is measured by fitting a distribution obtained from the second order quantum virial expansion to the outer wings of the density profile Liu (2013). The particle number per spin state ranges from for the lowest temperature of about to for the highest temperature of about . The population balance of the two spin states is assured by means of a long resonant RF pulse that mixes the two Zeeman states and . For a spin-balanced system the Fermi energy is given by , where and denote the radial and axial trapping frequency, respectively. In our experiment ranges from about to while is almost constant as it is dominated by the magnetic confinement. The interaction parameter can be tuned by changing either the scattering length via the broad magnetic Feshbach resonance located at Zürn et al. (2013); Bartenstein et al. (2005), or by adjusting the Fermi energy .
II Measuring the pair fraction
In order to determine the pair fraction we measure the particle numbers and separately. is obtained by means of spin-selective absorption imaging of the component using a -polarized laser beam resonant with the transition of Ketterle and Zwierlein (2008). This transition is essentially closed due to a decoupling of the nuclear spin and the total electronic angular momentum in the Paschen-Back regime of the hyperfine structure Jochim (2004). All atoms will be counted regardless whether they are free or bound in the weakly-bound pairs. Since the binding energy of these pairs is always less than in our experiments, the imaging laser is resonant with both free atoms and bound pairs. In order to determine the number of bound pairs , we transfer all pairs to states that are invisible in our detection scheme and measure again the remaining state atom number via absorption imaging. We use two different bound-state transfer methods which produce consistent results. They are briefly described in the following.
II.1 Optical transfer (OT) method
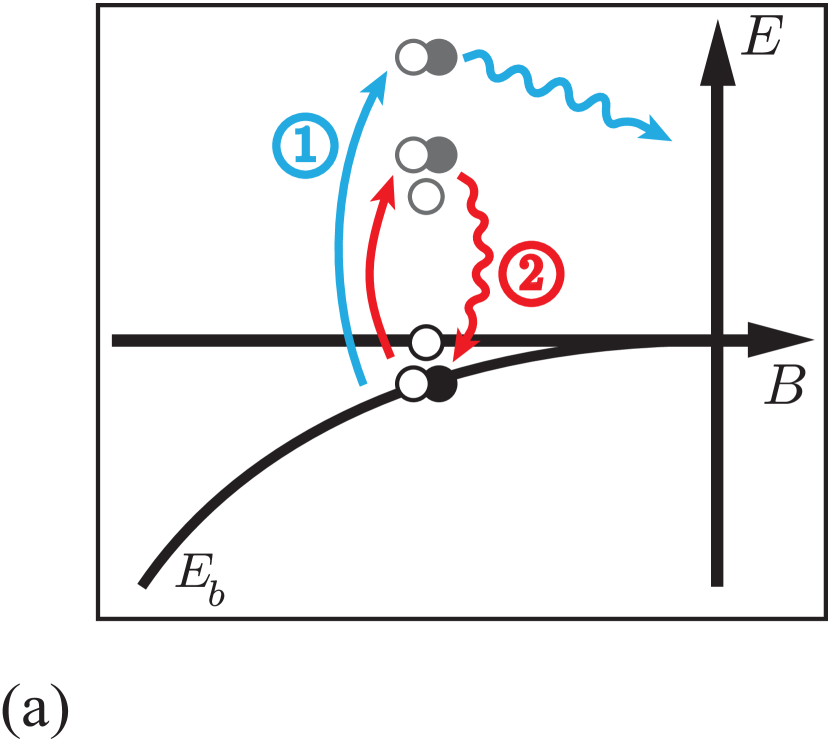
This transfer method is based on resonant excitation of fermion pairs to a more strongly bound molecular state () with a laser () which is detuned by from the atomic transition, see also Partridge et al. (2005). Subsequently, the excited molecules quickly decay to undetected atomic or molecular states, see Fig 2(a). This optical excitation of the fermion pairs occurs via an admixture of the molecular bound state to the fermion pair wave function Partridge et al. (2005).
If, for now, we ignore other loss processes, the number of fermion pairs decays exponentially as a function of the laser pulse length such that the measured total number of atoms as a function of time is given by
| (1) |
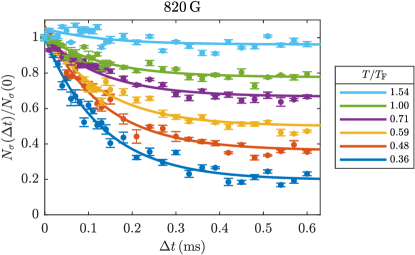
where is the time constant for the optical excitation. Figure 2(b) shows this decay for five different initial temperatures at a magnetic field of . By fitting Eq. (1) to the measured data (see fit curves) we are able to extract the pair number . Besides the photoexcitation of pairs a loss in could in principle also be induced by photoassociation of two free atoms. However, we made sure that within our field range its rate is negligible. The photoassociation rate constants range between for magnetic fields between and . We work with low particle densities of at most and a maximum laser intensity of about .
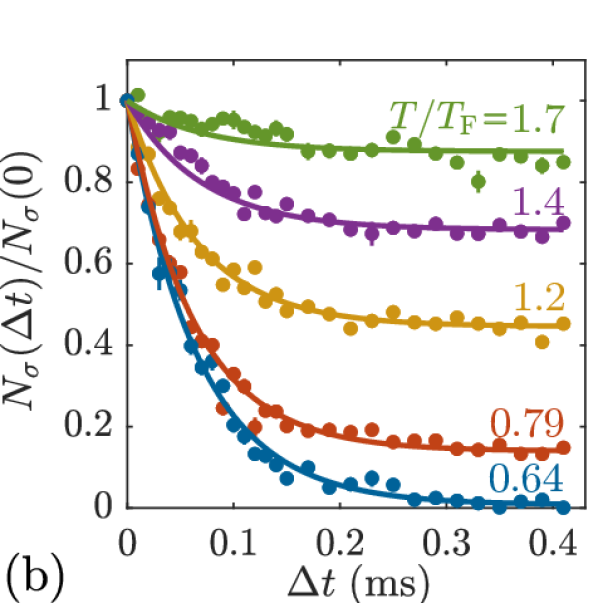
For the data shown in Fig. 2(b) the laser intensity is and the peak density for the lowest temperature of is which corresponds to an initial photoassociation time constant of about . This is much longer than the loss dynamics observed in Fig. 2(b). Indeed, the fact that the curves in Fig. 2(b) approach constant values for pulse times already suggests that the photoassociation of free atoms is negligible.
However, closer to resonance the time constants for photoassociation and pair excitation become more comparable. Therefore, we generally release the particles from the trap before applying the laser pulse. The subsequent expansion lowers the cloud density by about a factor of 4 and assures additionally that photoassociation is negligible. Furthermore, lowering the density also strongly suppresses regeneration of depleted Fermi pairs during the laser pulse, since pair regeneration mainly occurs via three-body recombination. We have checked that during the expansion the fermion pairs do not break up. For this, we carried out measurements at a magnetic field of , working at the lowest temperatures of about , where only about of the atoms are unbound and thus photoassociation does not play a significant role. We measured the same pair numbers with and without expansion.
In general the OT method works very well up to magnetic fields of about , close to the Feshbach resonance. There, we observe marked deviations from the exponential decay in Eq. (1), a behavior, that also had been reported earlier by the Rice group Partridge et al. (2005). An analysis of these signals would require a better understanding of the nature of strongly interacting pairs. For this reason, we decide to stay below magnetic fields of for the present investigations where the analysis is unequivocal.
II.2 Magnetic transfer (MT) method
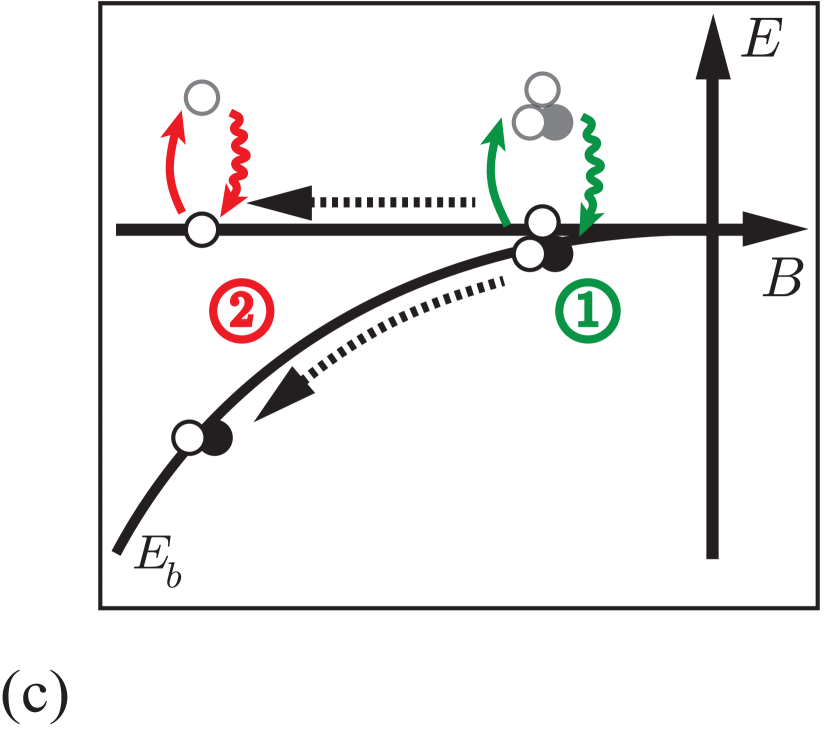
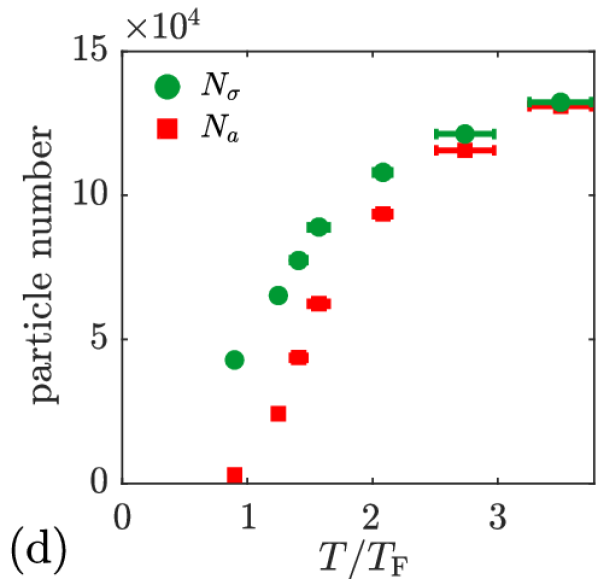
Here, we increase the binding energy of the pairs to by quickly ramping the magnetic field at down to , see Fig. 2(c). This works very efficiently without breaking up the molecules as previously shown in Regal et al. (2004); Zwierlein et al. (2004). At 550 G the fermion pairs cannot be resonantly excited anymore by the imaging laser and become invisible to our detection scheme, see Jochim et al. (2003). is determined as the difference of the numbers for atoms and pairs () measured before the ramp and unbound atoms () obtained after the ramp. Figure 2(d) shows these particle numbers for different temperatures at a magnetic field of .
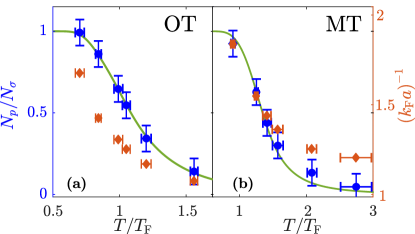
We did not perform measurements with the MT method for magnetic fields higher than because of technical limitations for the ramping speed. If the field ramp duration ( for the case of ) becomes comparable to the equilibration time for the atom-molecule mixture (a few milliseconds at ) the measurement does not yield the correct molecule number anymore. This restriction of the magnetic field ramp implies that we cannot use the MT method in the strong interaction crossover regime, but only in the far BEC regime. There, however, the MT method is quite useful to check for consistency with the OT method. This consistency is shown in Fig. 3 where we plot the pair fractions obtained at from both methods as a function of the temperature (blue circles). Since the temperature was adjusted by varying the evaporative cooling, different temperatures correspond to different particle numbers and thus to different interaction parameters (orange diamonds). The green lines are calculated pair fractions using the classical model. In general, we find good agreement between the experimental data and the theoretical prediction, which also indicates consistency between the OT and MT methods.
III Results
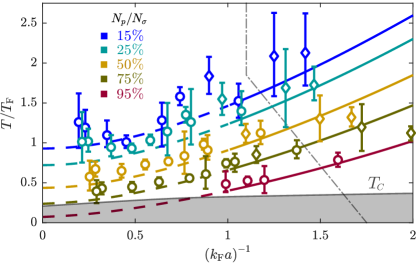
We now apply the OT and MT methods to map out the fraction of pairs on the BEC-side. For this, we perform measurements for a variety of magnetic fields and temperatures. The pair fractions obtained from both experimental methods are shown in Fig. 4 (circles: OT method, diamonds: MT method). The area on the right hand side of Fig. 4, as bounded by the thin dash-dotted line, marks a region where we observe non-negligible loss of particles () during our measurements due to inelastic collisions of bound pairs. This loss increases with , see e.g. Bourdel et al. (2004); Petrov et al. (2004). In order to simplify our discussion we only consider data points outside this area.
The solid/dashed lines in Fig. 4 represent the statistical mechanics model without any adjustable parameters. For higher temperatures we generally observe larger fluctuations and thus larger error bars, because of the larger atom cloud within a limited field-of-view. Overall, we find that the agreement between measurement and model remains quite good even in the crossover regime where this model of classical particles with no interaction energy should be expected to break down. In fact, the model could be expected to work to the extent that the internal degrees of freedoms of the fermion pairs are frozen and only the degrees of freedom associated with the center-of-mass of the pair remain active. This approximately occurs when the fermionic chemical potential changes sign which, using a -matrix approach, we estimate to occur at a coupling value of about at . This might explain the good agreement found between the model and the experimental data when as well as with the theoretical calculation based on a self-consistent -matrix approach.
IV Conclusion
To conclude, we have systematically mapped out the fermion pair fraction in a strongly interacting Fermi gas as a function of both temperature and coupling strength. Our measurements show how pairing of ultracold fermions changes as we move from the BEC regime into the strong interaction regime. We demonstrate a novel method to measure the pair fractions from the near-BEC limit to the pseudogap regime, which is based on a number measurement of fermion pairs. This method is complementary to existing excitation-gap measurements and has no counterpart in conventional condensed matter systems. We find that a statistical mechanics model treating the fermions and pairs as classical particles describes the measured data quite well in the investigated range, as we have also confirmed through an advanced many-body calculation based on a -matrix approach. In the future, we plan to extend our measurements and investigate more in detail the coupling region () where the preformed-pair and the pseudogap regimes overlap with each other.
Acknowledgements.
We gratefully acknowledge discussions with Q. Chen and K. Levin and support from the Deutsche Forschungsgemeinschaft within SFB/TRR 21 (project part B4), the Baden-Württemberg Foundation, and the Center for Integrated Quantum Science and Technology (). C. Chin acknowledges support from the Alexander v. Humboldt fellowship, the Chicago Materials Research Science and Engineering Center by the National Science Foundation (DMR-1420709), and the Army Research Office (W911NF-14-1-0003).Appendix A Model of a canonical ensemble of non-interacting atoms and molecules
In our simple statistical mechanics model we treat the cold gas of fermions and fermion pairs as a classical canonical ensemble of atoms and molecules, respectively, with negligible interaction energy among each other. In collisions a pair of and atoms can combine to form a molecule, and vice versa a molecule can break up into an unbound pair of , atoms. At a given temperature the atom and molecule numbers are in chemical equilibrium. Following Chin and Grimm (2004), the equilibrium condition is derived by minimizing the Helmholtz free energy , subject to the constraint of particle number conservation. Here
is the partition function of the system and and are the single-particle partition functions for atoms and molecules, respectively. is the geometric mean of the trapping frequencies in axial and in radial direction, respectively. Using Stirling’s formula to approximate the factorials a minimum in the free energy is found at a molecule (pair) number
for a given temperature and binding energy . Using the partition function , the Fermi energy , and the total pair fraction per spin state we obtain the following implicit expression for the pair fraction in thermal equilibrium:
Appendix B Measurements close to unitarity
As pointed out in the main text we only carry out measurements at magnetic fields of up to because for higher magnetic fields we observe deviations from an exponential decay during the optical excitation of the pairs towards deeply bound molecules. Such deviations are indeed expected close to resonance as a result of many body effects Werner et al. (2009). In addition, as the optical excitation cross section decreases towards the resonance its rate becomes increasingly comparable to the one of photoassociation. In order to clarify that an exponential fit towards a constant value is still a good description at , we show corresponding decay curves in Fig. 5. A slight non-exponential behavior of the measured decay will increase the uncertainty in the measured equilibrium pair fraction.
References
- Bardeen et al. (1957a) J. Bardeen, L. N. Cooper, and J. R. Schrieffer, Phys. Rev. 108, 1175 (1957a).
- Bardeen et al. (1957b) J. Bardeen, L. N. Cooper, and J. R. Schrieffer, Phys. Rev. 106, 162 (1957b).
- Chen et al. (2005) Q. Chen, J. Stajic, S. Tan, and K. Levin, Physics Reports 412, 1 (2005).
- Ding et al. (1996) H. Ding, T. Yokoya, J. C. Campuzano, T. Takahashi, M. Randeria, M. R. Norman, T. Mochiku, K. Kadowaki, and J. Giapintzakis, Nature 382, 51 (1996).
- Loeser et al. (1996) A. G. Loeser, Z.-X. Shen, D. S. Dessau, D. S. Marshall, C. H. Park, P. Fournier, and A. Kapitulnik, Science 273, 325 (1996).
- Stajic (2017) J. Stajic, Science 357, 561 (2017).
- Mueller (2017) E. J. Mueller, Reports on Progress in Physics 80, 104401 (2017).
- Chen and Levin (2005) Q. Chen and K. Levin, Phys. Rev. Lett. 95, 260406 (2005).
- Stajic et al. (2004) J. Stajic, J. N. Milstein, Q. Chen, M. L. Chiofalo, M. J. Holland, and K. Levin, Phys. Rev. A 69, 063610 (2004).
- Chin et al. (2004) C. Chin, M. Bartenstein, A. Altmeyer, S. Riedl, S. Jochim, J. Hecker Denschlag, and R. Grimm, Science 305, 1128 (2004).
- Schirotzek et al. (2008) A. Schirotzek, Y.-i. Shin, C. H. Schunck, and W. Ketterle, Phys. Rev. Lett. 101, 140403 (2008).
- Gaebler et al. (2010) J. P. Gaebler, J. T. Stewart, T. E. Drake, D. S. Jin, A. Perali, P. Pieri, and G. C. Strinati, Nat. Phys. 6, 569 (2010).
- Sagi et al. (2015) Y. Sagi, T. E. Drake, R. Paudel, R. Chapurin, and D. S. Jin, Phys. Rev. Lett. 114, 075301 (2015).
- Hashimoto et al. (2014) M. Hashimoto, I. M. Vishik, R.-H. He, T. P. Devereaux, and Z.-X. Shen, Nature Physics 10, 483 (2014).
- Elliott et al. (2014) E. Elliott, J. A. Joseph, and J. E. Thomas, Phys. Rev. Lett. 113, 020406 (2014).
- Kinast et al. (2005) J. Kinast, A. Turlapov, J. E. Thomas, Q. Chen, J. Stajic, and K. Levin, Science 307, 1296 (2005).
- Palestini et al. (2010) F. Palestini, A. Perali, P. Pieri, and G. C. Strinati, Phys. Rev. A 82, 021605 (2010).
- Kuhnle et al. (2011) E. D. Kuhnle, S. Hoinka, P. Dyke, H. Hu, P. Hannaford, and C. J. Vale, Phys. Rev. Lett. 106, 170402 (2011).
- Partridge et al. (2005) G. B. Partridge, K. E. Strecker, R. I. Kamar, M. W. Jack, and R. G. Hulet, Phys. Rev. Lett. 95, 020404 (2005).
- Regal et al. (2004) C. A. Regal, M. Greiner, and D. S. Jin, Phys. Rev. Lett. 92, 040403 (2004).
- Zwierlein et al. (2004) M. W. Zwierlein, C. A. Stan, C. H. Schunck, S. M. F. Raupach, A. J. Kerman, and W. Ketterle, Phys. Rev. Lett. 92, 120403 (2004).
- Chin and Grimm (2004) C. Chin and R. Grimm, Phys. Rev. A 69, 033612 (2004).
- Pini et al. (2019) M. Pini, P. Pieri, and G. C. Strinati, Phys. Rev. B 99, 094502 (2019).
- Perali et al. (2004) A. Perali, P. Pieri, L. Pisani, and G. C. Strinati, Phys. Rev. Lett. 92, 220404 (2004).
- (25) M. Pini et al., in preparation.
- Liu (2013) X.-J. Liu, Physics Reports 524, 37 (2013).
- Zürn et al. (2013) G. Zürn, T. Lompe, A. N. Wenz, S. Jochim, P. S. Julienne, and J. M. Hutson, Phys. Rev. Lett. 110, 135301 (2013).
- Bartenstein et al. (2005) M. Bartenstein, A. Altmeyer, S. Riedl, R. Geursen, S. Jochim, C. Chin, J. Hecker Denschlag, R. Grimm, A. Simoni, E. Tiesinga, C. J. Williams, and P. S. Julienne, Phys. Rev. Lett. 94, 103201 (2005).
- Ketterle and Zwierlein (2008) W. Ketterle and M. Zwierlein, in Ultra-cold Fermi Gases, International School of Physics “Enrico Fermi”, Vol. Course CLXIV, edited by M. Inguscio, W. Ketterle, and C. Salomon (IOS Press, 2008).
- Jochim (2004) S. Jochim, PhD Thesis , 117 (2004).
- Jochim et al. (2003) S. Jochim, M. Bartenstein, A. Altmeyer, G. Hendl, C. Chin, J. Hecker Denschlag, and R. Grimm, Phys. Rev. Lett. 91, 240402 (2003).
- Bourdel et al. (2004) T. Bourdel, L. Khaykovich, J. Cubizolles, J. Zhang, F. Chevy, M. Teichmann, L. Tarruell, S. J. J. M. F. Kokkelmans, and C. Salomon, Phys. Rev. Lett. 93, 050401 (2004).
- Petrov et al. (2004) D. S. Petrov, C. Salomon, and G. V. Shlyapnikov, Phys. Rev. Lett. 93, 090404 (2004).
- Werner et al. (2009) F. Werner, L. Tarruell, and Y. Castin, The European Physical Journal B 68, 401 (2009).