Collapse of ferromagnetism with Ti doping in Sm0.55Sr0.45MnO3: A combined experimental and theoretical study
Abstract
We have investigated the effect of Ti doping on the transport properties coupled with the magnetic ones in Sm0.55Sr0.45Mn1-ηTiηO3 (). The parent compound, Sm0.55Sr0.45MnO3, exhibits a first-order paramagnetic-insulator to ferromagnetic-metal transition just below = 128 K. With substitution of Ti at Mn sites (-site), decreases approximately linearly at the rate of 22 K while the width of thermal hysteresis in magnetization and resistivity increases almost in an exponential fashion. The most spectacular effect has been observed for the composition =0.03, where a magnetic field of only 1 T yields a huge magnetoresistance, at 63 K. With increasing magnetic field, the transition shifts towards higher temperature, and the first-order nature of the transition gets weakened and eventually becomes crossover above a critical field () which increases with Ti doping. For Ti doping above 0.03, the system remains insulting without any ferromagnetic ordering down to 2 K. The Monte-Carlo calculations based on a two-band double exchange model show that the decrease of with Ti doping is associated with the increase of the lattice distortions around the doped Ti ions.
I INTRODUCTION
Perovskite manganites of the form RE1-xAExMnO3 (RE:
rare-earth ions and AE: alkaline-earth ions) display rich varieties
of physical phenomena owing to complex interplay between spin,
charge, and orbital degrees of freedom.
rao ; dago1 ; salamon ; dago2 ; toku1 ; ons The competition between
these degrees of freedom is most prominently manifested in
narrow-band system with large disorder. Usually, two types of
disorders are considered in manganites. One is -site disorder,
namely the quenched disorder, that arises mainly due to the size
mismatch between RE and AE cations and the other is (Mn)-site
disorder, originates due to the partial substitution of Mn by other
transition metal ions with different spin and valence state. Though,
-site ions are not directly involve in charge conduction
mechanism, several studies have shown that the disorder at -site has
a strong influence on different kinds of long-range ordering of
manganese sublattice. Among these ordered phases, the
charge-ordered (CO) state is most sensitive to -site disorder
while the ferromagnetic (FM)-metallic phase is relatively weakly
affected
hwang95 ; tokura96 ; rod ; attfield ; tomioka03 ; aka ; goodenough ; tomi ; fisher ; tomioka06 ; prb08 ; demko ; prb09 ; prl09 ; sr17 .
On the other hand, the doping at -site induces local disorder
directly into the Mn-O-Mn network and as a result, it has much
stronger effect on magnetic, transport and other physical properties
of the system as compared to -site disorder. Only a few percent
of -site doping can bring about a drastic change in the
electronic and magnetic properties without a significant change in
the crystal structure. Several experiments have been performed on a
large number of combination of reference states and -site dopants
reviewb ; mori99 ; kimura ; martin01 ; machida02 ; kimti ; nam06 ; sakai07 ; nam08 ; lu09 ; ssmoru ; dhiman ; lusr .
On the basis of reference state, two classes of materials can be
distinguished: (i) FM-metal at 0.330.4 and (ii)
CO-insulator at around 0.5pradhan3 . In half-doped CO manganites,
often substitution of small amount of Cr/Ni/Ru at Mn site
dramatically suppresses the long-range CO state and drives the
system into FM metallic state. On the contrary, the -site doping
in FM manganites may result in a strong suppression of
ferromagnetism by localizing the charge carriers which lead to the
formation of inhomogeneous and insulating magnetic ground state.
The effect of Mn-site doping on magnetic and transport properties has already been studied extensively but mostly on wideband FM manganites.reviewb ; martin01 ; kimti ; nam06 ; nam08 ; ssmoru ; dhiman However, the role of Mn-site doping in narrowband FM system, in particular, close to the multicritical point has not been studied in details. In the present work, we focus on a narrowband manganite, Sm0.55Sr0.45MnO3 (SSMO), which locates near the multicritical point where the three phases namely, FM-metal, CO-insulator and antiferromagnetic-insulator compete strongly with each other, to explore the role of Mn-site disorder on the FM phase tomi ; fisher ; tomioka06 ; prb08 ; demko ; prb09 ; prl09 ; sr17 . The effect of -site doping on magnetic and transport properties of Sm0.55Sr0.45Mn1-ηTiηO3 with has been studied systematically. The results show that FM-metal to paramagnetic (PM)-insulator transition in SSMO is first-order with transition temperature, 128 K. With the substitution of non-magnetic Ti4+, both the FM transition temperature, , and metal-insulator transition temperature (MIT), , decrease, while the thermal hysteresis width () in electrical resistivity () and magnetization () increases drastically. Only 3 Ti doping increases from 4.5 to 23.4 K. To the best of our knowledge, such a huge increase in due to the -site substitution has not been reported earlier in any FM manganite. The application of external magnetic field () shifts MIT towards higher temperature, leading to a field dependent phase boundary. Besides these experimental findings, the role of -site doping on transport and magnetic properties has also been investigated using model Hamiltonian calculations. Our calculations based on Monte-Carlo technique using a two-band double exchange model including electron-phonon coupling, super-exchange interactions and quenched disorder reveal that with increasing Ti content, the lattice distortions around the Ti ions increases and as a result decreases, which qualitatively agree with experimental results.
II EXPERIMENTS
Polycrystalline Sm0.55Sr0.45Mn1-ηTiηO3 samples with 0-0.04 were prepared by conventional solid-state reaction technique. The starting materials, Sm2O3 (pre-fired), SrCO3, Mn3O4 and TiO2 were mixed in a stoichiometric ratio and ground thoroughly in an agate mortar by using ethanol. The mixture was put in a platinum crucible and calcined in air at 1100∘C for few days with intermediate grindings. The obtained powder was pulverized and sintered at 1200∘C for 24 h to ensure the chemical homogeneity. Phase purity and the structural analysis of the samples were done by powder x-ray diffraction (XRD) technique with Cu-Kα radiation in a high resolution Rigaku x-ray diffractometer (TTRAX II). For all the studied compositions (0-0.04), we did not observe any peak due to the impurity phase in the XRD pattern. The Rietveld refinement technique was used for structural analysis. The dc magnetization measurements were performed using a magnetic property measurement system (SQUID-VSM, Quantum Design). Resistivity measurements were performed by a conventional four-probe technique over a wide range of temperature for different applied magnetic fields up to 9 T. We have measured transport and magnetic properties as functions of and for all the samples, but for clarity few of them are presented.
III RESULTS AND DISCUSSION
III.1 Crystal Structure
Figure 1 shows the room-temperature powder x-ray diffraction of Sm0.55Sr0.45Mn1-ηTiηO3 for four compositions, 0, 0.01, 0.02 and 0.03 as representatives. The diffraction patterns show that all the samples have a perovskite orthorhombic (space group ) structure in which the atomic positions of Sm(Sr): 4(,1/4, z), Mn(Ti): 4(0, 0, 1/2), O1: 4(, 1/4, ) and O2: 8(, , ) are used for indexing the Bragg peaks Murugesan . The crystal structure of the samples does not change with Ti doping.
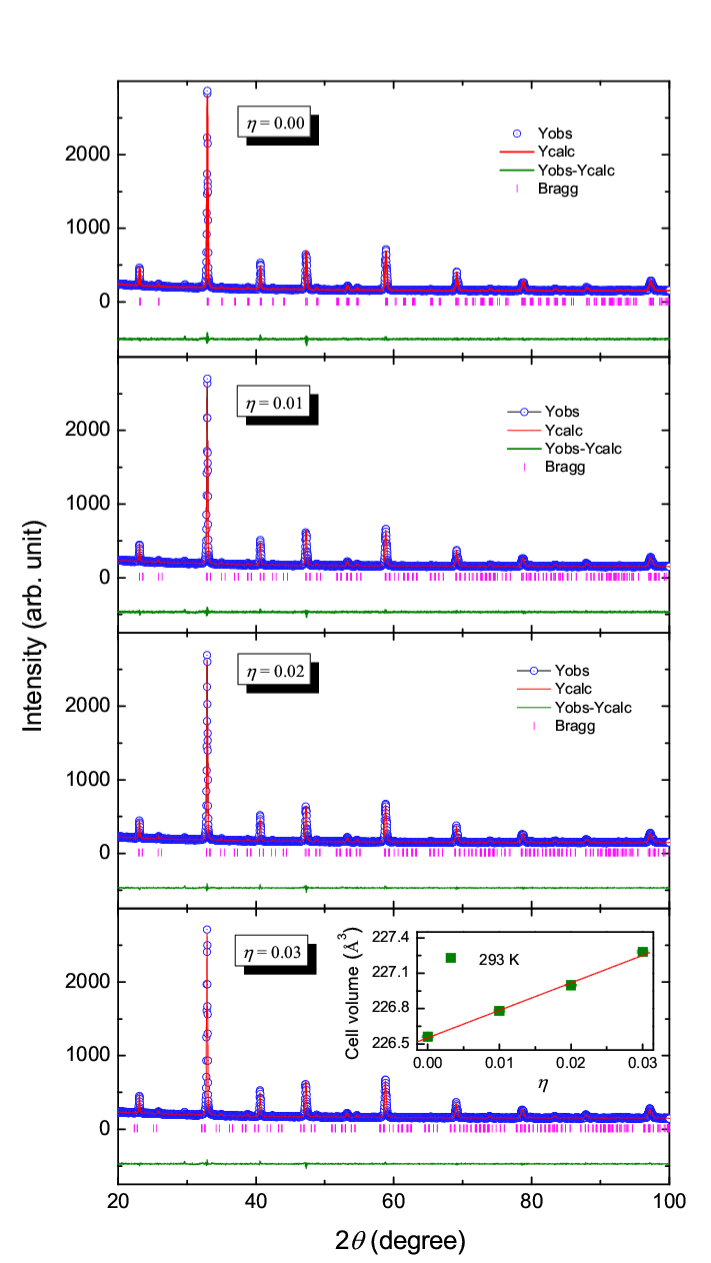
However, with increasing Ti concentration, the lattice parameters , , and hence the unit cell volume increase as shown in the inset of Fig. 1. The increase of cell volume suggests the substitution of Mn4+ ions by Ti4+ ions, considering that the ionic radius of Ti4+ (0.605 Å) is larger than that of the Mn4+ (0.530 Å). The refined parameters are presented in the Table I for various Ti doping. Ti4+ ions partially and randomly substitute isovalent Mn4+ ions and it is believed that like other Ti doped manganites, the substitution of Ti in the present system also increases the average (Mn, Ti)O bond lengths, decreases (Mn,Ti)O(Mn,Ti) bond angle and hence reduces the bandwidth of the system kimti .
| =0.00 | =0.01 | =0.02 | =0.03 | |
|---|---|---|---|---|
| a(Å) | 5.43027(11) | 5.43271(13) | 5.43433(9) | 5.43703(13) |
| b(Å) | 7.66747(14) | 7.66989(16) | 7.67356(11) | 7.67702(16) |
| c(Å) | 5.44146(9) | 5.44253(11) | 5.44352(9) | 5.44512(12) |
| v(Å3) | 226.563(7) | 226.781(8) | 226.999(6) | 227.280(9) |
| 2(%) | 3.34 | 3.25 | 3.17 | 3.17 |
| (Å2), Sm(Sr) | 0.0052(4) | 0.0067(4) | 0.0070(4) | 0.0077(4) |
| (Å2), Mn(Ti) | 0.0021(6) | 0.0049(6) | 0.0032(5) | 0.0048(6) |
| (Å2), O1(O2) | -0.003(2) | 0.007(2) | 0.002(2) | 0.0033(19) |
III.2 Magnetic and transport properties
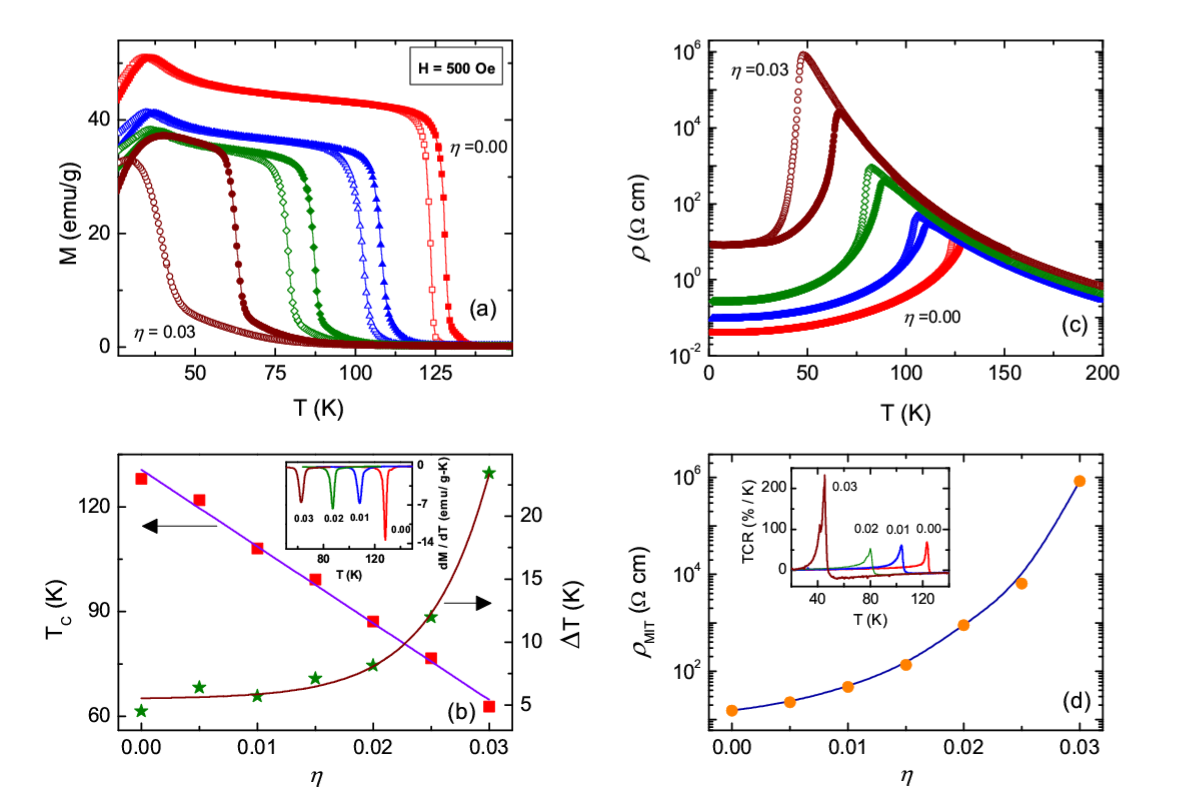
Figure 2(a) shows the temperature dependence of magnetization of Sm0.55Sr0.45Mn1-ηTiηO3 for 0.00, 0.01, 0.02 and 0.03. The parent compound, SSMO shows a sharp FMPM transition at 128 K, estimated as the temperature at which the temperature coefficient of magnetization (d/d) exhibits a deep minimum [inset of Fig. 2(b)]. However, the magnetization data are not same in the warming and cooling cycles, but exhibit a strong irreversibility of 4.5 K. The irreversibility in () curve demonstrates the first-order nature of FM transition in Sm0.55Sr0.45MnO3. With increasing , the ferromagnetism is suppressed which is indicated through the reduction of magnetization as well as a strong decrease in . is observed to decrease approximately linearly with at the rate of 22 K [Fig. 2(b)], which is much higher than that observed in several other Ti doped FM manganites kimti ; nam06 ; nam08 . Not only the , the width of thermal hysteresis also changes drastically with Ti doping which is shown in Fig. 2(b). Remarkably, only 3 Ti doping increases from 4.5 K to 23.4 K. It may be mentioned that has also been measured for sample with slightly higher Ti concentration (0.04) but no FM transition has been observed down to 2 K. In the resistivity curve [Fig. 2 (c)], the MIT is observed at 129 K (0), corresponding to resistivity maximum. The presence of thermal hysteresis in curve around indicates that the MIT is first-order in nature. Similar to magnetization, as Ti substitution proceeds, decreases linearly while the width of the thermal hysteresis in increases exponentially. Depending on the degree of influence of -site doping on charge conduction, the whole temperature region in curve can be divided into three main parts. At low temperatures well below , increases sharply with increasing Ti content. As increases from 0 to 0.03, the residual resistivity increases almost by a factor 104. The value of residual resistivity (8.5 cm) for 0.03 is well above the Ioffe-Regel limit ( cm) to observe metallic behavior, suggesting that the ground state is not a homogeneous ferromagnet rather it can be a coexistence of FM and short-range CO states. Similar to residual resistivity, the peak resistivity at MIT () also enhances by a factor as high as 105 with increasing from 0 to 0.03, as shown in Fig. 2 (d). In the PM insulating state well above , the effect of Ti substitution on is relatively weaker as compared to that in the low-temperature region. For all the samples, the temperature coefficient of resistivity [TCR = ] exhibits a very sharp peak at [inset of Fig. 2 (d)], expected for a first-order phase transition. From figure, one can see that the maximum value of TCR is almost same for 00.02, but it abruptly increases for = 0.03. As MIT for 0.03 is much sharper as compared to other compositions, TCR is very large for this composition in spite of large value of . This behavior is quite unexpected. Normally, disordering in the active Mn-O-Mn network is supposed to broaden the FM transition.
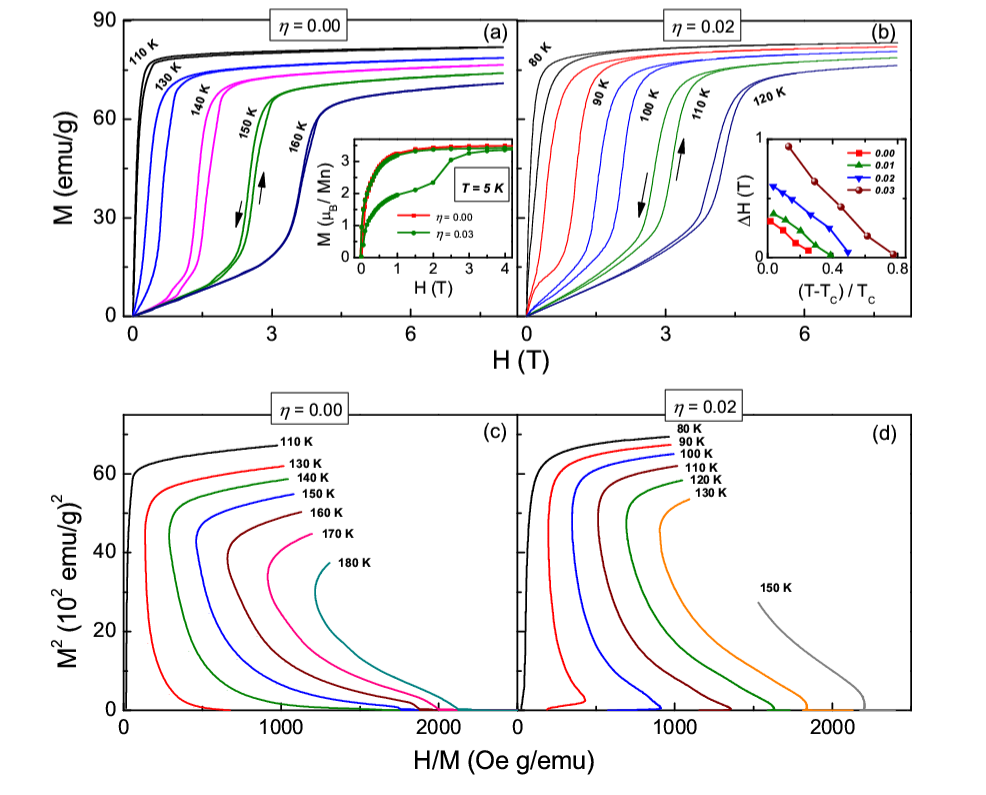
The inset of Fig. 3 (a) shows magnetization hysteresis loop at 5 K for 0.00 and 0.03. We have measured at 5 K for 0.00, 0.01, 0.02 and 0.03, but for clarity, only 0 and 0.03 data are presented in the figure. As in the case of a typical soft ferromagnet, the magnetization of the samples with 0.02 increases rapidly with the application of field and tends to saturate at a relatively low field strength. However, for 0.03, the nature of curve at 5 K is not like a simple ferromagnet but it exhibits a metamagnetic transition along with field hysteresis. Ti substitution weakens the FM ordering of parent compound and may favor the formation of short-range CO state. The saturation magnetization for different are determined by extrapolating the high field part of curves to 0. The estimated values of saturation magnetization are 3.51, 3.46, 3.45 and 3.44 per Mn atom for 0, 0.01, 0.02 and 0.03, respectively. These values are slightly lower than their respective theoretical values of 3.55, 3.52, 3.49 and 3.46 per Mn atom, suggesting that the decrease of magnetization with Ti doping is not only due the dilution of Mn4+ atom but also due to the weakening of exchange coupling. In the vicinity of , isotherms for 0 and 0.02 are presented in Figs. 3 (a) and (b), respectively. curves below are typical of a ferromagnet with small hysteresis between increasing and decreasing field. Initially, increases rapidly with and then tends to saturate and the saturation value of gradually decreases with increasing temperature. Above , we observe S-shaped isotherms, which indicates a metamagnetic phase transition. With increasing , first increases almost linearly and then suffers a step-like jump, indicative of reentrant ferromagnetism. Such a step-like jump in along with the hysteresis are the manifestation of field-induced first-order PM-FM phase transition. The inset of Fig. 3 (b) shows the temperature [reduced temperature, ] dependence of width of the field hysteresis () in isotherms for different . For 0, just above (128 K) is 0.3 T, which decreases almost linearly with increasing and eventually vanishes at a temperature that is around 1.3. is observed to increase with increasing but decreases with increase in almost at the same rate as that for 0. Figures 3 (c) and (d) show the Arrott plots ( vs. /), which offers a criterion for determining whether FM to PM phase transition is first-order or second-order purely by magnetic method arrott . According to Banerjee criterion, if the slope of the Arrott plot is positive then the FM transition is second-order in nature and for a first-order transition the slope is negative banerjee . The undoped compound shows a negative slope in vs. plot and this behavior persists for 0.03, which means that FM transition in all samples is first-order.
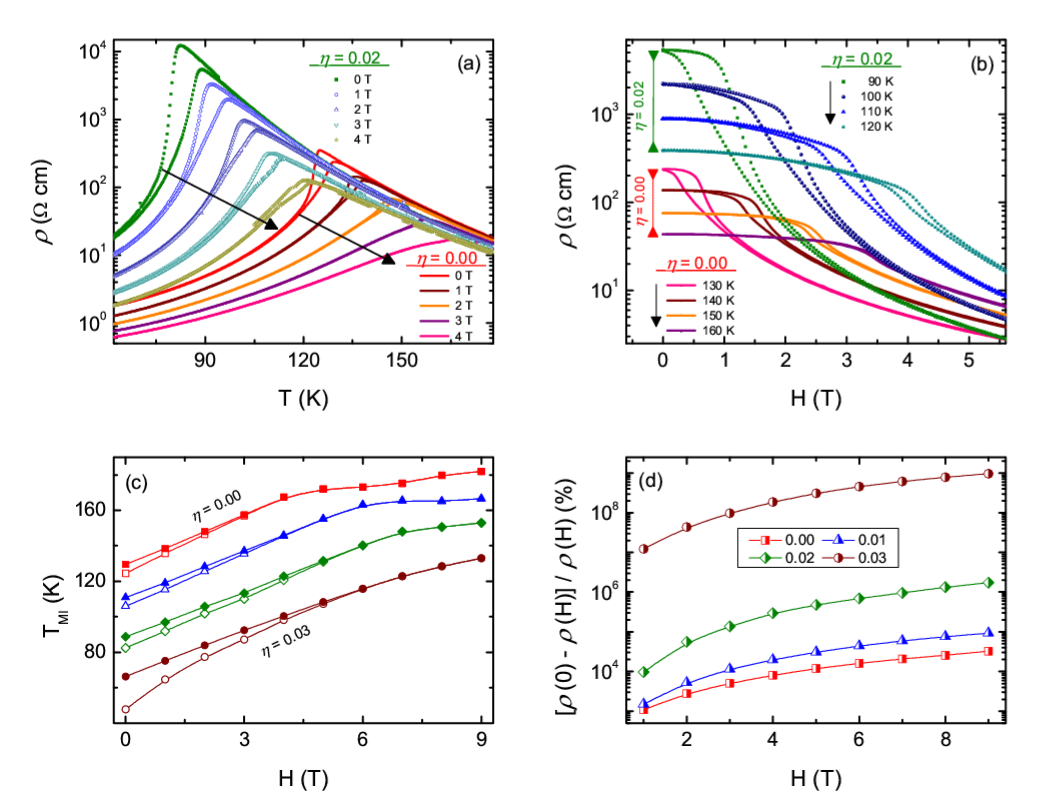
We now investigate the effect of external magnetic field on FM phase transition in Sm0.55Sr0.45Mn1-ηTiηO3 (00.03). The temperature and field dependence of for different (0 and 0.02) are shown in Figs. 4 (a) and (b). Figure 4 (a) shows that the effect of on is maximum in the vicinity of , whereas remains almost unchanged well above . For all samples, the peak resistivity and resistivity below are observed to reduce strongly with field. Well below , application of magnetic field enhances the spin-polarized tunneling through grain boundaries and as a result, residual resistivity decreases rapidly with field. As shown in Fig. 4 (b), resistivity evolves with in an opposite way as that of magnetization [Figs. 3 (a) and (b)]. Just above , drops sharply with along with field hysteresis, a consequence of first-order phase transition. With increasing temperature, the sharpness of the field-induced change in diminishes, the width of the field hysteresis gradually becomes narrow and finally vanishes above a critical temperature, . The resultant phase diagram for various Ti concentrations is plotted in Fig. 4 (c). As increases, the width of thermal hysteresis in gradually decreases and the two phase transition lines, corresponding to the warming and cooling processes, merge to one another at a critical magnetic field (). This feature indicates that external field suppresses the first-order nature of the transition and the transition becomes a crossover above , and the value of critical field increases from 4 to 6 T as increases from o to 0.03. In the regime of , for all samples increases linearly with at an average rate of 9 K/T but at a slower rate above . We have also calculated magnetoresistance (MR) at = (0) for 00.03. Here, MR is defined as =100%, where and are the values of resistivity at zero field and at an applied field , respectively. Figure 4 (d) shows the typical magnetic field dependence of MR for different . For 0, the value of MR at 1 T is , which increases with and becomes for 9 T. MR enhances with Ti doping and the most fascinating effect is observed for the composition 0.03, where MR reaches to for 1 T only and it becomes for 9 T. The observed value of MR is much higher as compared with several other FM manganites.
III.3 Theoretical Simulation
We consider a two-band model Hamiltonian in two dimensions for manganites in the large Hund’s coupling limit () dago1 ; pradhan1 to study the role of Ti doping on transport and magnetic properties of SSMO:
where electrons hop between nearest neighbor sites and with amplitude (for two orbitals and ). The hopping amplitudes depend upon the orientation of Mn spins at the sites and . For details please see Ref. 2. and are anti-ferromagnetic super-exchange interactions between Mn t2g spins () and electron-phonon interactions between the electrons and the Jahn-Teller phonons in the adiabatic limit, respectively. We treat all (with ) and (with stiffness of the Jahn Teller modes =1) as classical class-ref1 ; class-ref2 , and measure all parameters (, , and temperature ) in the units hopping amplitude .
This minimal model Hamiltonian reproduces the correct sequence of magnetic phases yunoki ; pradhan2 ; pradhan3 . Typical 1.61.7 values with = 0.1 reproduce the colossal magnetoresistive properties of intermediate bandwidth manganites qualitatively pradhan2 . For = 1.65 and = 0.1, CE-type insulating phase can be reproduced for electron density = 0.5, whereas the FM window spans over in the range 0.60.7 similar to intermediate bandwidth manganites. Here, we will concentrate our calculations for at which FM is maximum. Recall that in (Sm,Sr) manganite system, is optimum for = 0.55 tomioka06 and our experiments are carried out at that electron density. The effect of A-site disorder (due to mismatch between the ionic radii of Sm3+ and Sr2+) is taken into account by adding in the Hamiltonian where is the quenched binary disorder potential with values . We use =0.1 and also checked our calculations for =0 and 0.2 to show that strong quenched disorder suppresses more rapidly with Ti doping.
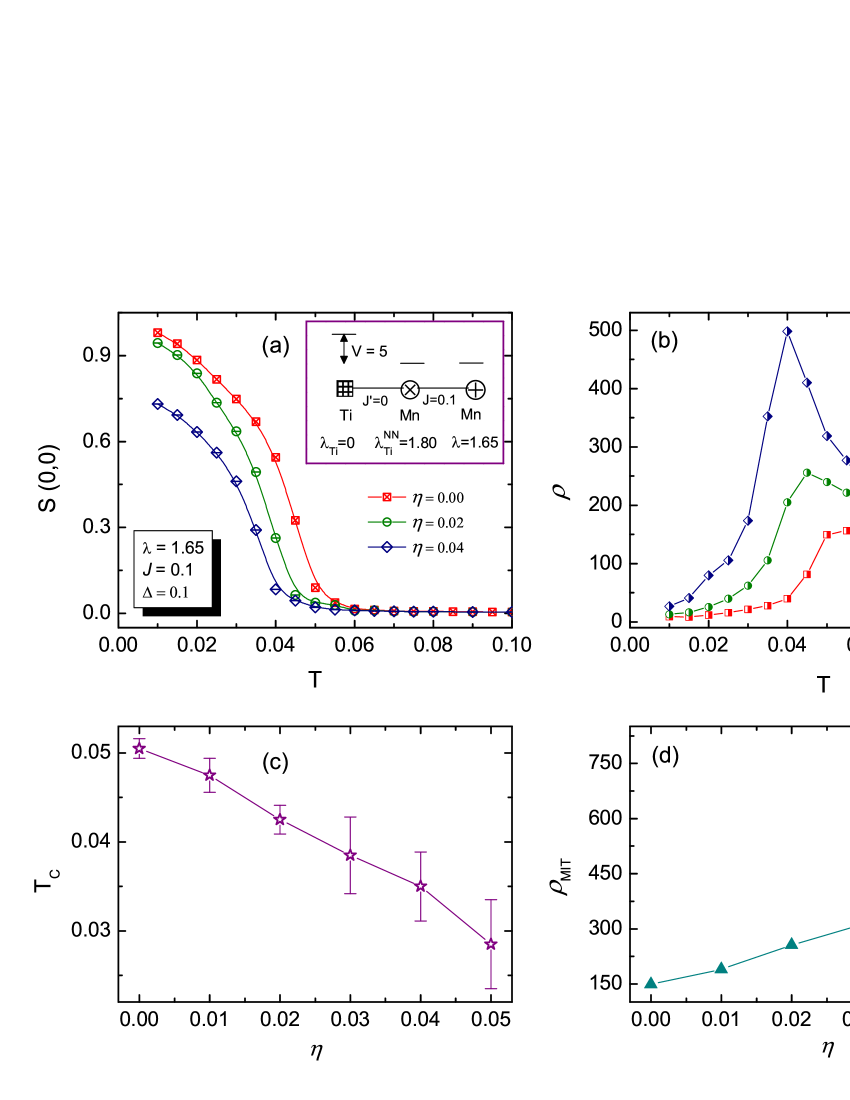
Next, in order to incorporate the effect of non-magnetic B-site dopants (Ti4+ in the present case), we modify the Hamiltonian as shown schematically in the inset of Fig. 5 (a). A large energy level (=5) is used at Ti sites, by adding to the Hamiltonian pradhan1 . For = 5, the electron density at the impurity site is close to zero. The electron-phonon coupling is irrelevant at Ti sites, and for this reason we use at impurity sites = 0. Super-exchange interaction () between impurity site and nearest Mn-sites is modified to zero from [inset of Fig. 5 (a)]. Although our Hamiltonian has spin moment at each impurity site, but that moment is very weakly connected to rest of the system due to and large on site potential (= 5). So, these moments at impurity sites do not affect the magnetism and are not taken into account while calculating the ferromagnetic order. From our experimental results, it is clear that with Ti doping, the unit cell volume of the system increases (inset of Fig. 1) and as a result, the bandwidth of the system decreases kimti . In order to take take this effect into account, we modify the values at the Mn sites (=1.80) those are nearest neighbor to Ti ions. Recall that is measured in units of kinetic energy, and thus larger corresponds to smaller bandwidth. Large helps in localizing the electrons at those sites and as a results Mn3+ look-a-like ions surrounds the Ti4+ ions that minimizes the Coulomb repulsion.
We use an exact diagonalization scheme to the itinerant electron system for each configuration of the background classical variables and . We use a Monte Carlo sampling technique based on the traveling cluster approximation tca-ref ; pradhan2 to access large system sizes. All physical quantities like ferromagnetic structure factor and resistivity are thermally averaged over ten different samples (starting from ten different initial realizations of the quenched disorder and classical variables).
The temperature dependence of the ferromagnetic structure factor (0,0) and resistivity with Ti concentration is shown in Figs. 5 (a) and (b) respectively. (0,0) is obtained by calculating = e at wave vector for Mn sites. The resistivity, in units of (: lattice constant), is obtained from the dc limit of the conductivity (calculated using the Kubo-Greenwood formalism)mahan-book ; cond-ref . The decreases approximately linearly and the resistivity peak increases very fast with as shown in Figs. 5 (c) and (d), respectively and agrees qualitatively with our experiments.
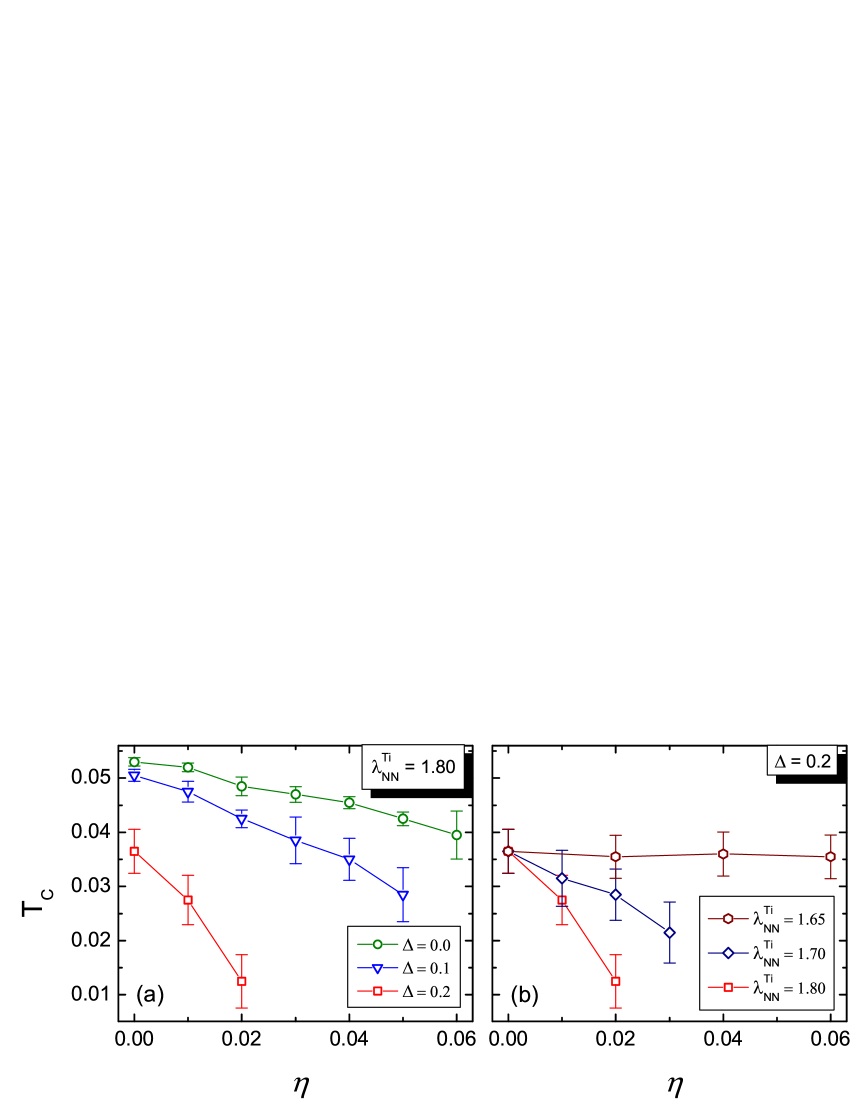
For () and = 1.80, the FM decreases faster (slower) than case as shown in Fig. 6 (a). This shows that disorder also plays an important role in decreasing the FM . We also use = 1.70 for case and find that the FM decreases linearly, albeit up to =0.03, as shown in Fig. 6 (b). But for = 1.65 (i.e., without modifying at nearest neighbour Mn ions of Ti site) the FM remains more or less same until =0.06 for . So, we believe that lattice distortions around the Ti ions increase, which localize the electrons and as a result the FM decreases with Ti doping.
IV Conclusion
The effect of Ti doping on the magnetotransport properties of Sm0.55Sr0.45Mn1-ηTiηO3 () has been studied. All these samples undergo first-order FM-metal to PM-insulator transition at (or ) along with hysteresis. With increasing Ti concentration, decreases linearly while the magnetoresistance increases very rapidly. Our theoretical calculations show that the FM decreases due to the increase of lattice distortion around the Ti ions. The application of external field stabilizes the FM phase and thus weakens the first-order nature of the transition. The critical magnetic field where the first-order transition becomes a crossover increases with Ti doping.
References
- (1) C.N.R. Rao, B. Raveau, Colossal Magnetoresistance, Charge Ordering and Related Properties of Manganese Oxides, (World Scientific, Singapore, 1998).
- (2) E. Dagotto, T. Hotta, and A. Moreo, Phys. Rep. 344, 1 (2001).
- (3) M. B. Salamon and M. Jaime, Rev. Mod. Phys. 73, 583 (2001).
- (4) E. Dagotto, Science 309, 257 (2005).
- (5) Y. Tokura, Rep. Prog. Phys. 69, 797 (2006).
- (6) P. K. Siwach, H. K. Singh, and O. N. Srivastava, J. Phys.: Condens. Matter 20, 273201 (2008).
- (7) H. Y. Hwang, S. W. Cheong, P. G. Radaelli, M. Marezio, and B. Batlogg, Phys. Rev. Lett. 75, 914 (1995).
- (8) Y. Tokura, H. Kuwahara, Y. Moritomo, Y. Tomioka, and A. Asamitsu, Phys. Rev. Lett. 76 3184 (1996).
- (9) L. M. Rodriguez-Martinez and J. P. Attfield, Phys. Rev. B 54, R15622 (1996); 58, 2426 (1998); 63, 024424 (2000).
- (10) J. P. Attfield, Int. J. Inorg. Mater. 3, 1147 (2001).
- (11) Y. Tomioka, Y. Okimoto, J. H. Jung, R. Kumai, and Y. Tokura, Phys. Rev. B 68, 094417 (2003).
- (12) D. Akahoshi, M. Uchida, Y. Tomioka, T. Arima, Y. Matsui, and Y. Tokura, Phys. Rev. Lett. 90, 177203 (2003).
- (13) G. L. Liu, J. S. Zhou, and J. B. Goodenough, Phys. Rev. B 70, 224421 (2004).
- (14) Y. Tomioka and Y. Tokura, Phys. Rev. B 70, 14432 (2004).
- (15) L. M. Fisher, A. V. Kalinov, I. F. Voloshin, N. A. Babushkina, D. I. Khomshkii, Y. Zhang, and T. T. M. Palstra, Phys. Rev. B 70, 212411 (2004).
- (16) Y. Tomioka, H. Hiraka, Y. Endoh, and Y. Tokura, Phys. Rev. B 74, 104420 (2006).
- (17) P. Sarkar, P. Mandal, A. K. Bera, S. M. Yusuf, L. S. S. Chandra, and V. Ganesan, Phys. Rev. B 78, 012415 (2008).
- (18) L. Demkó, I. Kézsmárki, G. Mihály, N. Takeshita, Y. Tomioka, and Y. Tokura, Phys. Rev. Lett. 101, 037206 (2008).
- (19) P. Sarkar, P. Mandal, A. K. Bera, S. M. Yusuf, S. Arumugam, C. Q. Jin, T. Ishida, and S. Noguchi, Phys. Rev. B 79, 144431 (2009).
- (20) P. Sarkar, S. Arumugam, P. Mandal, A. Murugeswari, R. Thiyagarajan, S. E. Muthu, D. M. Radheep, C. Ganguli, K. Matsubayshi, and Y. Uwatoko, Phys. Rev. Lett. 103, 057205 (2009).
- (21) N. Khan, P. Sarkar, A. Midya, P. Mandal, and P. K. Mohanty, Sci. Rep. 7, 45004 (2017).
- (22) Y. Moritomo, A. Machida, S. Mori, N. Yamamoto, and A. Nakamura, Phys. Rev. B 60, 9220 (1999).
- (23) T. Kimura, R. Kumai, Y. Okimoto, Y. Tomioka, and Y. Tokura Phys. Rev. B 62, 15021 (2000).
- (24) A. Machida, Y. Moritomo, K. Ohoyama, T. Katsufuji, and A. Nakamura, Phys. Rev. B 65, 064435 (2002).
- (25) H. Sakai, K. Ito, R. Kumai, and Y. Tokura, Phys. Rev. B 76, 155112 (2007).
- (26) C. L. Lu, X. Chen, S. Dong, K. F. Wang, H. L. Cai, J.-M. Liu, D. Li, and Z. D. Zhang Phys. Rev. B 79, 245105 (2009).
- (27) C. Lu , N. Hu , M. Yang , S. Xia , H. Wang , J. Wang , Z. Xia , and J. M. Liub , Sci. Rep. 4, 4902 (2014).
- (28) A. Maignan, F. Damay, A. Barnabe, C. Martin, M, Hervieu, and B. Raveau, Phil. Trans. R. Soc. Lond. A 356, 1635 (1998), and references herein.
- (29) C. Martin, A. Maignan, M. Hervieu, C. Autret, B. Raveau, and D. I. Khomskii, Phys. Rev. B 63, 174402 (2001).
- (30) M. S. Kim, J. B. Yang, Q. Cai, X. D. Zhou, W. J. James, W. B. Yelon, P. E. Parris, D. Buddhikot, and S. K. Malik, Phys. Rev. B 71, 014433 (2005).
- (31) D. N. H. Nam, L. V. Bau, N. V. Khiem, N. V. Dai, L. V. Hong, N. X. Phuc, R. S. Newrock, and P. Nordblad, Phys. Rev. B 73, 184430 (2006).
- (32) D. N. H. Nam, N. V. Dai, T. D. Thanh, L. T. C. Tuong, L. V. Hong, N. X. Phuc, H. S. Hong, and N. V. Khien, Phys. Rev. B 77, 224420 (2008).
- (33) M. M. Saber, M. Egilmez, A. I. Mansour, I. Fan, K. H. Chow, and J. Jung, Phys. Rev. B 82, 172401 (2010).
- (34) I. Dhiman , A. Das , A. K. Nigam , and R. K. Kremer , J. Magn. Magn. Mater. 334, 21 (2013).
- (35) K. Pradhan, A. Mukherjee, and P. Majumdar, Europhys. Lett. 84, 37007 (2008).
- (36) G. Murugesan, R. Nithya, and S. Kalainathan, Powder Diffraction 31, 77 (2016).
- (37) A. Arrott and J. E. Noakes, Phys. Rev. Lett. 19, 786 (1967).
- (38) B. K. Banerjee, Phys. Lett. 12, 16 (1964).
- (39) S. Yunoki, J. Hu, A. L. Malvezzi, A. Moreo, N. Furusaki, and E. Dagotto, Phys. Rev. Lett. 80, 845 (1998).
- (40) E. Dagotto, S. Yunoki, A. L. Malvezzi, A. Moreo, J. Hu, S. Capponi, D. Poilblanc, and N. Furukawa, Phys. Rev. B 58, 6414 (1998).
- (41) S. Yunoki, T. Hotta, and E. Dagotto, Phys. Rev. Lett. 84, 3714 (2000).
- (42) K. Pradhan, A. Mukherjee, and P. Majumdar, Phys. Rev. Lett. 99, 147206 (2007).
- (43) K. Pradhan and S. Yunoki, Phys. Rev. B 96, 214416 (2017).
- (44) S. Kumar and P. Majumdar, Eur. Phys. J. B 50, 571 (2006).
- (45) G. D. Mahan, Quantum Many Particle Physics (Plenum Press, New York, 1990).
- (46) S. Kumar and P. Majumdar, Europhys. Lett. 65, 75 (2004).