The chemical composition of NGC 5824, a globular cluster without iron spread but with an extreme Mg-Al anticorrelation 111Based on observations collected at the ESO-VLT under the program 095.D-0290.
Abstract
NGC 5824 is a massive Galactic globular cluster suspected to have an intrinsic spread in its iron content, according to the strength of the calcium triplet lines. We present chemical abundances of 117 cluster giant stars using high-resolution spectra acquired with the multi-object spectrograph FLAMES. The metallicity distribution of 87 red giant branch stars is peaked at [Fe/H]=–2.110.01 dex, while that derived from 30 asymptotic giant branch stars is peaked at [Fe/H]=–2.200.01 dex. Both the distributions are compatible with a null spread, pointing out that this cluster did not retain the ejecta of supernovae. The small iron abundance offset between the two groups of stars is similar to those already observed among red and asymptotic giant branch stars in other clusters. The lack of intrinsic iron spread rules out the possibility that NGC 5824 is the remnant of a disrupted dwarf galaxy, as previously suggested. We also find evidence of the chemical anomalies usually observed in globular clusters, namely the Na-O and the Mg-Al anticorrelations. In particular, NGC 5824 exhibits a huge range of [Mg/Fe] abundance, observed only in a few metal-poor and/or massive clusters. We conclude that NGC 5824 is a normal globular cluster, without spread in [Fe/H] but with an unusually large spread in [Mg/Fe], possibly due to an efficient self-enrichment driven by massive asymptotic giant branch stars.
1 Introduction
The majority of the Galactic globular clusters (GCs) studied so far
through high-resolution spectroscopy reveals two chemical signatures,
usually considered as the key features to define a stellar system as a GC:
(1) a very small star-to-star scatter in their iron abundance, compatible,
within their uncertainties, with a null spread (see e.g. Carretta et al., 2009a; Willman & Strader, 2012);
(2) the presence of star-to-star variations in the chemical abundances of some
light elements, structured in some well-defined patterns, like the Na-O and Mg-Al
anticorrelations (see e.g. Carretta et al., 2009b, c; Meszaros et al., 2015; Pancino et al., 2017).
The first evidence points out that GCs were not massive enough to retain in their
gravitational well the high-velocity ejecta of the supernovae. The second evidence instead
is interpreted as the signature of the retaining/recycling of the low-velocity ejecta
of some polluter stars where high-temperature proton-capture cycles (CNO, NeNa and MgAl chains) occurred.
While the details of this self-enrichment process are still unclear and under debate
(see e.g. the critical discussions by Bastian & Lardo (2015) and Renzini et al., 2015),
the presence of chemically distinct stellar populations in GCs is now widely recognized and accepted.
While the Na-O anticorrelation has been detected in almost all old GCs studied so far (at least in those with statistically significant samples 222 We remind the case of Ruprecht 106 that does not show chemical anomalies in the light elements from the analysis of 9 stars (Villanova et al., 2013).), some undeniable exceptions to the first evidence quoted above are known. There are three massive stellar systems, usually labelled as GCs according to their appearance and brightness profile, that show large metallicity distributions: Omega Centauri in the Galactic Halo (Johnson & Pilachowski, 2010; Pancino et al., 2011; Marino et al., 2011a), Terzan 5 in the Galactic Bulge (Ferraro et al., 2009; Origlia et al., 2011, 2013; Massari et al., 2014) and M54 in the Sagittarius dwarf galaxy (Brown, Wallerstein & Gonzalez, 1999; Bellazzini et al., 2008; Carretta et al., 2010a, b; Mucciarelli et al., 2017a). The first two stellar systems have multi-modal [Fe/H] distributions, covering a range of 1 dex, while the metallicity distribution of M54, once the contamination of the Sagittarius stars has been taken into account, is significantly smaller than those of Omega Centauri and Terzan 5. Even if characterized by the largest metallicity distributions observed so far among the GC-like systems, these three systems cannot be easily explained within the same framework: Omega Centauri is usually interpreted as the remnant of a disrupted dwarf spheroidal galaxy (Bekki & Freeman, 2003), Terzan 5 is likely the fossil relic of one of the primordial structures that contributed to build up the Galactic Bulge (Ferraro et al., 2016), while M54, due to its position coincident with the center of the Sagittarius galaxy and the strong difference between its dispersion velocity profile and that of Sagittarius, should be a GC formed independently by the true nucleus of the galaxy and decayed to the present-day position due to dynamical friction (as demonstrated by Bellazzini et al., 2008).
Recently, other GCs have been proposed to have a intrinsic iron spread (but smaller than those observed in three stellar systems quoted above). Small intrinsic [Fe/H] scatters (of the order of 0.1 dex), based on both low- and high-resolution spectroscopy, have been claimed for M 22 (Marino et al., 2009), NGC 3201 (Simmerer et al., 2013), M 2 (Yong et al., 2014), NGC 5824 (Da Costa, Held & Saviane, 2014, hereafter DC14), NGC 5286 (Marino et al., 2015) and M 19 (Johnson et al., 2016). For most of these clusters (like M 2, M 22, NGC 5286 and M 19), spreads in the s-process and C+N+O abundances (with [s/Fe] and C+N+O abundance ratios increasing with [Fe/H]) has been detected, similar to that observed in Omega Centauri (no information about s-process element abundances are available so far for Terzan 5 and M54333Note that Carretta et al. (2014) quoted the average [s/Fe] abundance ratios measured in the UVES stars of M54 already discussed in Carretta et al. (2010a, b) but not the abundances for the individual stars. This makes impossible to understand whether also M54 shows the same behavior of [s/Fe] with [Fe/H].). The similarities (but at lower extent) with Omega Centauri have suggested that these clusters could be the remnant of dwarf galaxies accreted from our Galaxy (see e.g. the discussion in Marino et al., 2015).
Even if fascinating, this hypothesis needs to be supported from extensive and robust spectroscopic studies, because several different effects can mimic a spurious iron spread. In the case of NGC 3201, the iron spread originally proposed by Simmerer et al. (2013) was found to be due to the inclusion in the sample of some AGB stars that show systematic under-abundances of [FeI/H] (see Lapenna et al., 2014) and hence erroneously interpreted as a metal-poor tail in the cluster metallicity distribution (Mucciarelli et al., 2015a). In the remote GC NGC 2419 (the GC with the largest [Mg/Fe] spread, having stars with [Mg/Fe] extended down to –1 dex) the strength of the Ca II triplet lines provides a wide metallicity distribution (see Ibata et al., 2011). However, this iron spread is artificial because the strength of the Ca II triplet lines (at a constant Fe and Ca abundance) significantly increases in those stars characterized by a relevant depletion in Mg, being Mg one of the most important electron donors in the giant star atmospheres (Mucciarelli et al., 2012). Also the case of M22 has been revised by Mucciarelli et al. (2015b) demonstrating that the use of photometric gravities (instead of the spectroscopic ones) leads to a narrow iron distribution, compatible with a null intrinsic spread, when FeII lines are measured (while the use of spectroscopic gravities provides two broad metallicity distributions but also implies unrealistic and too low stellar masses). A similar approach has been applied by Lardo, Mucciarelli & Bastian (2016) to M2, thus reducing the iron spread claimed for this cluster by Yong et al. (2014).
In this paper we focus our attention on the outer halo GC NGC 5824, another cluster for which a modest iron spread was claimed. First, Saviane et al. (2012) suggested a possible metallicity spread based on metallicity inferred from the strength of the Ca II triplet lines of 17 stars, subsequently confirmed by DC14 adopting the same technique for a sample of 108 RGB cluster stars. The [Fe/H] distribution derived by DC14 has an average value of –2.010.01 dex with an observed spread of 0.07 dex. DC14 proposed that also NGC 5824 could be another case of remnant of a disrupted dwarf galaxy.
Using the Magellan II Telescope, Roederer et al. (2016, hereafter Ro16) measured the chemical composition of 26 stars using the Michigan/Magellan Fiber System (with a spectral resolution of 34000 and a spectral coverage of 4425-4635 Å ) and of two stars using the MIKE spectrograph (spectral resolution of 40000 and coverage of 3350-9150 Å ). The total sample provides an average [Fe/H] abundance of –2.380.01 dex (= 0.08 dex) from FeI lines and of –1.940.02 dex (= 0.08 dex) from FeII lines. The observed dispersions from both the two iron distributions are compatible with a null spread, even if Ro16 noted that their observed targets are in the brightest portion of the RGB where the corresponding targets by DC14 provide a small dispersion (while a larger dispersion is found for the faintest stars). Ro16 concluded that their high-resolution spectroscopic sample could be not adequate to provide a conclusive answer about a possible iron spread in this cluster.
In this paper we investigate the chemical composition of NGC 5824 using a sample of high-resolution spectra collected with FLAMES at the Very Large Telescope for a total of 117 member stars..
2 Observations
The observations have been collected under the program 095.D-0290 (PI: Mucciarelli) and performed during the night May 28 2015 with the multi-object spectrograph FLAMES (Pasquini et al., 2000) at the Very Large Telescope of ESO in the GIRAFFE+UVES combined mode, allowing the simultaneous allocation of 132 mid-resolution GIRAFFE fibers and 8 high-resolution UVES (Dekker et al., 2000) fibers. The adopted setups are GIRAFFE HR21 (with a spectral coverage of 8480–9000 Å and a spectral resolution of 18000) and UVES Red Arm 580 (with a spectral coverage of 4800–6800 Å and a spectral resolution of 45000). Two configurations of targets have been defined, the first one has been observed with 4 exposures of 45 min each and the second one with 5 exposures of 45 min each. The targets have been selected from the WFPC2@HST photometric catalog by Sanna et al. (2014), picking only giant stars predicted to be not contaminated within the FLAMES fiber diameter by neighbor stars with brighter or comparable magnitudes. In the target allocation procedure the highest priority has been attributed to stars already observed: the UVES fibers were allocated to stars already observed by DC14 and Ro16, and the GIRAFFE fibers to the remaining DC14 targets for which the membership has been already established. Most of the targets have been allocated within 350 arcsec from the cluster center; at larger radii the color-magnitude diagram (CMD) is dominated by field stars and the cluster sequences are barely recognizable. The residual fibers have been allocated to giant stars in the external regions, in order to have a sample of surrounding field stars for the identification of possible Galactic interlopers among the stars observed close to the cluster. A total of 211 stars have been observed (205 with GIRAFFE and 6 with UVES). 88 of them are in common with DC14, while 23 are in common with Ro16 (all in common with DC14). Finally, about 20 GIRAFFE fibers and two UVES fibers have been dedicated to observe empty sky regions in order to sample the sky background.
The spectra have been reduced using the dedicated ESO pipelines that perform bias-subtraction, flat-fielding, wavelength calibration, one-dimensional spectral extraction and (only for the UVES spectra) order merging. For each exposure, the spectra of the sky regions have been combined together and the derived master-sky spectrum subtracted to each individual stellar spectrum. The latter have been corrected for the corresponding heliocentric radial velocity (RV) as explained in Section 3 and finally the spectra of each target coadded together, reaching signal-to-noise ratio (SNR) per pixel from 70 for the faintest GIRAFFE targets (V17.8) to 260 for the brightest ones (V15.4). For the UVES spectra a SNR per pixel of 50 is reached.
3 Radial velocities
RVs have been measured adopting the standard cross-correlation method as implemented in the IRAF task FXCOR. As template spectrum we adopted a synthetic spectrum calculated with the SYNTHE code (see Sbordone et al., 2004) and convoluted with a Gaussian profile in order to reproduce the instrumental profile. Before to measure the RV on the photospheric lines, we checked the correctness of the wavelength calibration by measuring the position of some sky emission lines: both for GIRAFFE and UVES spectra no significant offset in the zero-point of the wavelength calibration is found.
For each target, the measure of RV has been performed on the spectra of individual exposures and then the final heliocentric RV has ben computed as average of the individual values. This approach allows to detect possible binary stars, at least those stars with RV variations detectable within the same night. We identified only one star (namely #29580) that shows a dispersion of the average RV significantly larger than those measured in stars of similar magnitude. This star, even if likely cluster member according to its median RV and the small distance from the cluster center (60 arcsec), has been excluded from the following chemical analysis.
Table 1 lists for all the targets the final heliocentric RVs computed as non-weighted mean of the individual measures; the quoted uncertainties have been computed as the dispersion of the mean normalized to the root mean square of the number of used exposures.
For the 88 targets in common with DC14 an average RV difference (in the sense our study - DC14) of +2.51.1 km s-1(10.1 km s-1) is found, where the dispersion is dominated by the uncertainties in the DC14 RVs, due to the lower spectral resolution (R2500). For the 23 stars in common with Ro16 we found +0.70.2 km s-1(0.8 km s-1).
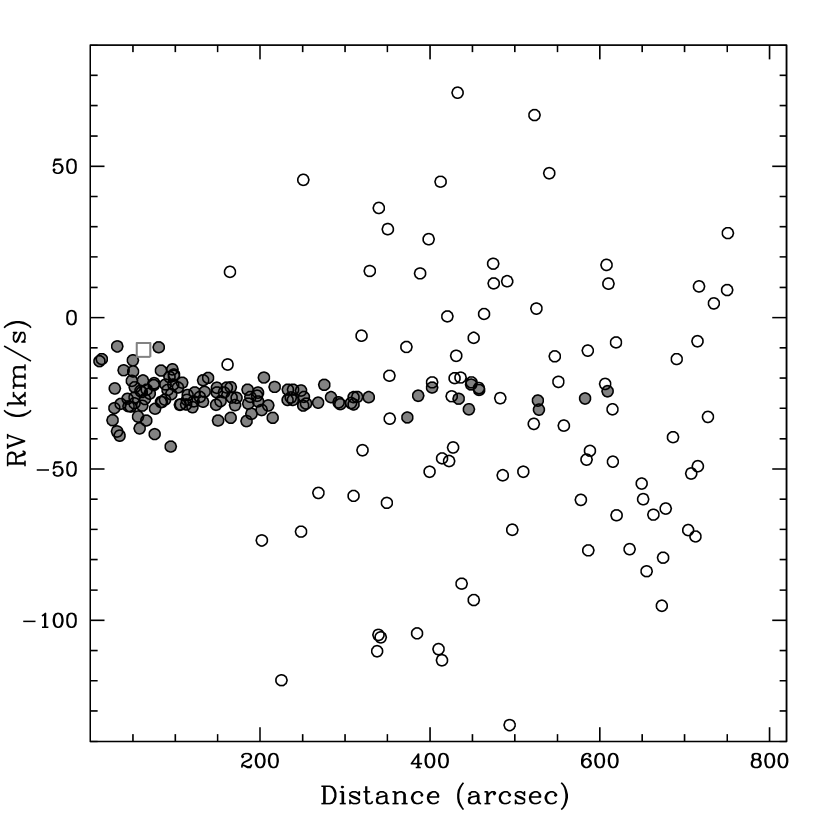
Fig. 1 shows the behavior of the heliocentric RVs of all the targets as a function of the distance from the cluster center quoted by Sanna et al. (2014). As visible, a group of stars with RV clumped around –26 km s-1is clearly recognizable until 350 arcsec, while for larger radii the sample shows a significant RV dispersion. The grey points are the stars selected as member cluster stars according to their RV and [Fe/H] (see Section 6). The position of the candidate binary star is shown as a square symbol.
4 Atmospheric parameters
The determination of the atmospheric parameters has been performed using photometric information. The magnitudes of the catalog by Sanna et al. (2014) have been reported in standard Johnson photometric system using the stars in common with the catalog of photometric standard stars by P. B. Stetson444http://www.cadc-ccda.hia-iha.nrc-cnrc.gc.ca/en/community/STETSON/standards/. Effective temperatures () have been computed by means the – transformation by Alonso, Arribas & Martinez-Roger (1999, 2001) and adopting the color excess E(B-V)= 0.14 mag (Ferraro et al., 1999). The extinction coefficients are from McCall (2004). Because of the dependence on the metallicity of the – relation, we adopted as guess value a metallicity [Fe/H]=–2.0 dex (according to DC14 and Ro16) for all the targets. After a first determination of the chemical abundances, have been refined using the proper metallicity of each star.
Surface gravities (log g) have been estimated using the Stefan-Boltzmann relation, assuming the photometric , the bolometric corrections estimated according to Alonso, Arribas & Martinez-Roger (1999) and the true distance modulus quoted by Ferraro et al. (1999) (= 17.53 mag). In the first determination of log g, we assumed a stellar mass of 0.75 ; subsequently we attributed a stellar mass of 0.65 for the member stars labelled as AGB stars according to their position in the V-(U-V) CMD (see Section. 6). Note that an incorrect attribution of a cluster star to an evolutionary sequence has a negligible impact on the derived abundances: a difference of 0.1 in stellar mass leads to a variation in log g of 0.06, corresponding to a variation in the [Fe/H] abundances of 0.01 dex or less.
Due to the small (15) number of Fe I lines available for the GIRAFFE targets (that are the majority of the sample), microturbulent velocities () derived spectroscopically could be highly uncertain and we prefer to adopt the log g– calibration provided by Kirby et al. (2009). Although the small number of lines, we checked for most of the stars that the adopted does not provide significant trend between iron abundance and line strength. Only for a few stars we find a significant slope (at a level of 3 or more) and we change the value of in order to erase this trend.
The six stars observed with UVES allow to perform some sanity checks on the atmospheric parameters adopted for the analysis. The atmospheric parameters have been derived spectroscopically according to three criteria: (i) no trend between Fe I abundance and excitation potential (to constrain ); (ii) no trend between Fe I abundance and line strength (to constrain ); (iii) same abundance from Fe I and Fe II lines (to constrain log g). The spectroscopic well agree with the photometric ones, with an average difference (spectroscopic minus photometric) of –47 K (= 29 K), as well as the microturbulent velocities (the spectroscopic ones are on average lower than those obtained with the Kirby et al. (2009) calibration by –0.2 km s-1, = 0.07 km s-1). Finally, the spectroscopic gravities are lower by –0.2 dex (= 0.03 dex), due to the small difference (–0.1 dex) between [FeI/H] and [FeII/H] obtained with the photometric log g. The average difference between [FeI/H] derived from spectroscopic and photometric parameters is –0.03 dex (= 0.04 dex), suggesting that the adopted parameters are not affected by any significant bias.
5 Chemical analysis
Abundances of Fe, Al and Mg have been derived for all the targets, while abundances of O and Na have been determined only for the UVES targets, because no O and Na lines are available in the GIRAFFE HR21 setup. In particular, Fe I lines are available for both UVES and GIRAFFE targets, while Fe II lines have been measured only in UVES spectra (because no Fe II lines are in the HR21 GIRAFFE grating).
For all these elements, the chemical analysis is based on 1-dimensional, plane-parallel model atmospheres calculated with the code ATLAS9 (Castelli, 2005), adopting -enhanced chemical mixture and without the inclusion of the approximate overshooting in the calculation of the convective flux. The derived abundance ratios are referred to the solar abundances by Grevesse & Sauval (1998) but for O for which we adopted the solar value by Caffau et al. (2011).
The abundances of Fe, Na and Al have been calculated from the measured equivalent widths of metallic lines using the code GALA (Mucciarelli et al., 2013a), based on the WIDTH9 software originally developed by R. L. Kurucz (see Castelli, 2005, for details). We selected transitions predicted to be unblended at the resolution of UVES and HR21 GIRAFFE setup. The atomic data are from the Kurucz/Castelli linelist555http://www.oact.inaf.it/castelli/castelli/linelists.html, improved with new atomic data for some lines of interest (we refer the reader to Mucciarelli et al. (2017b) for a detailed description of the linelist). Table 2 lists the atomic data (wavelength, oscillator strength and excitation potential) for all the used transitions.
Al abundances from GIRAFFE targets are derived from the doublet at 8772-8773 Å , while for the UVES targets from the doublet at 6696-6698 Å . For some stars these lines are too weak to be detected, due to the low Al abundances (see Section 8), and only upper limits can be provided by adopting the abundance corresponding to an EW equal to 3 times the uncertainty calculated according to the Cayrel (1988) formula.
The Na abundances for the UVES targets have been obtained from the doublets 5682-5688 Å and 6154-6160 Å and corrected for departures from local thermodynamic equilibrium according to Gratton et al. (1999).
The abundances of Mg for the GIRAFFE targets have been derived from the Mg I line at 8806 Å by using spectral synthesis, in order to properly account for the profile of this strong line that can have significant wings. In particular, the abundances have been obtained using our own code SALVADOR that performs a -minimization between the observed spectra and a grid of synthetic spectra calculated on the fly with the spectral synthesis code SYNTHE. For the UVES targets, Mg abundances have been obtained from the measurement of the EW of the Mg I line at 5711 Å . The Mg abundance for the GIRAFFE targets have been decreased by –0.28 dex in order to match the peak of the [Mg/Fe] distribution for the GIRAFFE stars with the highest [Mg/Fe] derived for the UVES targets. Offsets between the Mg abundances derived from the line at 8806 Å and the optical lines have been already found in other analysis (see e.g. Mucciarelli et al., 2017a). Note that we are interested mainly to the star-to-star variations of [Mg/Fe] in this cluster and not to the absolute value of the abundances.
The uncertainties in any abundance ratio have been calculated by summing in quadrature
the errors arising from the measure procedure (EWs or spectral fitting) and from the
atmospheric parameters.
(1) Uncertainties due to EWs—
The errors in abundance due to the EW measurements have been computed as
the dispersion of the mean normalized to the root mean square of the number of used lines.
When only one line is available, the uncertainty is estimated considering the
error in EW provided by DAOSPEC.
(2) Uncertainties due to spectral fitting—
The uncertainties in the fitting procedure have been estimated
using Montecarlo simulations. For different values of SNR, corresponding to the range
of SNR covered by the GIRAFFE targets, samples of 500 synthetic spectra at the same spectral resolution and
pixel-size of the GIRAFFE spectra and with the inclusion
of Poissonian noise have been created and analyzed with the same fitting procedure
used for the observed spectra. The dispersion of the derived abundance distribution is
assumed as 1 uncertainty associated to the abundance from spectra with that SNR.
The derived uncertainties in the fitting procedure range from 0.01 dex for SNR=260 to
0.07 dex for SNR=70 for the Mg I line at 8806 Å measured in the GIRAFFE targets.
For the O abundance the typical uncertainty is about 0.05 dex.
(3) Uncertainties due to the atmospheric parameters—
These uncertainties are computed by varying each time only one parameter by the corresponding
error, keeping the other ones fixed and repeating the analysis.
According to the photometric uncertainties we estimated internal errors in
of about 40 K, in log g of 0.1 and in of 0.1 km s-1. Note that we are mainly
interested to the internal uncertainties in the atmospheric parameters because the main goal
of this study is investigate possible intrinsic star-to-star scatters.
6 Membership
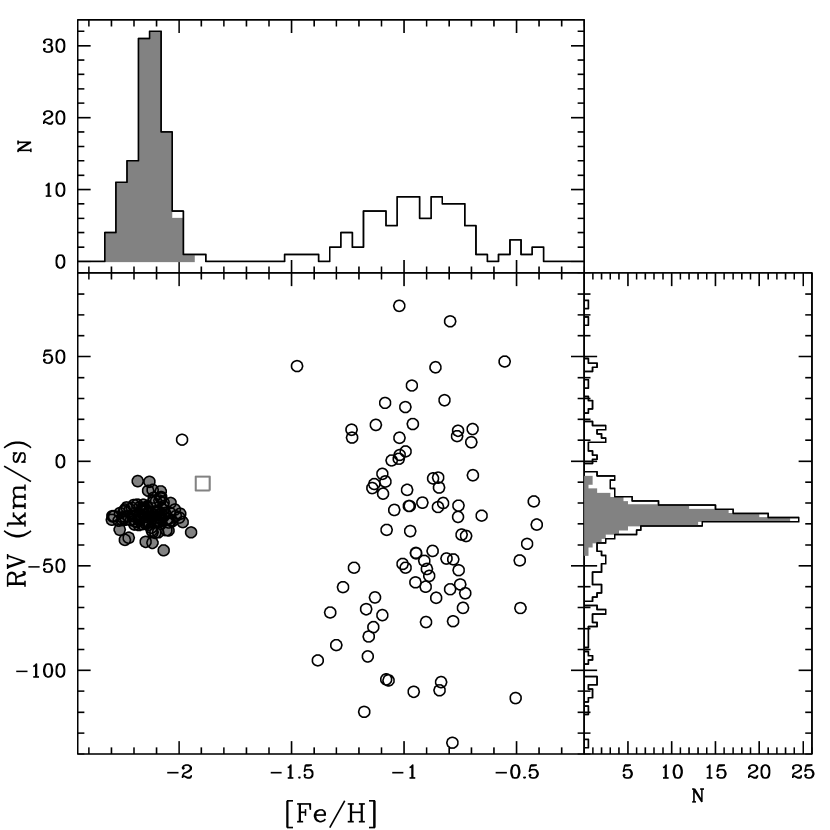
We identified likely cluster member stars according to their RV and [Fe/H]. Fig. 2 shows the position of the observed targets in the RV-[Fe/H] plane. Stars belonging to NGC 5824 are easily identifiable as a clump of stars around RV–25 km s-1and [Fe/H]–2.1 dex. The surrounding field stars show a large RV distribution peaked at values similar to those of the cluster stars but metallicities larger than [Fe/H]–1.5 dex and peaked at –0.9 dex. We consider member stars those with [Fe/H] between –2.35 and –1.90 dex and with RV between -50 and 0 km s-1(and marked as grey circles in Fig. 2).
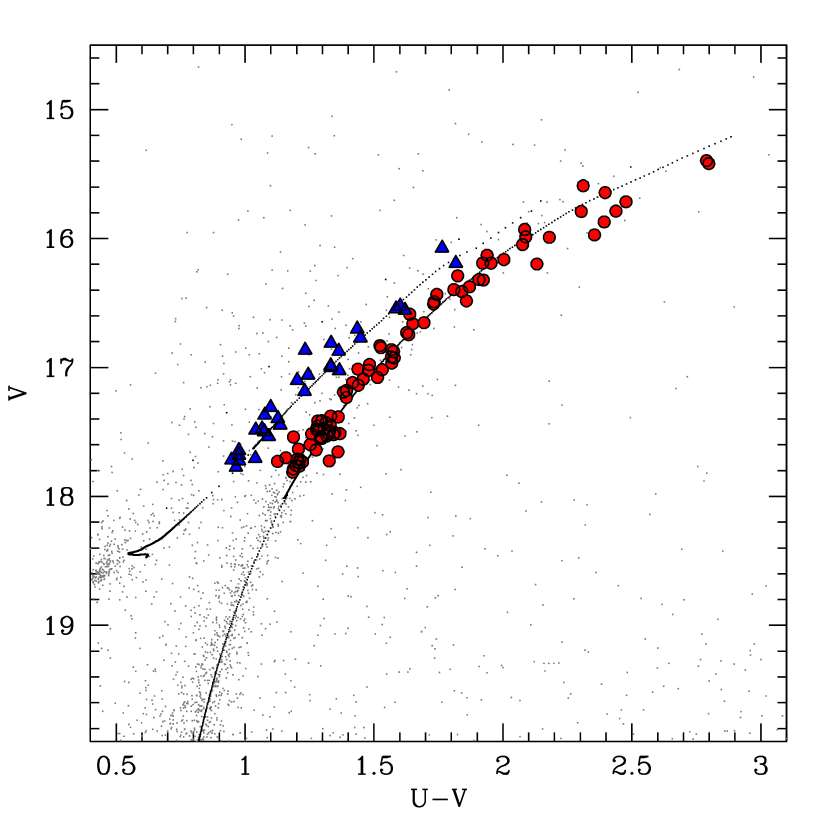
A total of 117 member cluster stars are identified. All the main information (coordinates, magnitudes, RVs) of these stars are listed in Table 1. Note that 11 of them are located at a distance from the cluster center larger than 350 arcsec, where the sample is dominated by Galactic field stars. However, their metallicity is clearly different with respect to that of the surrounding field and this provides their membership to the cluster. The mean heliocentric RV of this sample is -26.00.5 km s-1(= 5.4 km s-1), in good agreement with those quoted by DC14 e Ro16. According to the distance in the V-(U-V) CMD to the best-fit theoretical isochrone (see Sanna et al., 2014, for details), we attributed each cluster star to RGB or AGB, identifying 87 RGB stars and 30 AGB stars. The position of the member stars on the V-(U-V) CMD (and their attribution to RGB or AGB sequences) is shown in Fig. 3. Note that attribution to a given evolutionary sequence of the bluest stars brighter than V16.6 is not trivial. Five stars with V16.6 are labelled as AGB stars but we cannot exclude that they are RGB stars.
7 The iron spread
We used the maximum likelihood (ML) algorithm described in Mucciarelli et al. (2012) to estimate whether the observed scatter measured in the iron abundance is compatible or not with a null intrinsic spread, taking into account the uncertainties of individual stars. Iron abundances and corresponding uncertainties are listed in Table 3 and 4 for UVES and GIRAFFE targets respectively. We checked different sub-samples of member stars.
-
1.
Total sample (117 stars): the ML algorithm provides an average value of [Fe/H]=–2.140.01 dex with an intrinsic spread of 0.020.01 dex (the observed scatter is 0.07 dex). This result suggests the presence of a small abundance spread.
-
2.
RGB stars (87 stars): the average [Fe/H] of the RGB stars only is –2.110.01 dex with an observed scatter of 0.06 dex and an intrinsic spread of 0.000.01 dex.
-
3.
AGB stars (30 stars): the average [Fe/H] of the AGB stars only is –2.200.01 dex with an intrinsic spread of 0.000.01 dex and an observed scatter of 0.07 dex. If we exclude from the AGB sample the 5 brightest AGB stars with doubtful attribution the derived abundance and intrinsic scatter do not significantly change.
-
4.
RGB stars in common with DC14 (66 stars): 66 out 88 stars in common with DC14 belong to RGB and they provide [Fe/H]=–2.120.01 dex with an intrinsic scatter of 0.000.02 dex.
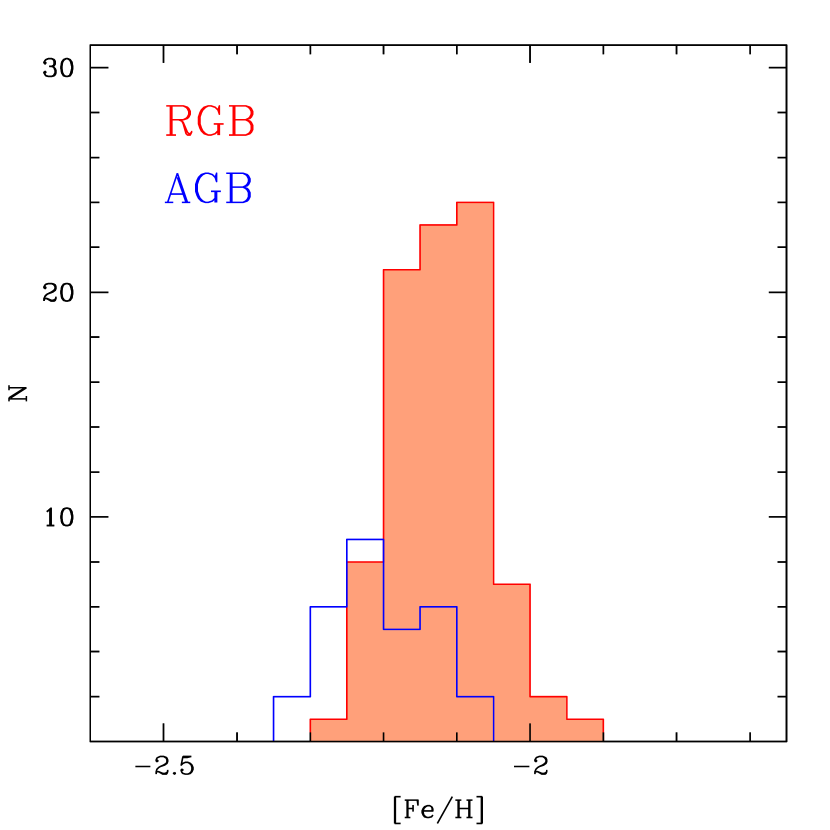
Even if the total sample seems to suggest a small (but marginally significant) iron dispersion (0.020.01 dex), when the sample of RGB and AGB stars are analyzed separately they provide a clear lack of intrinsic scatter pointing out that the cluster has an homogeneous iron content (as already pointed out by Ro16). AGB and RGB stars show a systematic difference in their [Fe/H] abundance ratios of about 0.1 dex, with the AGB stars having a lower abundance with respect to the RGB stars. Upper panel of Fig. 4 shows the [Fe/H] distribution derived for the RGB and AGB samples, red and blue histograms respectively, where the systematic offset between the two distributions is clearly visible. This finding agrees with the chemical analyses of AGB stars in other GCs (Lapenna et al., 2014, 2015; Mucciarelli et al., 2015a; Lapenna et al., 2016) that show a systematic (but still unexplained) underestimate of the [Fe/H] in AGB stars with respect to the RGB stars of the cluster when the neutral iron lines are used. This difference between the iron abundances of RGB and AGB stars explains why the entire sample of cluster member stars provides a small iron dispersion (that totally disappears when the two groups of stars are analyzed independently).
8 Light elements abundances: O, Na, Mg, Al
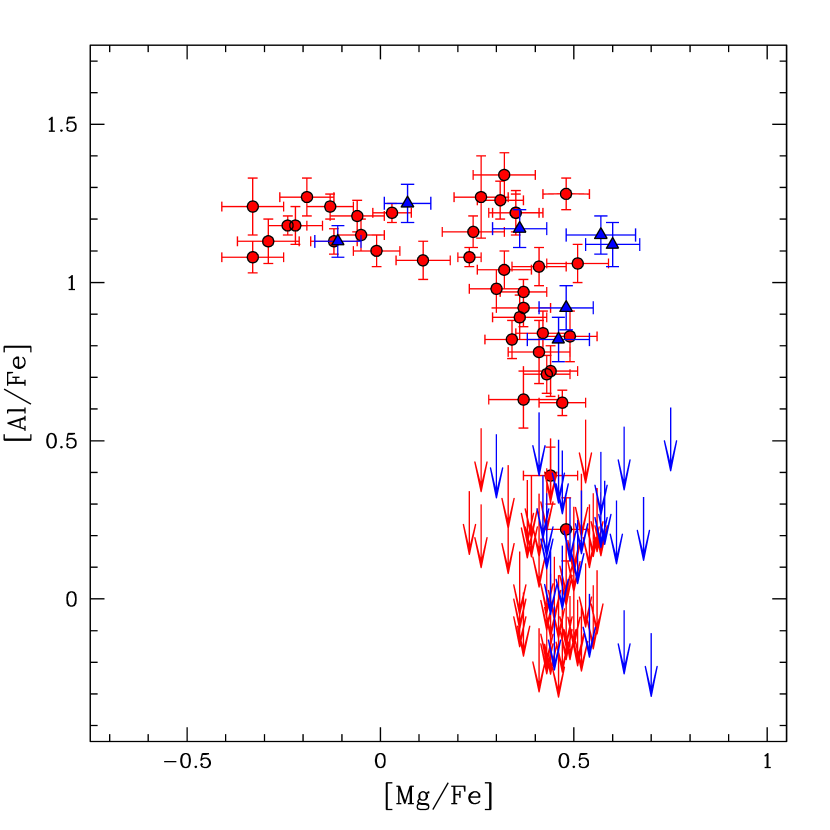
We investigated the occurrence in NGC 5824 of chemical anomalies in the abundances of O, Na, Mg and Al. As suggested by Ro16, NGC 5824 has a star-to-star dispersion in the [Mg/Fe] abundance larger than those usually observed in most of the GCs (see e.g Carretta et al., 2009c; Meszaros et al., 2015; Pancino et al., 2017). Fig. 5 shows the behavior of [Al/Fe] as a function of [Mg/Fe] as obtained from our study. Mg abundances are available for all the member stars and true measures of Al have been obtained only for 45 stars, while for the other targets upper limits are provided, due to the weakness of the Al lines. A large spread is observed both in [Mg/Fe] and [Al/Fe], with [Mg/Fe] ranging from enhanced values down to sub-solar values (the minimum abundance is –0.35 dex). On the other hand, [Al/Fe] ranges over more than 1 dex. A clear Mg-Al anticorrelation is observed, with all the stars with [Mg/Fe]+0.15 dex having [Al/Fe]+1.2 dex.
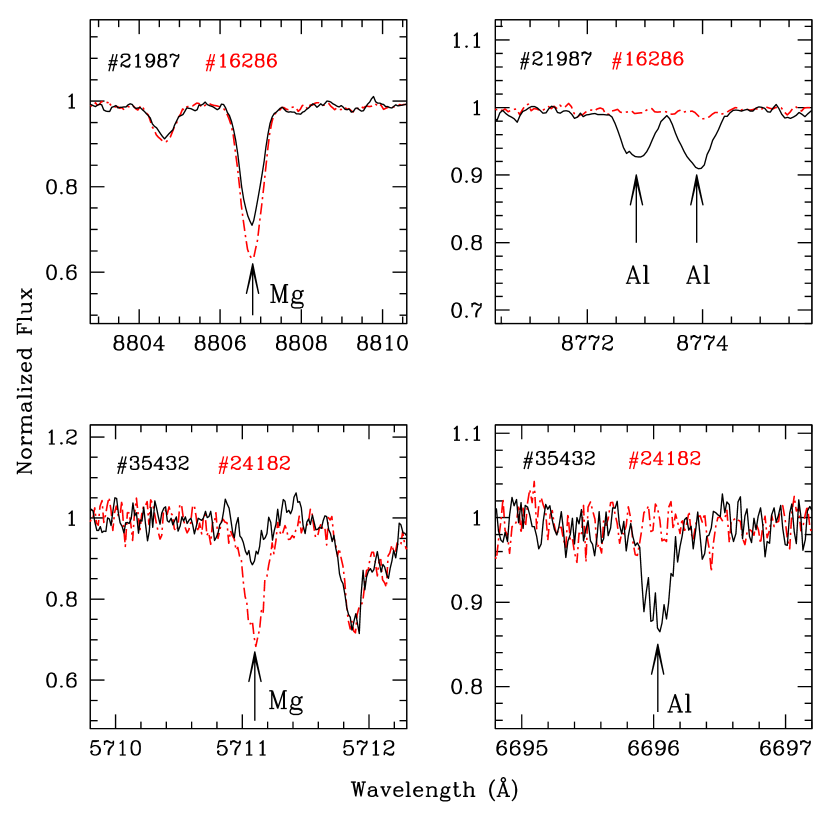
A direct evidence of this strong anticorrelation is visible in Fig. 6 where the spectra of two stars observed with GIRAFFE (namely #16286 and #21987) and of two stars observed with UVES (namely #35432 and #24182) are compared around the Mg and Al lines. The stars of each pair have been selected in order to have very similar atmospheric parameters. The star #16286 shows a prominent Mg line but a total lack of the Al lines, while for the star #21987 the situation is the opposite, with a weaker Mg line with respect the other star but well visible Al lines. The same situation is observed for the two UVES targets but using different Mg and Al features. Being the atmospheric parameters of the stars in each pair very similar, the observed different strengths in Mg and Al lines can be ascribed only to differences in abundance.
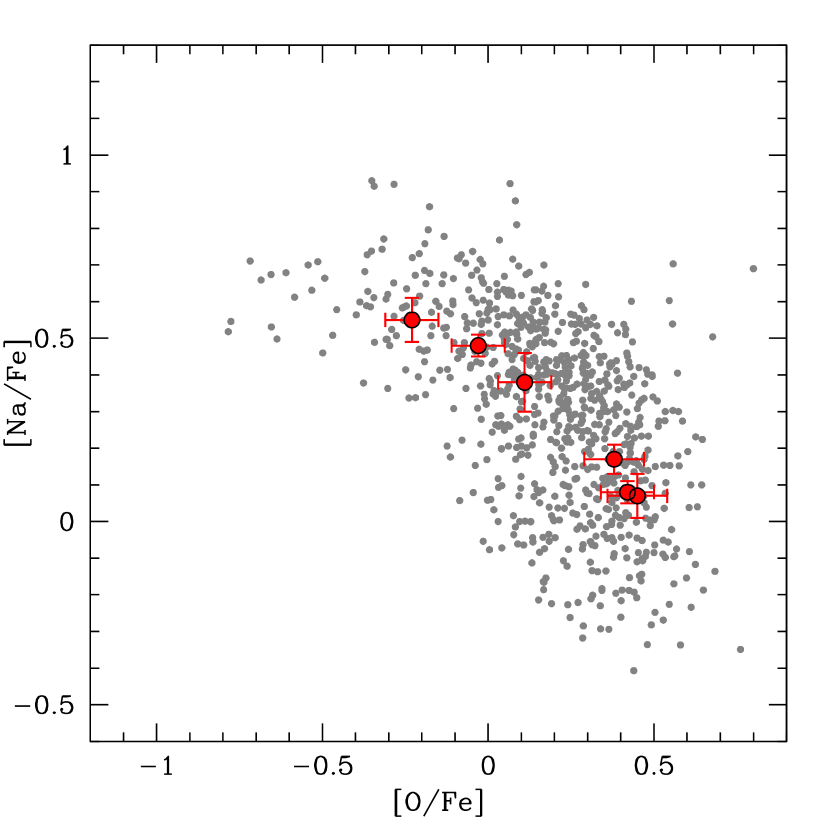
For the UVES targets we can measure also O and Na abundances. Fig. 7 shows the behavior of the [Na/Fe] abundance ratio for the six RGB stars observed with UVES as a function of [O/Fe] (red points) in comparison with the stars measured in 19 Galactic GCs by Carretta et al. (2009b, c). The six stars show a clear anti-correlation that well matches with that observed in other Galactic GCs.
9 Comparison with Da Costa et al.(2014)
The adopted GIRAFFE set-up allows to measure also the Ca II triplet lines, used by DC14 to infer an indirect estimate of the iron content of the cluster. Similar to what they did, we measured the EWs of the two strongest Ca II lines (8542 Å and 8662 Å ) for the cluster member stars, adopting a Voigt profile in order to reproduce the damped wings of these lines. [Fe/H] have been derived using the calibration provided by Saviane et al. (2012) and adopting a reference horizontal branch magnitude = 18.50 as quoted by DC14. For the stars in common with DC14 we find a mean difference in the sum of the EWs of the two Ca II lines of +0.030.01 Å (= 0.13 Å ). Such a small offset rules out the existence of any significant difference between the two studies, since a variation of 0.03 Å in the summed EW translates in a difference in [Fe/H] of about 0.01 dex.
The uncertainties in the [Fe/H] derived from Ca II triplet lines have been estimated considering three sources of errors: (i) the uncertainty in the fitting procedure of the Ca II lines, (ii) that in the continuum location, and (iii) that related to the adopted EW-[Fe/H] calibration. The first two sources have been estimated using Montecarlo simulations and analyzing samples of 500 synthetic spectra each with different SNR, and adopting the spectral resolution and pixel-size of the HR21 GIRAFFE setup. The uncertainty in the EW-[Fe/H] calibration by Saviane et al. (2012) has been estimated considering the global residual of their fit (0.13 dex) normalized to the root mean square of the number of GCs used to derive the relation. The total uncertainties range from 0.09–0.10 dex for the faintest targets to 0.04 dex for the brightest ones.
The average [Fe/H] abundance derived from the 81 RGB stars observed with GIRAFFE and for which we measured the Ca II lines strength is –1.990.01 dex with an intrinsic scatter of 0.020.01 dex, as derived adopting the ML approach. When we consider only the RGB stars in common with DC14 (60 in total) the average abundance is [Fe/H]=–1.990.01 dex with an intrinsic scatter of 0.000.01 dex.
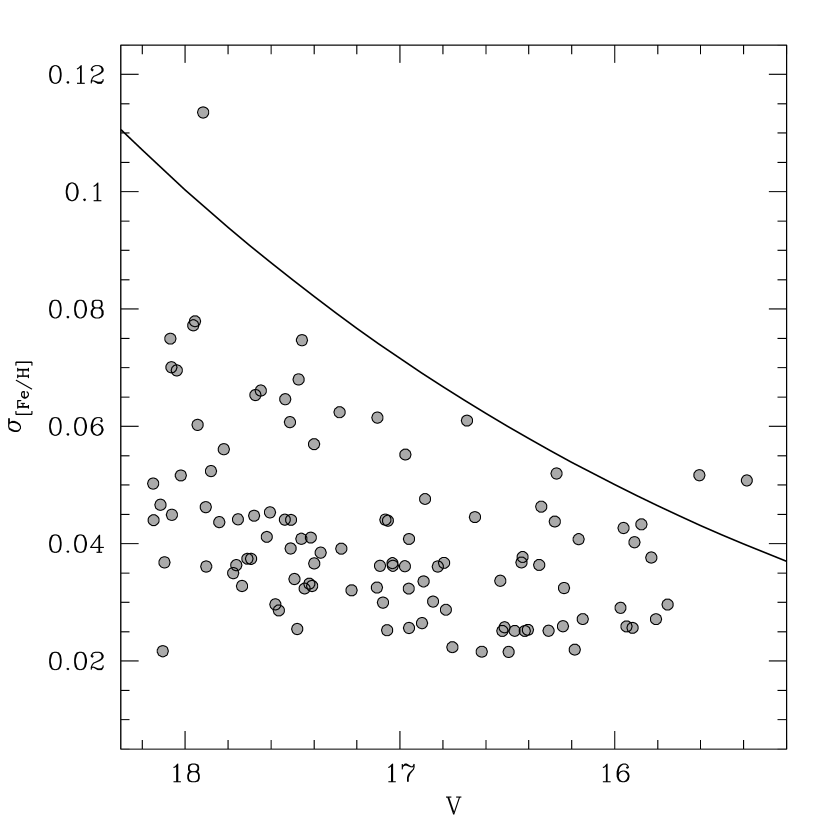
When the iron abundances of the entire sample of 108 RGB stars studied by DC14 is analyzed with the ML approach, an average abundance of –2.010.01 dex is found, with an intrinsic spread of 0.050.01 dex, suggesting a small but not negligible iron spread, at variance with the result obtained with our dataset. In this test the uncertainties in EWs quoted by DC14 have been transformed into [Fe/H] errors according to the relation by Saviane et al. (2012). The uncertainties in their [Fe/H] have been re-derived using the same procedure described above: samples of synthetic spectra with different SNR between 50 and 130 (see Fig. 11 in DC14) have been simulated, including a spectral resolution of 2500 and a pixel-size of 0.8 Å per pixel, in order to simulate spectra similar to those obtained with FORS2 by DC14. Fig. 8 shows the behavior of the abundance errors (derived from the uncertainties in EWs quoted by DC14) as a function of the V-band magnitude for the DC14 targets (grey circles). In comparison, the black line represents the uncertainties expected according to our Montecarlo simulations. On average the Montecarlo uncertainties are systematically higher than those quoted by DC14.
When the new set of errors is adopted, the ML algorithm provides an intrinsic spread of 0.010.02 dex, similar to what we obtained with the [Fe/H] derived from the Ca II triplet measured with GIRAFFE spectra, but in contrast with the result obtained with the uncertainties by DC14. This finding suggests that the small iron spread obtained by DC14 was probably due to an underestimate of the uncertainties in the Ca II lines EWs. It is worth noting that the observed scatter of the [Fe/H] distribution of the DC14 study is quite small and comparable with the scatters usually observed in GCs studied with high spectral resolution (with scatter smaller than 0.05-0.06 dex, see Carretta et al., 2009a).
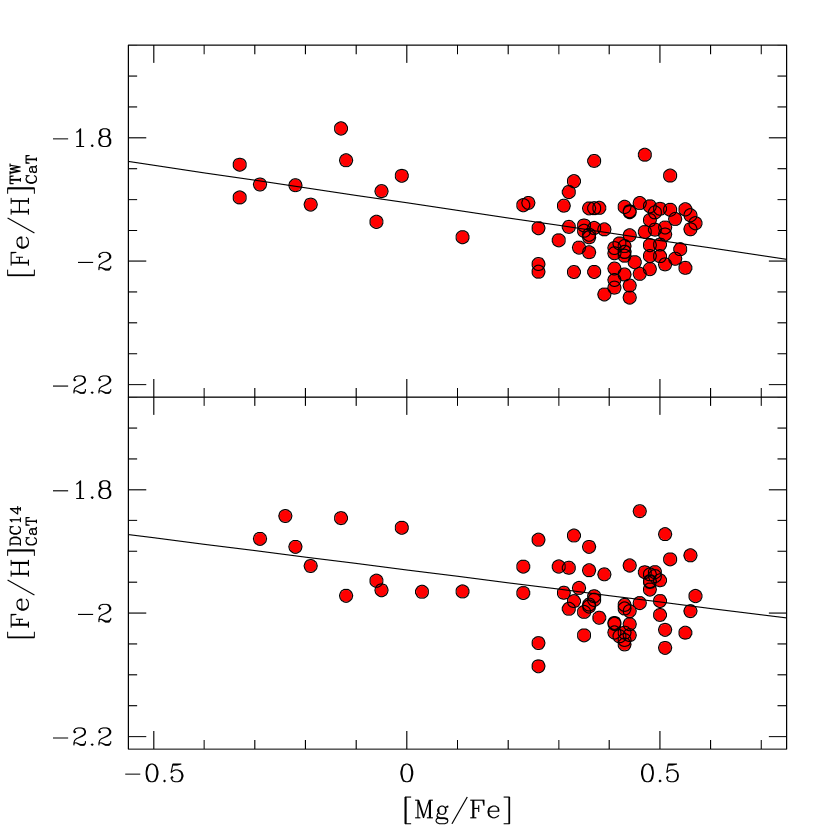
Because of the large spread in [Mg/Fe] found in NGC 5824 and not observed in most of the globulars, we check for possible correlations between the iron abundance derived from the Ca II lines and [Mg/Fe]. In fact, Mg plays a relevant role in the opacity of giant star atmospheres, being one of the most important electron donors. A significant depletion in the Mg abundances leads to a decrease of the opacity and of the electronic pressure, thus increasing the line strength of the Ca II lines (at a constant Fe and Ca abundance). This effect has been revealed for the first time in the GC NGC 2419 (Mucciarelli et al., 2012) where the unusual Mg depletion (down to [Mg/Fe]–1 dex) observed in some cluster stars leads to a significant increase of the EWs of the Ca II lines and that can be erroneously interpreted as a high Fe abundance.
Fig. 9 shows the behavior of [Fe/H] (as derived from Ca II lines) as a function of [Mg/Fe] considering RGB stars only measured from our sample (upper panel) and from that by DC14 (lower panel). Both datasets show a mild anticorrelation between [Fe/H] and [Mg/Fe] in the expected sense: the stars with low [Mg/Fe] have systematically higher [Fe/H] abundances (solid lines in Fig. 9 show the best linear fit to the data). The Spearman correlation test provides probabilities that the variables are non-correlated of 0.01 from our sample and of 0.06 from the [Fe/H] by DC14. The probability of correlation increases when the [Fe/H] inferred from the GIRAFFE spectra are used, likely due to the higher spectral resolution and SNR with respect to the dataset by DC14 (that have SNR between 50 and 120, while the spectra of this study between 70 and 250). This finding contradicts the analog test performed by Ro16 that found a low probability of correlation between their [Mg/Fe] and the [Fe/H] provided by DC14. Such a difference is likely due to the higher uncertainty of the [Mg/Fe] derived by Ro16 (the typical SNR of their spectra is 40-50) and of the [Fe/H] by DC14 with respect to this study.
The above correlation is weak and the few Mg-poor stars do not significantly contribute to change the observed scatter: when the stars with sub-solar [Mg/Fe] are excluded, the dispersion in the average [Fe/H] decreases from 0.06 down to 0.05 dex with both the datasets. However, the detection of this anticorrelation (using two independent sets of Ca II lines strengths) confirms that metallicities inferred from Ca II lines could be over-estimated in Mg-poor stars and, in general, could be biased in case of anomalous and/or exotic chemical compositions (like in NGC 2419).
10 Comparison with Roederer et al.(2016)
23 stars of our spectroscopic sample are in common with that of Ro16. When we compare the atmospheric parameters of these targets we find a significant difference in the adopted scales, with a difference (our study - Ro16) of +139 K (= 45 K). For the gravity the average difference is +0.09 (= 0.03) and for is +0.00 km s-1(= 0.26 km s-1). Ro16 estimated the atmospheric parameters with an approach similar to that followed in our analysis, deriving and log g from the photometry, but constraining spectroscopically (while we adopted the log g- calibration by Kirby et al., 2009) 666Even if we adopted the same photometric magnitudes, E(B-V), exctintion coefficients and transformation between photometric systems adopted by Ro16, we are not able to reproduce the quoted in their Table 1. We note that the only way to recover the same values is to assume a E(B-V)= 0.07 mag instead of the quoted value of E(B-V)= 0.14 mag.. The slightly lower log g found by Ro16 are compatible with the lower that they adopted. This difference in explains also the difference in the derived Fe abundances, with an average difference of +0.23 dex (= 0.07 dex). In their discussion of the metallicity of NGC 5824, Ro16 used [FeII/H] because they found a large (0.4 dex) difference between Fe abundances from neutral and single ionized lines, with [FeI/H] systematically lower than [FeII/H]. As a check, we re-analysed the stars in common with Ro16 adopting their atmospheric parameters and finding [FeI/H]=–2.290.02 dex (= 0.08 dex) and [FeII/H]=–2.070.01 dex (=0.02 dex, only for the 6 UVES stars). They attributed the observed difference between [FeI/H] and [FeII/H] to the fact that FeI lines can be less reliable diagnostics with respect to FeII lines in metal-poor giant stars (for instance due to the occurrence of non-local thermodynamical equilibrium). We think that their measured difference between the two abundance ratios is instead due to an underestimate of the adopted temperatures. This is confirmed by the re-analysis of the UVES targets using the Ro16 , that providing significant positive slopes between the iron abundance and the excitation potential, pointing out an under-estimate of . On the other hand, our photometric for the UVES stars do not require adjustment to reproduce the excitation equilibrium.
The derived [Mg/Fe] distribution is compatible with that obtained by Ro16. Ro16 found a large difference (0.4 dex) between the Mg abundances derived from two stars observed both with M2FS (using the Mg I line at 4571.1 Å ) and MIKE (where abundances are based on three optical lines), probably due to departures from local thermodynamical equilibrium that could affect that blue transition at 4571.1 Å arising from the ground level of the Mg I atom. Following the suggestion by Ro16, we increase by 0.4 dex all their abundances derived from M2FS spectra, finding an average difference for the stars in common between our and their study of +0.100.03 dex (= 0.15 dex). Despite of possible offsets between the two abundance scales, the range of [Mg/Fe] in the two studies, based on different Mg transitions, is fully compatible, confirming the large depletion of [Mg/Fe] in some stars of NGC 5824.
11 Conclusions
From the analysis of FLAMES high-resolution spectra of 117 giant stars members of the GC NGC 5824 we obtained two main results, namely (1) the lack of iron abundance spread, and (2) the detection of an extended Mg-Al anticorrelation.
The cluster has an average iron abundance of –2.110.01 dex when we consider the sample of 87 bona-fide RGB stars. This sample does not show any evidence of intrinsic spread, confirming the first claim by Ro16 (that analyzed 26 stars with V17) but based on a larger sample. According to this finding, NGC 5824 turns out to be a normal GC, not showing any evidence of internal self-enrichment in terms of iron, hence there is no reason to consider it the remnant of a complex stellar system (like a dwarf spheroidal galaxy). On the other hand it does not show any significant evidence of chemical peculiarities (as spread in s-process or C+N+O elements). In fact, although neither our dataset not that by Ro16 allowed to directly measure C and N abundances, the optical CMDs of NGC 5824 (see Sanna et al., 2014; Walker et al., 2017) did not reveal any anomalous splitting of the sub-giant branch (which has been interpreted as an evidence of an intrinsic C+N+O spread, see Piotto et al., 2012). Also, as shown by Ro16, no star-to-star variation in s-process elements is found in NGC 5824, with the only exception of one star in the Ro16’s sample that exhibits a systematic enhancement of the s-process elements. This star is present also in our sample (the UVES target #24182): we found the same enhancement of the s-process lines with respect to the other five UVES targets (no s-process transitions are available in the GIRAFFE spectra). However, this star shows an iron abundance fully compatible with the other stars, in contrast with the other anomalous GCs where the most metal-rich stars exhibit higher s-process abundances.
The present sample allows also to detect the occurrence of the standard signature of multiple populations in GCs, the Na-O anticorrelation. Additionally, we detect a very extended Mg-Al anticorrelation. At variance with the Na-O anticorrelation that is observed in all the old GCs in our Galaxy and in other galaxies of the Local Group, the Mg-Al anticorrelation turns out to be present only in a few clusters. This is likely due to the different temperatures needed to ignite the NeNa cycle (responsible for the Na-O anticorrelation, T50 MK) and the MgAl cycle (responsible for the Mg-Al anticorrelation, T70 MK).
First Carretta et al. (2009c) proposed that the spread in [Al/Fe] and the extension of the Mg-Al anticorrelation are driven by two main parameters, namely the present-day cluster mass and the metallicity. Subsequent analyses by Meszaros et al. (2015) and Pancino et al. (2017) confirmed this behavior. The spread in [Al/Fe] decreases increasing the metallicity, with the most metal-rich and low-mass GCs showing little or no [Al/Fe] spreads (see the cases of M4, Carretta et al. (2009c) and NGC 6362, Massari et al., 2017). Well-developed Mg-Al anticorrelations have been found in metal-poor GCs (NGC 4833, M15, M92) or in high-mass GCs with intermediate (NGC 6752, M13) or high metallicity (NGC 2808). Pancino et al. (2017) show that the spread in [Al/Mg] abundance ratio clearly increases with the present-day mass and decreases with metallicity. Also, Mg-poor stars (with [Mg/Fe]+0.1 dex) have been found in NGC 2419 (Mucciarelli et al., 2012; Cohen & Kirby, 2012), M54 (Carretta et al., 2010b) and in Omega Centauri (Norris & Da Costa, 1995), the most metal-poor, massive GC-like systems.
NGC 5824 well fits into this framework, being the 14th most luminous GC (according to Harris, 1996, 2010 edition) and the third most luminous GC among those with [Fe/H]–1.9 dex, after NGC 2419 and M15 (both of them showing a large [Mg/Fe] spread but homogenous [Fe/H]).
This behavior of the [Al/Fe] and [Mg/Fe] spreads with the metallicity is in principle compatible with the scenario where the main polluters are the high-mass AGB stars of the first GC stellar generation that can active the MgAl cycle during hot bottom burning. At low metallicity the AGB stars can active the hot bottom burning at lower masses (Ventura et al., 2001, 2013, 2016). On the other hand, massive GCs, even at high metallicity, have deeper potential wells and they can more efficiently retain the polluter ejecta (like in the case of NGC 2808).
We conclude that NGC 5824 is a standard globular cluster, without spread in [Fe/H] and with the presence of usual chemical anomalies (both Na-O and Mg-Al anticorrelations), but showing a large (and rare) spread in Mg.
| ID | RA | Dec | U | V | Sequence | ||
|---|---|---|---|---|---|---|---|
| (J2000) | (J2000) | (km s-1) | |||||
| 8953 | — | 226.1162748 | –33.1975713 | 18.464 | 17.032 | –24.300.10 | |
| 10222 | 62000309 | 226.0997769 | –33.1493884 | 18.503 | 17.530 | –22.100.35 | |
| 10647 | — | 226.0940622 | –33.1212687 | 17.901 | 15.773 | –33.000.25 | |
| 10967 | — | 226.0904849 | –32.9280129 | 18.218 | 15.972 | –26.700.06 | |
| 11276 | 42007983 | 226.0868524 | –33.0699666 | 18.354 | 17.224 | –28.600.12 | |
| 11730 | — | 226.0817615 | –32.9692462 | 18.085 | 16.306 | –30.300.06 | |
| 12035 | — | 226.0783242 | –33.0665547 | 18.586 | 17.645 | –28.100.03 | |
| 12077 | — | 226.0779387 | –33.0395730 | 18.033 | 16.367 | –26.300.03 | |
| 12898 | 42011701 | 226.0699481 | –33.0487649 | 19.097 | 17.890 | –29.100.14 | |
| 13068 | 42008963 | 226.0685097 | –33.0643136 | 18.780 | 17.703 | –23.800.11 | |
| 13705 | — | 226.0629148 | –33.1187793 | 18.379 | 17.165 | –28.000.06 | |
| 13793 | — | 226.0623981 | –32.9325047 | 18.411 | 16.916 | –30.400.04 | |
| 13894 | 11001198 | 226.0614866 | –33.0429962 | 18.136 | 16.463 | –23.800.06 | |
| 14000 | 62000027 | 226.0608134 | –33.1705065 | 18.363 | 16.658 | –26.800.05 |
Note. — Identification number (from Sanna et al. (2014) and from DC14), coordinates, magnitudes, atmospheric parameters, heliocentric radial velocities and evolutionary sequences for all the member stars (this table is available in its entirety in machine-readable form.)
| Wavelength | species | log gf | Instrument | |
|---|---|---|---|---|
| Å | (eV) | |||
| 4859.741 | -0.764 | 2.875 | ||
| 4882.143 | -1.640 | 3.417 | ||
| 4907.732 | -1.840 | 3.430 | ||
| 4917.230 | -1.160 | 4.191 | ||
| 4924.770 | -2.114 | 2.279 | ||
| 4938.814 | -1.077 | 2.875 | ||
| 4950.106 | -1.670 | 3.417 | ||
| 4969.917 | -0.710 | 4.217 | ||
| 4985.253 | -0.560 | 3.929 | ||
| 4985.547 | -1.331 | 2.865 | ||
| 4993.358 | -3.620 | 2.807 | ||
| 5001.863 | -0.010 | 3.882 | ||
| 5002.793 | -1.530 | 3.396 | ||
| 5014.942 | -0.303 | 3.943 |
Note. — This table is available in its entirety in machine-readable form.
| ID | log g | [Fe/H] | [O/Fe] | [Na/Fe] | [Mg/Fe] | [Al/Fe] | ||
|---|---|---|---|---|---|---|---|---|
| (K) | (km s-1) | (dex) | (dex) | (dex) | (dex) | (dex) | ||
| 20836 | 4270 | 0.77 | 2.0 | –2.070.06 | –1.990.08 | 0.080.03 | 0.480.08 | 0.21 |
| 24182 | 4252 | 0.83 | 1.9 | –2.160.06 | –1.930.09 | 0.090.04 | 0.500.02 | 0.28 |
| 26034 | 4238 | 0.69 | 2.0 | –2.140.06 | –2.000.08 | 0.080.08 | 0.230.03 | 1.080.03 |
| 27416 | 4344 | 0.90 | 1.9 | –2.140.06 | –2.010.09 | 0.090.06 | 0.380.03 | 0.33 |
| 31793 | 4313 | 0.88 | 1.9 | –2.150.06 | –1.960.08 | 0.080.03 | 0.030.05 | 1.220.03 |
| 35432 | 4239 | 0.78 | 2.0 | –2.170.06 | –1.950.08 | 0.080.06 | –0.240.05 | 1.180.03 |
Note. —
| ID | log g | [Fe/H] | [Mg/Fe] | [Al/Fe] | ||
|---|---|---|---|---|---|---|
| (K) | (km s-1) | (dex) | (dex) | (dex) | ||
| 8953 | 4578 | 1.4 | 1.8 | –2.130.08 | 0.370.07 | 0.02 |
| 10222 | 4955 | 1.7 | 1.7 | –2.140.07 | 0.510.10 | 0.25 |
| 10647 | 4265 | 0.7 | 2.0 | –2.060.07 | 0.520.06 | –0.03 |
| 10967 | 4220 | 0.7 | 2.0 | –2.150.05 | 0.470.06 | 0.620.04 |
| 11276 | 4787 | 1.5 | 1.8 | –2.200.07 | 0.680.08 | 0.32 |
| 11730 | 4382 | 1.0 | 1.9 | –2.200.06 | 0.410.06 | –0.09 |
| 12035 | 4981 | 1.8 | 1.7 | –2.250.07 | 0.460.10 | 0.50 |
| 12077 | 4415 | 1.0 | 1.9 | –2.290.07 | 0.070.06 | 1.250.06 |
| 12898 | 4747 | 1.8 | 1.7 | –1.980.07 | 0.330.08 | 0.42 |
| 13068 | 4846 | 1.8 | 1.7 | –2.100.07 | 0.260.09 | 0.54 |
| 13705 | 4707 | 1.5 | 2.1 | –2.300.06 | 0.490.07 | 0.32 |
| 13793 | 4532 | 1.3 | 1.8 | –2.140.07 | 0.480.07 | 0.01 |
| 13894 | 4420 | 1.1 | 1.9 | –2.160.07 | 0.510.06 | –0.01 |
| 14000 | 4408 | 1.1 | 1.9 | –2.180.07 | 0.310.06 | 1.260.06 |
Note. — This table is available in its entirety in machine-readable form.
References
- Alonso, Arribas & Martinez-Roger (1999) Alonso, A., Arribas, S., & Martinez-Roger, C., 1999, A&As, 140, 261
- Alonso, Arribas & Martinez-Roger (2001) Alonso, A., Arribas, S., & Martinez-Roger, C., 2001, A&As, 376, 1039
- Bastian & Lardo (2015) Bastian, N., & Lardo, C., 2015, MNRAS, 453, 357
- Bellazzini et al. (2008) Bellazzini, M., Ibata, R. A., Chapman, S. C., Mackey, A. D., Monaco, L., Irwin, M. J., Martin, N. F., Lewis, G. F., & Dalessandro, E., 2008, AJ, 136, 1147
- Bekki & Freeman (2003) Bekki, K., & Freeman, K. C., 2003, MNRAS, 346, L11
- Brown, Wallerstein & Gonzalez (1999) Brown, J. A., Wallerstein, G., & Gonzalez, G., 1999, AJ, 118, 1245
- Cayrel (1988) Cayrel, R., 1988, in IAU Symposium, Vo. 132, The Impact of very high S/N spectroscopy on stellar physics, ed. G. Cayrel de Strobel & M. Spite, 345
- Caffau et al. (2011) Caffau, E., Ludwig, H.-G., Steffen, M., Freytag, B., & Bonifacio, P., 2011, SoPh, 268, 255
- Carretta et al. (2009a) Carretta, E., Bragaglia, A., Gratton, R., D’Orazi, V., & Lucatello, S., 2009, A&A, 508, 695
- Carretta et al. (2009c) Carretta, E., Bragaglia, A., Gratton, R., & Lucatello, S., 2009, A&A, 505, 139
- Carretta et al. (2009b) Carretta, E., Bragaglia, A., Gratton, R., et al., 2009, A&A, 505, 117
- Carretta et al. (2010a) Carretta, E., Bragaglia, A., Gratton, R. G., Lucatello, S., Bellazzini, M., Catanzaro, G., Leone, F. , Momany, Y., Piotto, G., & D’Orazi, V., 2010, ApJ, 714L, 7
- Carretta et al. (2010b) Carretta, E., Bragaglia, A., Gratton, R. G., Lucatello, S., Bellazzini, M., Catanzaro, G., Leone, F. , Momany, Y., Piotto, G., & D’Orazi, V., 2010, A&A, 520, 95
- Carretta et al. (2014) Carretta, E., Bragaglia, A., Gratton, R. G., D’Orazi, V., Lucatello, S., & Sollima, A., 2014, A&A, 561, 87
- Castelli & Kurucz (2004) Castelli, F., & Kurucz, R. L., 2004, astro.ph-5087
- Castelli (2005) Castelli, F., 2005, MSAIS, 8, 44
- Cohen & Kirby (2012) Cohen, J. G., & Kirby, E. N., 2012, ApJ, 760, 86
- Da Costa, Held & Saviane (2014) Da Costa, G. S., Held, E. V., & Saviane, I., 2014, MNRAS, 438, 3507
- Dekker et al. (2000) Dekker, H., D’Odorico, S., Kaufer, A., Delabre, B., & Kotzlowski, H., 2000, SPIE, 4008, 534
- Ferraro et al. (1999) Ferraro, F. R., Messineo, M., Fusi Pecci, F., de Palo, M. A., Straniero, O., Chieffi, A., & Limongi, M., 1999, AJ, 118, 1738
- Ferraro et al. (2009) Ferraro, F. R., Dalessandro, E., Mucciarelli, A., Beccari, G., Rich, R. M., Origlia, L., Lanzoni, B., Rood, R. T., Valenti, E., Bellazzini, M., Ransom, S. M., & Cocozza, G., 2009, Nature, 462, 483
- Ferraro et al. (2016) Ferraro, F. R., Massari, D., Dalessandro, E., Lanzoni, B., Origlia, L., Rich, R. M., & Mucciarelli, A., 2016, ApJ, 828, 75
- Gratton et al. (1999) Gratton, R. G., Carretta, E., Eirksson, K. & Gustafsson, B., 1999, A&A, 350, 1065
- Grevesse & Sauval (1998) Grevesse, N., & Sauval, A. J., 1998, SSR, 85, 161
- Harris (1996, 2010 edition) Harris, W.E. 1996, AJ, 112, 1487
- Johnson & Pilachowski (2010) Johnson, C. I., & Pilachowski, C. A., 2010, ApJ, 722, 1373
- Johnson et al. (2016) Johnson, C. I., Caldwell, N., Rich, R. M., Pilachowski, C. A., & Hsyu, T., 2016, AJ, 152, 21
- Kirby et al. (2009) Kirby, E. N., Guhathakurta, P., Bolte, M., Sneden, C., & Geha, M., 2009, ApJ, 705, 328
- Ibata et al. (2011) Ibata, R. Sollima, A., Nipoti, C. Bellazzini, M., Chapman, S. C. & Dalessandro, E., 2011, ApJ, 738, 186
- Lapenna et al. (2014) Lapenna, E., Mucciarelli, A., Lanzoni, B., Ferraro, F. R., Dalessandro, E., Origlia, L., & Masari, D., 2014, ApJ, 797, 124
- Lapenna et al. (2015) Lapenna, E., Mucciarelli, A., Ferraro, F. R., Origlia, L., Lanzoni, B., Massari, D., & Dalessandro, E., 2015, ApJ, 813, 97
- Lapenna et al. (2016) Lapenna, E., Lardo, C., Mucciarelli, A., Salaris, M., Ferraro, F. R., Lanzoni, B., Massari, D., Stetson, P. B., Cassisi, S., & Savino, A., 2016, ApJ, 826L, 1
- Lardo, Mucciarelli & Bastian (2016) Lardo, C., Mucciarelli, A., & Bastian, N., 2016, MNRAS, 457, 51
- Marino et al. (2009) Marino, A. F., Milone, A. P., Piotto, G., Villanova, S., Bedin, L. R., Bellini, A., & Renzini, A., 2009, A&A, 505, 1099
- Marino et al. (2011a) Marino, A. F. et al., 2011, ApJ, 731, 64
- Marino et al. (2011b) Marino, A. F. et al., 2011, A&A, 532, 8
- Marino et al. (2015) Marino, A. F. et al., 2015, MNRAS, 450, 815
- Massari et al. (2014) Massari, D., Mucciarelli, A., Ferraro, F. R., Origlia, L., Rich, R. M., Lanzoni, B., Dalessandro, E., Valenti, E., Ibata, R., Lovisi, L., Bellazzini, M., & Reitzel, D., 2014, ApJ, 795, 22
- Massari et al. (2017) Massari, D., Mucciarelli, A., Dalessandro, E., Bellazzini, M., Cassisi, S., Fiorentino, G., Ibata, R. A., Lardo, C., & Salaris, M., 2017, MNRAS, 468, 1249
- McCall (2004) McCall, M. L., 2004, AJ, 128, 2144
- Meszaros et al. (2015) Meszaros, S. et al., 2015, AJ, 149, 153
- Mucciarelli et al. (2012) Mucciarelli, A., Bellazzini, M., Ibata, R., Merle, T., Chapman, S. C, Dalessandro, E., & Sollima, A., 2012, MNRAS, 426, 2889
- Mucciarelli et al. (2013a) Mucciarelli, A., Pancino, E., Lovisi, L., Ferraro, F. R., & Lapenna, E., 2013, ApJ, 766, 78
- Mucciarelli (2013) Mucciarelli, A., 2013, arXiv1311.1403
- Mucciarelli et al. (2015a) Mucciarelli, A., Lapenna, E., Massari, D., Ferraro, F. R. & Lanzoni, B., 2015, ApJ, 801, 69
- Mucciarelli et al. (2015b) Mucciarelli, A., Lapenna, E., Massari, D., Pancino, E., Stetson, P. B., Ferraro, F. R., Lanzoni, B., & Lardo, C., 2015, ApJ, 809, 128
- Mucciarelli et al. (2017a) Mucciarelli, A., Bellazzini, M., Ibata, R., Romano, D., Chapman, S. C., & Monaco, L., 2017, A&A, 605, 46
- Mucciarelli et al. (2017b) Mucciarelli, A., Monaco, L., Bonifacio, P. & Saviane, I., 2017, A&A, 603, L7
- Norris & Da Costa (1995) Norris, J. E., & Da Costa, G. S., 1995, ApJ, 447, 680
- Origlia et al. (2003) Origlia, L., Ferraro, F. R., Bellazzini, M., & Pancino, E., 2003, ApJ, 591, 916
- Origlia et al. (2011) Origlia, L., Rich, R. M., Ferraro, F. R., Lanzoni, B., Bellazzini, M., Dalessandro, E., Mucciarelli, A., Valenti, E., & Beccari, G., 2011, ApJ, 726L, 20
- Origlia et al. (2013) Origlia, L., Massari, D., Rich, R. M., Mucciarelli, A., Ferraro, F. R., Dalessandro, E., & Lanzoni, B., 2013, ApJ, 779L, 5
- Pancino et al. (2011) Pancino, E., Mucciarelli, A., Sbordone, L., Bellazzini, M., Pasquini, L., Monaco, L. & Ferraro, F. R., 2011, A&A, 527, 18
- Pancino et al. (2017) Pancino, E., et al., 2017, A&A, 601, 112
- Pasquini et al. (2000) Pasquini, L., et al., 2000, SPIE, 4008, 129
- Pietrinferni et al. (2006) Pietrinferni, A., Cassisi, S., Salaris, M., & Castelli, F., 2006, ApJ, 642, 797
- Piotto et al. (2012) Piotto, G., Milone, A. P., Anderson, J., Bedin, L. R., Bellini, A., Cassisi, S., Marino, A. F., Aparicio, A. & Nascimbeni, V., 2012, ApJ, 760, 39
- Renzini et al. (2015) Renzini, A., D’Antona, F., Cassisi, S., et al., 2015, MNRAS, 454, 4197
- Roederer et al. (2016) Roederer, I. U., Mateo, M., Bailey, J. I., Spencer, M., Crane, J. D., & Schectman, S. A., 2016, MNRAS, 455, 2417
- Sanna et al. (2014) Sanna, N., Dalessandro, E., Ferraro, F. R., Lanzoni, B., Miocchi, P., & O’Connell, R. W., 2014, ApJ, 780, 90
- Saviane et al. (2012) Saviane, I., da Costa, G. S., Held, E. V., Sommariva, V., Gullieuszik, M., Barbuy, B., & Ortolani, S., 2012, A&A, 540, 27
- Sbordone et al. (2004) Sbordone, L., Bonifacio, P., Castelli, F., & Kurucz, R. L., 2004, MSAIS, 5, 93
- Simmerer et al. (2013) Simmerer, J., Ivans, I. I., Filler, D., Francois, P., Charbonnel, C., Monier, R., & James, G., 2013, ApJ, 764L, 7
- Stetson & Pancino (2008) Stetson, P. B., & Pancino, E., 2008, PASP, 120, 1332
- Venn et al. (2004) Venn K. A., Irwin, M., Shetrone, M. D., Tout, C. A., Hill, V., & Tolstoy, E., 2004, AJ, 128, 1177
- Ventura et al. (2001) Ventura, P., D’Antona, F., Mazzitelli, I., & Gratton, R. G., 2011, ApJL, 550, L65
- Ventura et al. (2013) Ventura, P., Di Criscienzo, M., Carini, R., & D’Antona, F., 2013, MNRAS, 431, 3642
- Ventura et al. (2016) Ventura, P., Garcia-Hernandez, D. A., Dell’Agli, F., D’Antona, F., Meszaros, Sz., Lucatello, S., Di Criscienzo, M., Shetrone, M., Tailo, M., Tang, B., & Zamora, O., 2016, ApJ, 831, 17
- Villanova et al. (2013) Villanova, S., Geisler, D., Carraro, G., Moni Bidin, C., & Munoz, C., 2013, ApJ, 778, 186
- Yong et al. (2014) Yong, D., Roederer, I., U., Grundahl, F., Da Costa, G. S., Karakas, A. I., Norris, J. E., Aoki, W., Fishlock, C. K., Marino, A. F., Milone, A. P. & Shingles, L. J., 2014, MNRAS, 441, 3396
- Walker et al. (2017) Walker, A. R., Andreuzzi, G., Martinez-Vasquez, C. E., Kuner, A. M., Stetson, P. B., Cassisi, S., Monelli, M., Bono, G., Dall’Ora, M., & Vivas, A. K., 2017, AJ, 154, 8
- Willman & Strader (2012) Willman, B., & Strader, J., 2012, AJ, 144, 76