Optical conductivity of the Weyl semimetal NbP
Abstract
The optical properties of (001)-oriented NbP single crystals have been studied in a wide spectral range from 6 meV to 3 eV from room temperature down to 10 K. The itinerant carriers lead to a Drude-like contribution to the optical response; we can further identify two pronounced phonon modes and interband transitions starting already at rather low frequencies. By comparing our experimental findings to the calculated interband optical conductivity, we can assign the features observed in the measured conductivity to certain interband transitions. In particular, we find that transitions between the electronic bands spilt by spin-orbit coupling dominate the interband conductivity of NbP below 100 meV. At low temperatures, the momentum-relaxing scattering rate of the itinerant carriers in NbP is very small, leading to macroscopic characteristic length scales of the momentum relaxation of approximately 0.5 m.
I Introduction
NbP is a nonmagnetic non-centrosymmetric Weyl semimetal (WSM) with extremely large magnetoresistance and ultrahigh carrier mobility Shekhar2015 ; Wang2016 . These extraordinary transport properties are believed to be caused by quasiparticles in chiral Weyl bands. According to band-structure calculations NbP possesses 24 Weyl nodes, i.e. twelve pairs of the nodes with opposite chiralities Huang2014 ; Weng2015 ; Sun2015 ; Lee2015 . The nodes are “leftovers” of nodal rings, which are gapped by spin-orbit coupling (SOC) everywhere in the Brillouin zone (BZ), except of these special points Huang2014 ; Weng2015 ; Lee2015 ; Ahn2015 . The nodes can be divided in two groups, commonly dubbed as W1 (8 nodes) and W2 (16 nodes). Most recent band-structure calculations agree well on the energy position of the W1 nodes: 56 - 57 meV below the Fermi level Klotz2016 ; Wu2017 ; Grassano2018 ; the position of the W2 nodes is specified less accurately, ranging from 5 Klotz2016 ; Wu2017 to 26 meV Grassano2018 above . Furthermore, the W2 cones could be strongly tilted along a low-symmetric direction in BZ Wu2017 , realizing thus a type-II WSM state Soluyanov2015 .
The free-carrier dynamics of NbP has attracted considerable attention due to the possibility of hydrodynamic election behavior. Recently, a so-called axial-gravitational anomaly, relevant in the hydrodynamic regime Lucas2016 , was reported in NbP Gooth2017NbP . In turn, studying the hydrodynamic behavior of electrons is very interesting because the conduction of viscous electron fluids can be extremely high, exceeding the fundamental ballistic limit Gurzhi1963 ; Gurzhi1968 ; Guo2017 . Dirac materials with highly mobile electrons are prime candidates for realizing this super-ballistic conductivity. It was recently reported that electrons flow in a hydrodynamic fashion in clean samples of graphene Bandurin2016 ; Crossno2016 and WP2 Gooth2017WP2 ; and the higher-than-ballistic conduction was found through graphene constrictions Kumar2017 .
Similar to all WSM, the physical properties of NbP are determined by their low-energy electron dynamics, including both, free-carrier response and interband transitions Wehling2014 . Infrared optical methods enable direct access to this dynamics. For example, the interband optical response of a single isotropic three-dimensional Weyl band, being expressed in terms of the real part of the complex conductivity, should follow a linear frequency dependence with the pre-factor given by the band Fermi velocity Hosur2012 ; Bacsi2013 ; Ashby2014 :
| (1) |
Here, electron-hole symmetry is assumed, and the complex conductivity is , with the real part of the dielectric function. For identical Weyl bands, the right side of Eq. (1) should be multiplied by . Such a linear behavior of the optical conductivity () has indeed been observed in a number of well-established and proposed three-dimensional Weyl/Dirac-semimetal systems Timusk2013 ; Chen2015 ; Sushkov2015 ; Xu2016 ; Neubauer2016 ; Ueda2016 ; Kimura2017 ; Huett2018 .
In the hydrodynamic regime, the rates for momentum-relaxing scattering and momentum-conserving scattering of the itinerant carriers differ appreciably: Gurzhi1963 ; Gurzhi1968 ; Scaffidi2017 ; Lucas2017 . The momentum-relaxing scattering manifests itself in the optical-conductivity spectra Dressel2002 , thus one can directly determine the corresponding scattering time from .
For this paper, we have measured and analyzed both, interband and itinerant-carrier, conductivity of NbP. We show that the low-energy interband conductivity of NbP is dominated by transitions between the bands with parallel dispersions that are split by spin-orbit coupling. These excitations, as well as the Drude response of the itinerant carriers, completely mask the linear-in-frequency due to the three-dimensional chiral Weyl bands. At somewhat higher frequencies (1400 - 2000 cm-1, 175 - 250 meV), becomes roughly linear. Our calculations demonstrate that this linearity stems from the fact that all electronic bands, which are involved in the transitions with relevant energies, are roughly linear. In addition, we find that at low temperatures the itinerant carriers in at least one of the conduction channels possess an extremely long momentum-relaxing scattering time; the characteristic length scale of momentum relaxation, , is then basically macroscopic, supporting that the hydrodynamic regime can be realized in NbP.
II Samples Preparation, Experimental and Computational Details
Single crystals of NbP were synthesized according to the description reported in Refs. Martin1990 ; Shekhar2015 : a polycrystalline NbP powder was synthesized in a direct reaction of pure niobium and red phosphorus; the single NbP crystals were grown from the powder via vapor-transport reaction with iodine.
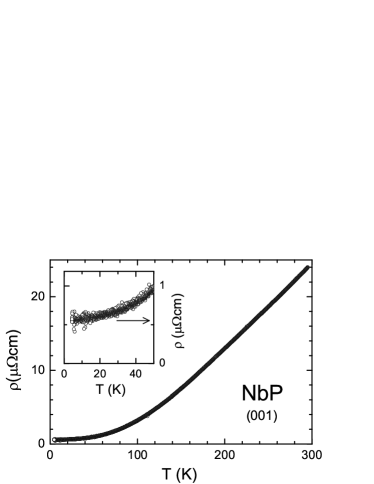
The electrical resistivity, , was measured as a function of temperature within the (001)-plane in four-contact geometry. The experiments were performed on a small piece, cut from the specimen used for the optical investigations. The results of the dc measurements are plotted in Fig. 1. A clear metallic behavior with linear-in-temperature resistivity is observed down to approximately 100 K. Below, levels off and approaches the residual resistivity = cm; the resistivity ratio is ( K)/. These values are well comparable with the ones reported in literature Shekhar2015 ; Wang2016 ; Zhang2015 ; Wang2015c . Note, NbP exhibits an extremely high mobility independent on the residual resistivity ratio Wang2015c .
The normal-incidence optical reflectivity was measured on the (001)-surfaces of a large ( in lateral dimensions) single crystal from room temperature down to K covering a wide frequency range from to 12 000 cm-1. The temperature-dependent experiments were supplemented by room-temperature reflectivity measurements up to 25 000 cm-1. In the far-infrared spectral range below 700 cm-1, a Bruker IFS 113v Fourier-transform spectrometer was employed with in situ gold coating of the sample surface for reference measurements. At higher frequencies, we used a Bruker Hyperion infrared microscope attached to a Bruker Vertex 80v spectrometer. Here, freshly evaporated gold mirrors (below 12 000 cm-1) and protected silver (above 12 000 cm-1) served as reference.
For the Kramers-Kronig analysis Dressel2002 we involved the x-ray atomic scattering functions for high-frequency extrapolations Tanner2015 . From recent optical investigations of materials with highly mobile carriers, it is known Schilling2017Yb ; Schilling2017Zr that the commonly applied Hagen-Rubens extrapolation to zero frequency is not adequate: the very narrow zero-frequency component present in the spectra corresponds to a scattering rate comparable to (or even below) our lowest measurement frequency, cm-1. Thus, we first fitted the spectra with a set of Lorentzians (similar fitting procedures can be utilized as a substitute of the Kramers-Kronig analysis Kuzmenko2005 ; Chanda2014 ) and then we used the results of these fits between and as zero-frequency extrapolations for subsequent Kramers-Kronig transformations. We note that our optical measurements probe the bulk material properties, as the penetration depth exceeds 20 nm for any measurement frequency.
We performed band structure calculations within the local density approximation (LDA) based on the crystal structure of NbP determined by experiments Xu et al. (1996); we employed the linear muffin-tin orbital method Andersen (1975) as implemented in the relativistic PY LMTO computer code. Some details of the implementation can be found in Ref. Antonov et al., 2004. The Perdew-Wang parametrization Perdew and Wang (1992) was used for the exchange-correlation potential. SOC was added to the LMTO Hamiltonian in the variational step. BZ integrations were done using the improved tetrahedron method Blöchl et al. (1994). Dipole matrix elements for interband optical transitions were calculated on a -mesh using LMTO wave functions. As was shown in Ref. Chaudhuri2017, , it is necessary to use sufficiently dense meshes in order to resolve transitions between the SOC-split bands. The real part of the optical conductivity was calculated by the tetrahedron method.
III Results and Analysis
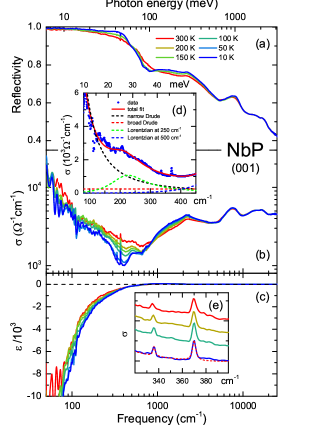
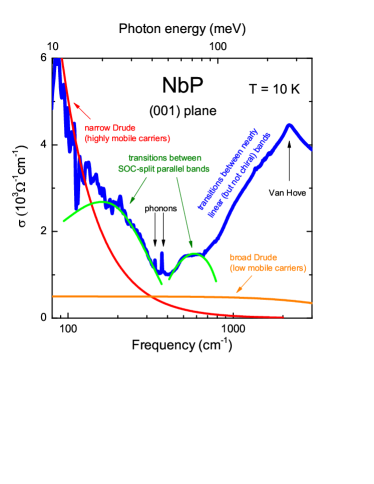
Fig. 2 displays the overall reflectivity , the real part of the conductivity , and the dielectric constant of NbP for different temperatures. For frequencies higher than 5000 cm-1, the optical properties are basically independent on temperature. In the spectra we can identify the signatures of: (i) phonons, (ii) itinerant-carrier (intraband) absorption, and (iii) interband transitions. Below we discus these spectral features separately.
in TaAs, for example, such a Fano resonance reportedly signals a strong coupling between phonons and electronic transitions [50]).
III.1 Phonons
In the far-infrared range, two sharp phonon peaks can be seen in Fig. 2 at 336 and 370 cm-1. Due to their symmetric shape, they can be nicely fitted with Lorentzians, as demonstrated in panel (e). This is in contrast to the Fano-shape phonon resonances observed in TaAs, where the asymmetric line shape reportedly signals a strong coupling between phonons and electronic transitions FanoTaAs . In NbP, four infrared-active phonons are expected Chang2016 ; however, there is no full consensus on the calculated frequencies Chang2016 ; Liu2016 . The phonon positions observed in our spectra agree very well with the calculations from Ref. Liu2016 as well as with the Raman data presented there (in non-centrosymmetric structures, same phonon modes can be both, infrared and Raman, active). Thus, following Ref. Liu2016 , we assign the observed features at 336 and 370 cm-1 to those lattice vibrations that mainly involve the light P atoms. The other two infrared-active phonon modes are apparently too weak to be resolved on the electronic background.
III.2 Itinerant charge carriers
At the lowest frequencies, NbP exhibits an optical response typical for metals, i.e. the itinerant carriers dominate: the reflectivity approaches unity, is negative and diverges as , exhibits a narrow zero-frequency peak, as seen in Fig. 2 (a-c). Panel (d) clearly shows a shoulder on this peak that can be fitted by a Lorentzian; it will be discussed in the next section.
For fitting the optical spectra at our lowest frequencies, we use the measured dc-conductivity values as the zero-frequency limit of the Drude term Dressel2002 , and we allow both, the plasma frequency and the scattering rate, to vary freely. The best fit to the data is then obtained with a momentum-relaxing scattering rate, , as low as 4.5 cm-1 at K. Thus, ps and the momentum-relaxation length, , becomes as long as 0.2 to 0.6 m. Here we utilized the lower, m/s, and, respectively, the upper, m/s, boundaries for the (001)-plane Fermi velocity obtained from experiment Shekhar2015 ; Wang2016 and theory Lee2015 ; Ahn2015 . At elevated temperatures, rises, reaching 35 cm-1 at K. This corresponds to of 20 to 70 nm.
Since the typical sample size for ballistic transport measurements is around 0.1 to 1 m Kumar2017 ; Datta1995 , one can actually realize ballistic conduction in NbP at low temperatures. For the hydrodynamic electron behavior discussed in the introduction, the energy-relaxing momentum-conserving electron-electron scattering must happen on time scales shorter than Gurzhi1963 ; Gurzhi1968 ; Scaffidi2017 ; Lucas2017 . Because the found is rather large, the hydrodynamic behavior and, eventually, the super-ballistic electron flows may be possible in NbP.
Less mobile carriers from parabolic bands Shekhar2015 ; Sun2015 ; Ahn2015 ; Klotz2016 ; Wu2017 , however, can obscure the observation of this behavior. Thus, a proper adjustment of the Fermi level is crucial, as can be achieved, e.g., by Gd doping Niemann2017 . Fingerprints of these low-mobility carriers can be identified in the optical conductivity of undoped NbP as another, very broad and relatively weak, Drude band. Such two-channel optical conductivity has been recently observed, for instance, in YbPtBi Schilling2017Yb . In the case of NbP, this broad Drude term is present in the far-infrared spectral range as a basically frequency-independent pedestal in , clearly seen in Fig. 2(d).
III.3 Interband transitions: optical experiments and calculations based on the electronic band structure
Calculations of the interband optical conductivity based on calculated electronic band structure are very useful, but seem to be rather challenging in (topological) semimetals. A survey of the available literature reveals only a qualitative match between the calculated optical conductivity and experimental results Grassano2018 ; Kimura2017 ; Frenzel2017 ; Chaudhuri2017 . In the most interesting low-energy part of the spectrum (less than a few hundred meV), a reasonable agreement is particularly hard to achieve Kimura2017 ; Chaudhuri2017 . In the case of NbP, we reach a fairly good qualitative match between our calculations of the optical conductivity and experimental spectra even at low energies; this allows us to identify the origin of various spectral features observed in .
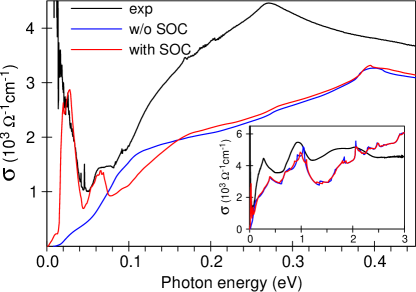
In Fig. 3 we compare the experimental low-temperature optical conductivity to the interband (001)-plane conductivity calculated with and without SOC. Note, that the itinerant-carriers contributions have not been subtracted from the experimental conductivity. The calculated spectra qualitatively agree with the experiment: the inset in Fig. 3 illustrates that the peaks and deeps in the calculated reasonably coincide with those in the experimental data. The calculated spectra contain more fine structures than the experimental , as no broadening was applied to the computed spectra in order to simulate finite life-time effects. The experimental in general falls above the calculated interband conductivity. Partly, this can be due to the broad Drude contribution present in the experimental spectra.
Above an energy of 0.2 eV, the effect of SOC on the theoretical is negligible; but for smaller energies the spectra computed with and without taking SOC into account differ significantly. The interband contribution to the conductivity calculated without SOC increases smoothly when raising the photon energy to 0.1 eV. When SOC is included, however, two sharp peaks appear around 30 and 65 meV (corresponding to and 500 cm-1). The latter matches very well the shoulder we observed on the narrow Drude term, as shown in Fig. 2(d). The former feature can be directly associated with the bump observed at all temperatures at around 500 cm-1 in the measured spectra plotted in Fig. 2(b). The fact that these two peaks appear only in those calculations including SOC indicates that they must be related to the transitions between the SOC-split bands.
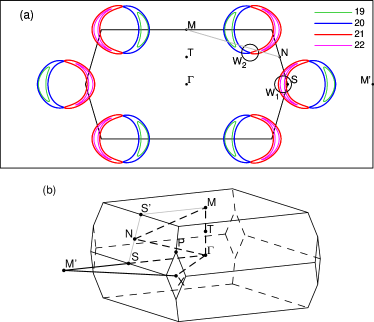
Our conclusion gets support when decomposing the calculated into contributions coming from transitions between different pairs of bands crossing . When SOC is neglected, two doubly degenerate bands with predominant Nb character cross on a mirror plane and form one electron and one hole Fermi surface with crescent-shaped cross sections by this plane Lee2015 . This degeneracy is lifted when SOC is accounted for; thus, four non-degenerate bands, numbered 19 to 22, now cross as shown in Figs. 4 and 5 (at every given k point, the bands are numbered with increasing energy). The band structure of NbP, calculated along selected lines in the BZ [cf. Fig. 5(b)], and the allowed transitions between different bands are shown in Figs. 4(a,b). Here, the thickness of the vertical lines connecting occupied initial and unoccupied final states is proportional to the probability of the interband transition at a given point. In panel (c) of Fig. 4, we plot the various contributions to the total interband conductivity from the individual interband transitions , , , and . The contributions of the two remaining transitions, , , are much smaller. Thus, the total low-energy conductivity is basically the sum of the four contributions shown in Fig. 4(c).
The pronounced narrow peak at 30 meV is solely formed by transitions between the bands 21 and 22, while the 65 meV mode is due to the transitions; i.e. both features stem from transitions between SOC-split bands. These transitions are only allowed in a small volume of the -space, where one of the two SOC-split bands is occupied, while the other one is empty (see the red and blue lines in Fig. 4(a)), i.e., between the nested crescents in Fig. 5(a). Within this volume, the SOC-split bands are almost parallel to each other. This ensures the appearance of strong and narrow peaks in the joint density of states for the corresponding interband transitions. The peak positions are determined by the average band splitting, which, in turn, is of the order of the SOC strength of the Nb states, meV. Finally, since the dipole matrix elements for these transitions are rather large, the two peaks dominate the low-energy interband conductivity.
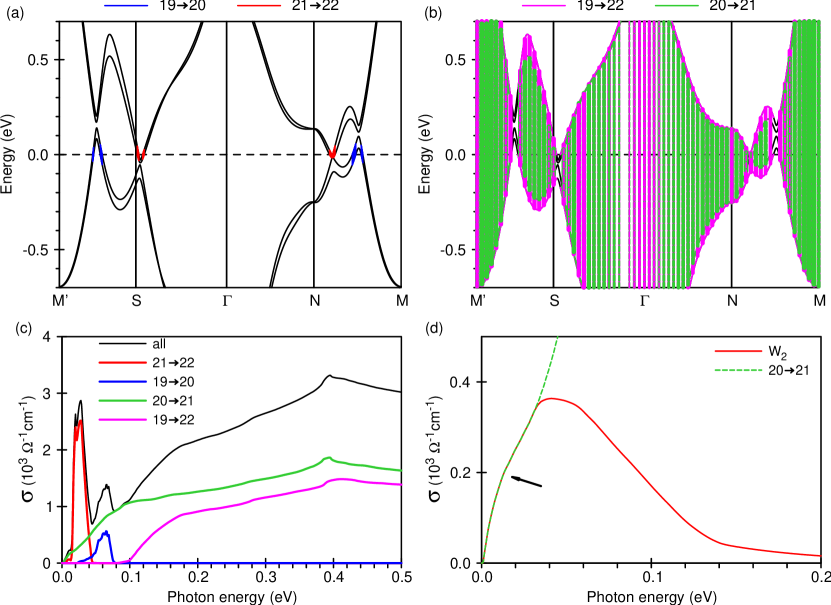
Besides these two peaks, there are also contributions to the optical conductivity with a smooth dependence. These contributions originate in transitions between the touching bands 20 and 21 [green lines in Fig. 4(b,c)] and between the bands 19 and 22, which are separated by a finite gap everywhere in the BZ [magenta lines]. Accordingly, starts at zero energy, while at 0.1 eV. Both conductivity contributions, and , increase, when the photon energy rises from 0 to 0.4 eV. Both contributions, and , as well as the total calculated exhibit sharp kinks (Van Hove singularities Yu2010 ) at 0.4 eV, which are related to the transitions between flat parallel bands near the N point, see Fig. 4(b). The experimental demonstrates such a kink at somewhat lower energy, 0.27 eV (Fig. 3); still, we find this match reasonable.
In the vicinity of a Weyl point, the optical conductivity is expected to be proportional to frequency, Eq. (1). The two sets of Weyl points in NbP, W1 and W2, are formed by touching points of the bands 20 and 21. In agreement with previous results Lee2015 ; Klotz2016 ; Wu2017 ; Grassano2018 , our LMTO calculations yield the W1 points approximately 50 meV below . Consequently, their contribution to the conductivity cannot start at zero frequency. On the other hand, the energy of the W2 points in the present calculations is very close to and, thus, transitions near W2 may provide a linearly vanishing as . To verify this behavior, we calculate the contribution to from a volume with a radius of ( is the in-plane lattice constant) around the averaged position of a pair of W2 points. The contribution indeed shows a linear dependence as , see Fig. 4(d). The smooth kink at meV, marked with an arrow, corresponds to the merging point of the chiral Weyl bands Yu2010 ; Tabert2016 . We should note that in experiments, this linear interband optical conductivity at low is completely masked by the itinerant carriers and by the strong peaks due to the transitions between the SOC-split bands, as discussed above.
Although no linear-in-frequency due to the transitions within the chiral Weyl bands can be seen in NbP at low frequencies, both, experimental and computed, demonstrate a sort of linear increase with at higher frequencies: 180 to 250 meV for the experimental and up to 360 meV for the calculated optical conductivity, see Fig. 3. As apparent from our calculations, the linearity just reflects the fact that all the electronic bands, involved in the transitions with corresponding energies, are roughly linear (but not parallel to each other), see Fig. 4(b).
Based on the comparison between the calculated and the experimental conductivity, we can assign the observed spectral features to different absorption mechanisms. Fig. 6 schematically summarizes these assignments.
Before we conclude, we would like to emphasize the importance of the transitions between the SOC-split bands. So far, the strong influence of these transitions on the low-energy conductivity of WSMs has not been fully appreciated. Using a modified Dirac Hamiltonian Burkov2011 , Tabert and Carbotte Tabert2016 calculated the optical conductivity for a four-band model, relevant for many WSMs. In this model, the band structure consists of four isotropic non-degenerate three-dimensional bands, two of which cross and the other two are gapped. The band structure is mirror symmetric in energy with respect to the Weyl nodes and the Weyl cones are anisotropic in -space at low energies. This model definitely grasps the main features of the band structure of many WSMs, including those from the TaAs family; but – apart from neglecting possible band anisotropy – it does not take into account the transitions between the SOC-split bands: these transitions are considered forbidden in the model, while in the real WSMs they might play an important role, as we have shown for NbP.
Finally, we would like to note that TaAs and TaP demonstrate sharp absorption peaks at frequencies, which compare well to those of the transitions between the SOC-split bands in NbP, cf. Fig. 3 from Ref. Kimura2017 . Previously, these features have been assigned to transitions between the merging (saddle) points of the Weyl bands, even though, e.g., in TaP this assignment is at odds with the absence of chiral carriers Arnold2016 . We suggest to reconsider this assignment.
IV Conclusions
We measure and analyze the interband and itinerant-carrier optical conductivity of NbP. From the electronic band structure, we calculate the interband optical conductivity and decompose it into contributions from the transitions between different bands. By comparing these contributions to the spectral features in the experimental conductivity, we assign the observed features to certain interband transitions. We argue that the low-energy (below 100 meV) interband conductivity is dominated by transitions between almost parallel bands, split by spin orbit coupling. Hence, these transitions manifest themselves as relatively sharp peaks centered at 30 and 65 meV. These peaks and the low-energy itinerant-carrier conductivity (Drude-like) conceal the linear-in-frequency contribution to from the transitions within the chiral Weyl bands. Our calculations demonstrate that the nearly linear in conductivity at around 200 – 300 meV is naturally explained by the fact that all electronic bands, involved in the transitions with such frequencies, possess approximately linear dispersion relations. We also identify two optical phonons and assign them to the vibrations, which mostly involve P atoms. Finally, we find that the carriers in one of the conduction channels possess extremely low momentum-relaxing scattering rates at low temperatures, leading to macroscopic characteristic length scales of momentum relaxation of about 0.5 m at K.
V Acknowledgements
We thank G. Untereiner and S. Prill-Diemer for experimental support, and U. S. Pracht and H. B. Zhang for fruitful discussions. This project was funded by the Deutsche Forschungsgesellschaft (DFG) via grant No. DR228/51-1.
References
- (1) C. Shekhar, A. K. Nayak, Y. Sun, M. Schmidt, M. Nicklas, I. Leermakers, U. Zeitler, Y. Skourski, J. Wosnitza, Z. Liu, Y. Chen, W. Schnelle, H. Borrmann, Y. Grin, C. Felser and B. Yan, Nat. Phys. 11, 645 (2015).
- (2) Z. Wang, Y. Zheng, Z. Shen, Y. Lu, H. Fang, F. Sheng, Y. Zhou, X. Yang, Y. Li, C. Feng, and Z.-A. Xu, Phys. Rev. B 93, 121112 (2016).
- (3) S.-M. Huang, S.-Y. Xu, I. Belopolski, C.-C. Lee, G. Chang, B. K. Wang, N. Alidoust, G. Bian, M. Neupane, C. Zhang, S. Jia, A. Bansil, H. Lin, and M. Z. Hasan, Nat. Commun. 6, 7373 (2014).
- (4) H. Weng, C. Fang, Z. Fang, B. A. Bernevig, and X. Dai, Phys. Rev. X 5, 011029 (2015).
- (5) C.-C. Lee, S.-Y. Xu, S.-M. Huang, D. S. Sanchez, I. Belopolski, G. Chang, G. Bian, N. Alidoust, H. Zheng, M. Neupane, B. Wang, A. Bansil, M. Z. Hasan, and H. Lin, Phys. Rev. B 92, 235104 (2015).
- (6) Y. Sun, S.-C. Wu, and B. Yan, Phys. Rev. B 92, 115428 (2015).
- (7) K.-H. Ahn, K.-W. Lee, and W. E. Pickett Phys. Rev. B 92, 115149 (2015).
- (8) J. Klotz, S.-C. Wu, C. Shekhar, Y. Sun, M. Schmidt, M. Nicklas, M. Baenitz, M. Uhlarz, J. Wosnitza, C. Felser, and B. Yan, Phys. Rev. B 93, 121105 (2016).
- (9) S.-C. Wu, Y. Sun, C. Felser, and B. Yan, Phys. Rev. B 96, 165113 (2017).
- (10) D. Grassano, O. Pulci, A. M. Conte, and F. Bechstedt, Sci. Rep. 8, 3534 (2018).
- (11) A. A. Soluyanov, D. Gresch, Z. Wang, Q. Wu, M. Troyer, X. Dai, and B. A. Bernevig, Nature 527, 495 (2015).
- (12) A. Lucas, R. A. Davison, and S. Sachdev, Proc. Natl. Acad. Sci. U.S.A. 113, 9463 (2016).
- (13) J. Gooth, A. C. Niemann, T. Meng, A. G. Grushin, K. Landsteiner, B. Gotsmann, F. Menges, M. Schmidt, C. Shekhar, V. Süß, R. Hühne, B. Rellinghaus, C. Felser, B. Yan, K. Nielsch, Nature 547, 324 (2017).
- (14) R. N. Gurzhi, Sov. Phys. JETP 17, 521 (1963).
- (15) R. N. Gurzhi, Sov. Phys. Usp. 11, 255 (1968).
- (16) H. Guo, E. Ilseven, G. Falkovich and L. S. Levitov, Proc. Natl. Acad. Sci. U.S.A. 114, 3068 (2017).
- (17) D. A. Bandurin, I. Torre, R. K. Kumar, M. B. Shalom, A. Tomadin, A. Principi, G. H. Auton, E. Khestanova, K. S. Novoselov, I. V. Grigorieva, L. A. Ponomarenko, A. K. Geim, and M. Polini, Science 351, 1055 (2016).
- (18) J. Crossno, J. K. Shi, K. Wang, X. Liu, A. Harzheim, A. Lucas, S. Sachdev, P. Kim, T. Taniguchi, K. Watanabe, T. A. Ohki, and K. C. Fong, Science 351, 1058 (2016).
- (19) J. Gooth, F. Menges, C. Shekhar, V. Süß, N. Kumar, Y. Sun, U. Drechsler, R. Zierold, C. Felser, and B. Gotsmann, arXiv:1706.05925 (2017).
- (20) R. K. Kumar, D. A. Bandurin, F. M. D. Pellegrino, Y. Cao, A. Principi, H. Guo, G. H. Auton, M. B. Shalom, L. A. Ponomarenko, G. Falkovich, K. Watanabe, T. Taniguchi, I. V. Grigorieva, L. S. Levitov, M. Polini, and A. K. Geim, Nat. Phys. 13, 1182 (2017).
- (21) T. O. Wehling, A. M. Black-Schaffer, and A. V. Balatsky, Adv. Phys. 63, 1 (2014).
- (22) P. Hosur, S. A. Parameswaran, and A. Vishwanath, Phys. Rev. Lett. 108, 046602 (2012).
- (23) Á. Bácsi and A. Virosztek, Phys. Rev. B 87, 125425 (2013).
- (24) P. E. C. Ashby and J. P. Carbotte, Phys. Rev. B 89, 245121 (2014).
- (25) T. Timusk, J. P. Carbotte, C. C. Homes, D. N. Basov, and S. G. Sharapov, Phys. Rev. B 87, 235121 (2013).
- (26) R. Y. Chen, S. J. Zhang, J. A. Schneeloch, C. Zhang, Q. Li, G. D. Gu, and N. L. Wang, Phys. Rev. B 92, 075107 (2015).
- (27) A. B. Sushkov, J. B. Hofmann, G. S. Jenkins, J. Ishikawa, S. Nakatsuji, S. Das Sarma, and H. D. Drew, Phys. Rev. B 92, 241108 (2015).
- (28) D. Neubauer, J. P. Carbotte, A. A. Nateprov, A. Löhle, M. Dressel, and A. V. Pronin, Phys. Rev. B 93, 121202 (2016).
- (29) K. Ueda, J. Fujioka, and Y. Tokura, Phys. Rev. B 93 245120 (2016).
- (30) B. Xu, Y. M. Dai, L. X. Zhao, K. Wang, R. Yang, W. Zhang, J. Y. Liu, H. Xiao, G. F. Chen, A. J. Taylor, D. A. Yarotski, R. P. Prasankumar, and X. G. Qiu, Phys. Rev. B 93, 121110 (2016).
- (31) S. Kimura, H. Yokoyama, H. Watanabe, J. Sichelschmidt, V. Süß, M. Schmidt, and C. Felser, Phys. Rev. B 96, 075119 (2017).
- (32) F. Hütt, M. B. Schilling, C. Shekhar, C. Felser, M. Dressel, A. V. Pronin, arXiv:1803.00840 (2018).
- (33) T. Scaffidi, N. Nandi, B. Schmidt, A. P. Mackenzie, and J. E. Moore, Phys. Rev. Lett. 118, 226601 (2017).
- (34) A. Lucas and K. C. Fong, J. Phys. Condens. Matter 30, 053001 (2018).
- (35) M. Dressel and G. Grüner, Electrodynamics of Solids (Cambridge University Press, Cambridge, 2002).
- (36) J. Martin and R. Gruehn, Solid State Ionics 43, 19 (1990).
- (37) C. Zhang, C. Guo, H. Lu, X. Zhang, Z. Yuan, Z. Lin, J. Wang, and S. Jia, Phys. Rev. B 92, 041203 (2015).
- (38) Z. Wang, Y. Zheng, Z. Shen, Y. Lu, H. Fang, F. Sheng, Y. Zhou, X. Yang, Y. Li, C. Feng, and Z.-A. Xu, Phys. Rev. B 93, 121112 (2016).
- (39) D. B. Tanner, Phys. Rev. B 91, 035123 (2015).
- (40) M. B. Schilling, A. Löhle, D. Neubauer, C. Shekhar, C. Felser, M. Dressel, and A. V. Pronin, Phys. Rev. B 95, 155201 (2017).
- (41) M. B. Schilling, L. M. Schoop, B. V. Lotsch, M. Dressel, and A. V. Pronin, Phys. Rev. Lett. 119, 187401 (2017).
- (42) A. B. Kuzmenko, Rev. Sci. Instrum. 76, 083108 (2005).
- (43) G. Chanda, R. P. S. M. Lobo, E. Schachinger, J. Wosnitza, M. Naito, and A. V. Pronin, Phys. Rev. B 90, 024503 (2014).
- Xu et al. (1996) J. Xu, M. Greenblatt, T. Emge, P. Hohn, T. Hughbanks, and Y. Tian, 35, 845 (1996).
- Andersen (1975) O. K. Andersen, Phys. Rev. B 12, 3060 (1975).
- Antonov et al. (2004) V. Antonov, B. Harmon, and A. Yaresko, Electronic structure and magneto-optical properties of solids (Kluwer Academic Publishers, Dordrecht, Boston, London, 2004).
- Perdew and Wang (1992) J. P. Perdew and Y. Wang, Phys. Rev. B 45, 13244 (1992).
- Blöchl et al. (1994) P. E. Blöchl, O. Jepsen, and O. K. Andersen, Phys. Rev. B 49, 16223 (1994).
- (49) D. Chaudhuri, B. Cheng, A. Yaresko, Q. D. Gibson, R. J. Cava, and N. P. Armitage, Phys. Rev. B 96, 075151 (2017).
- (50) B. Xu, Y. M. Dai, L. X. Zhao, K. Wang, R. Yang, W. Zhang, J. Y. Liu, H. Xiao, G. F. Chen, S. A. Trugman, J.-X. Zhu, A. J. Taylor, D. A. Yarotski, R. P. Prasankumar, and X. G. Qiu, Nat. Commun. 8, 14933 (2017).
- (51) D. Chang, Y. Liu, F. Rao, F. Wang, Q. Sunac, and Y. Jia, Phys. Chem. Chem. Phys. 18 14503, (2016).
- (52) H. W. Liu, P. Richard, L. X. Zhao, G.-F. Chen, and H. Ding, J. Phys. Condens. Matter 28, 295401 (2016).
- (53) S. Datta, Electronic Transport in Mesoscopic Systems (Cambridge University Press, Cambridge, 1995).
- (54) A. C. Niemann, J. Gooth, S.-C. Wu, S. Bäßler, P. Sergelius, R. Hühne, B. Rellinghaus, C. Shekhar, V. Süß, M. Schmidt, C. Felser, B. Yan, and K. Nielsch, Sci. Rep. 7, 43394 (2017).
- (55) A. J. Frenzel, C. C. Homes, Q. D. Gibson, Y. M. Shao, K. W. Post, A. Charnukha, R. J. Cava, and D. N. Basov, Phys. Rev. B 95, 245140 (2017).
- (56) P. Y. Yu and M. Cardona, Fundamentals of Semiconductors: Physics and Materials Properties (Springer, Berlin, 2010).
- (57) C. J. Tabert and J. P. Carbotte, Phys. Rev. B 93, 085442 (2016).
- (58) A. A. Burkov, M. D. Hook, and L. Balents, Phys. Rev. B 84, 235126 (2011).
- (59) F. Arnold, C. Shekhar, S.-C. Wu, Y. Sun, R. D. dos Reis, N. Kumar, M. Naumann, M. O. Ajeesh, M. Schmidt, A. G. Grushin, J. H. Bardarson, M. Baenitz, D. Sokolov, H. Borrmann, M. Nicklas, C. Felser, E. Hassinger, and B. Yan, Nat. Commun. 7, 11615 (2016).