Phase diagram of Kob-Andersen type binary Lennard-Jones mixtures
Abstract
The binary Kob-Andersen (KA) Lennard-Jones mixture is the standard model for computational studies of viscous liquids and the glass transition. For very long simulations the viscous KA system crystallizes, however, by phase separating into a pure A particle phase forming an FCC crystal. We present the thermodynamic phase diagram for KA-type mixtures consisting of up to 50% small (B) particles showing, in particular, that the melting temperature of the standard KA system at liquid density is in A particle Lennard-Jones units. At large B particle concentrations the system crystallizes into the CsCl crystal structure. The eutectic corresponding to the FCC and CsCl structures is cut-off in a narrow interval of B particle concentrations around 26% at which the bipyramidal orthorhombic structure is the thermodynamically stable phase. The melting temperature’s variation with B particle concentration at two other pressures, as well as at the constant density , is estimated from the simulations at pressure using isomorph theory. Our data demonstrate approximate identity between the melting temperature and the onset temperature below which viscous dynamics appears. Finally, the nature of the solid-liquid interface is briefly discussed.
Standard models are invaluable in physics by providing well-understood reference systems for testing new ideas. Well-known examples are the ideal gas model, the Ising model for critical phenomena Goldenfeld (1992); Niss (2005), and the scalar field theory for renormalization Goldenfeld (1992); Amit (2005). In computational studies of viscous liquids and the glass transition Barrat et al. (2000); Franz et al. (2002); Ashwin and Sastry (2003); Flenner and Szamel (2005); Gnan et al. (2009); Pedersen et al. (2010a) the Kob-Andersen (KA) binary Lennard-Jones (LJ) mixture has been the standard model for 20 years Kob and Andersen (1995). The KA model is a mixture of 80% large A particles and 20% small B particles. The model is characterized by a strong AB attraction, which disfavors phase separation into a pure A phase by making it energetically costly. When the model crystallizes in very long computer runs, this nevertheless happens by phase separation into a pure A phase forming a face-centered cubic (FCC) crystalline structure Hedges et al. (2009); Toxvaerd et al. (2009). This may be contrasted to the Wahnstrom 50/50 binary LJ mixture Wahnström (1991) that has a much more complex crystal structure Pedersen et al. (2007, 2010b).
In the KA mixture all particles have the same mass and interact via LJ pair potentials truncated and shifted to zero at 2.5 with , , , and . The large favors stability towards phase separation. The parameters of the KA model were chosen to mimic the nickel-phosphor mixture Kob and Andersen (1995) that has a eutectic at 20% P atoms Schmetterer et al. (2009); eutectic mixtures Zhang et al. (2012) are generally regarded as optimal for glass formation Turnbull (1969).
Crystallization of binary LJ models has been simulated by several groups Hitchcock and Hall (1999); Lamm and Hall (2001a, b); Kofke (1993). In 2001 Wales and coworkers showed that the KA system possesses low-lying crystalline minima Middleton et al. (2001), confirming the prevailing view that the KA viscous liquid is not in true thermodynamic equilibrium Asta et al. (2009). Two years later Fernandez and Harrowell reported rapid crystal growth for the 50/50 KA mixture Fernandez and Harrowell (2003) and argued that for general KA-type mixtures, the lowest-energy ordered state consists of coexisting phases of single-component FCC and equimolar CsCl crystal structures Jungblut and Dellago (2011). In 2009 Kob and coworkers reported that the standard 80/20 KA mixture crystallizes in two dimensions whereas the 65/35 composition does not Brüning et al. (2009). Royall and coworkers in 2015 showed that locally favored structures impede crystallization if they do not tile space Crowther et al. (2015). In 2016 Bhattacharyya and coworkers showed that the entropic penalty for demixing is a non-monotonic function of composition with a maximum at a composition close to that of the standard KA model Nandi et al. (2016).
The below study utilized the software packages RUMD Bailey et al. (2017), LAMMPS Plimpton (1995), VMD Humphrey et al. (1996), and a home-written code available at http://urp.dk/tools. The majority of the simulations involved 8000 particles, a few ones 10000 particles.
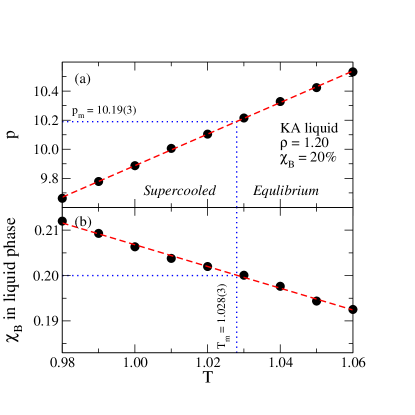
Most KA-model papers focus on density 1.2 in the LJ unit system used henceforth defined by the A particle parameters. We determined the melting temperature of the standard KA liquid at this density from two-phase simulations by proceeding as follows. First the pressure of the liquid was calculated as a function of temperature at density 1.2 (Fig. 1(a)). Next we determined the lattice parameters of pure A particle FCC crystals at the temperatures and pressures of Fig. 1(a) Parrinello and Rahman (1981); Martyna et al. (1994). The final step was to simulate at each temperature and pressure a two-phase system composed initially of half KA liquid and half pure A crystal, choosing a box size compatible with the determined lattice constant and using a “longitudinal” barostat ensuring constant pressure perpendicular to the crystal-liquid interface. Over time the pure A crystal either grows or shrinks, which changes the ratio of A to B particles in the liquid phase. When equilibrium has been reached, the temperature is the melting temperature of that particular liquid composition Becker et al. (2006). Figure 1(b) shows the fraction of B particles where the abscissa is the melting temperature at the pressure identified in Fig. 1(a). For the standard 80/20 KA system we see that at pressure and liquid-phase density 1.2, freezing occurs at temperature .
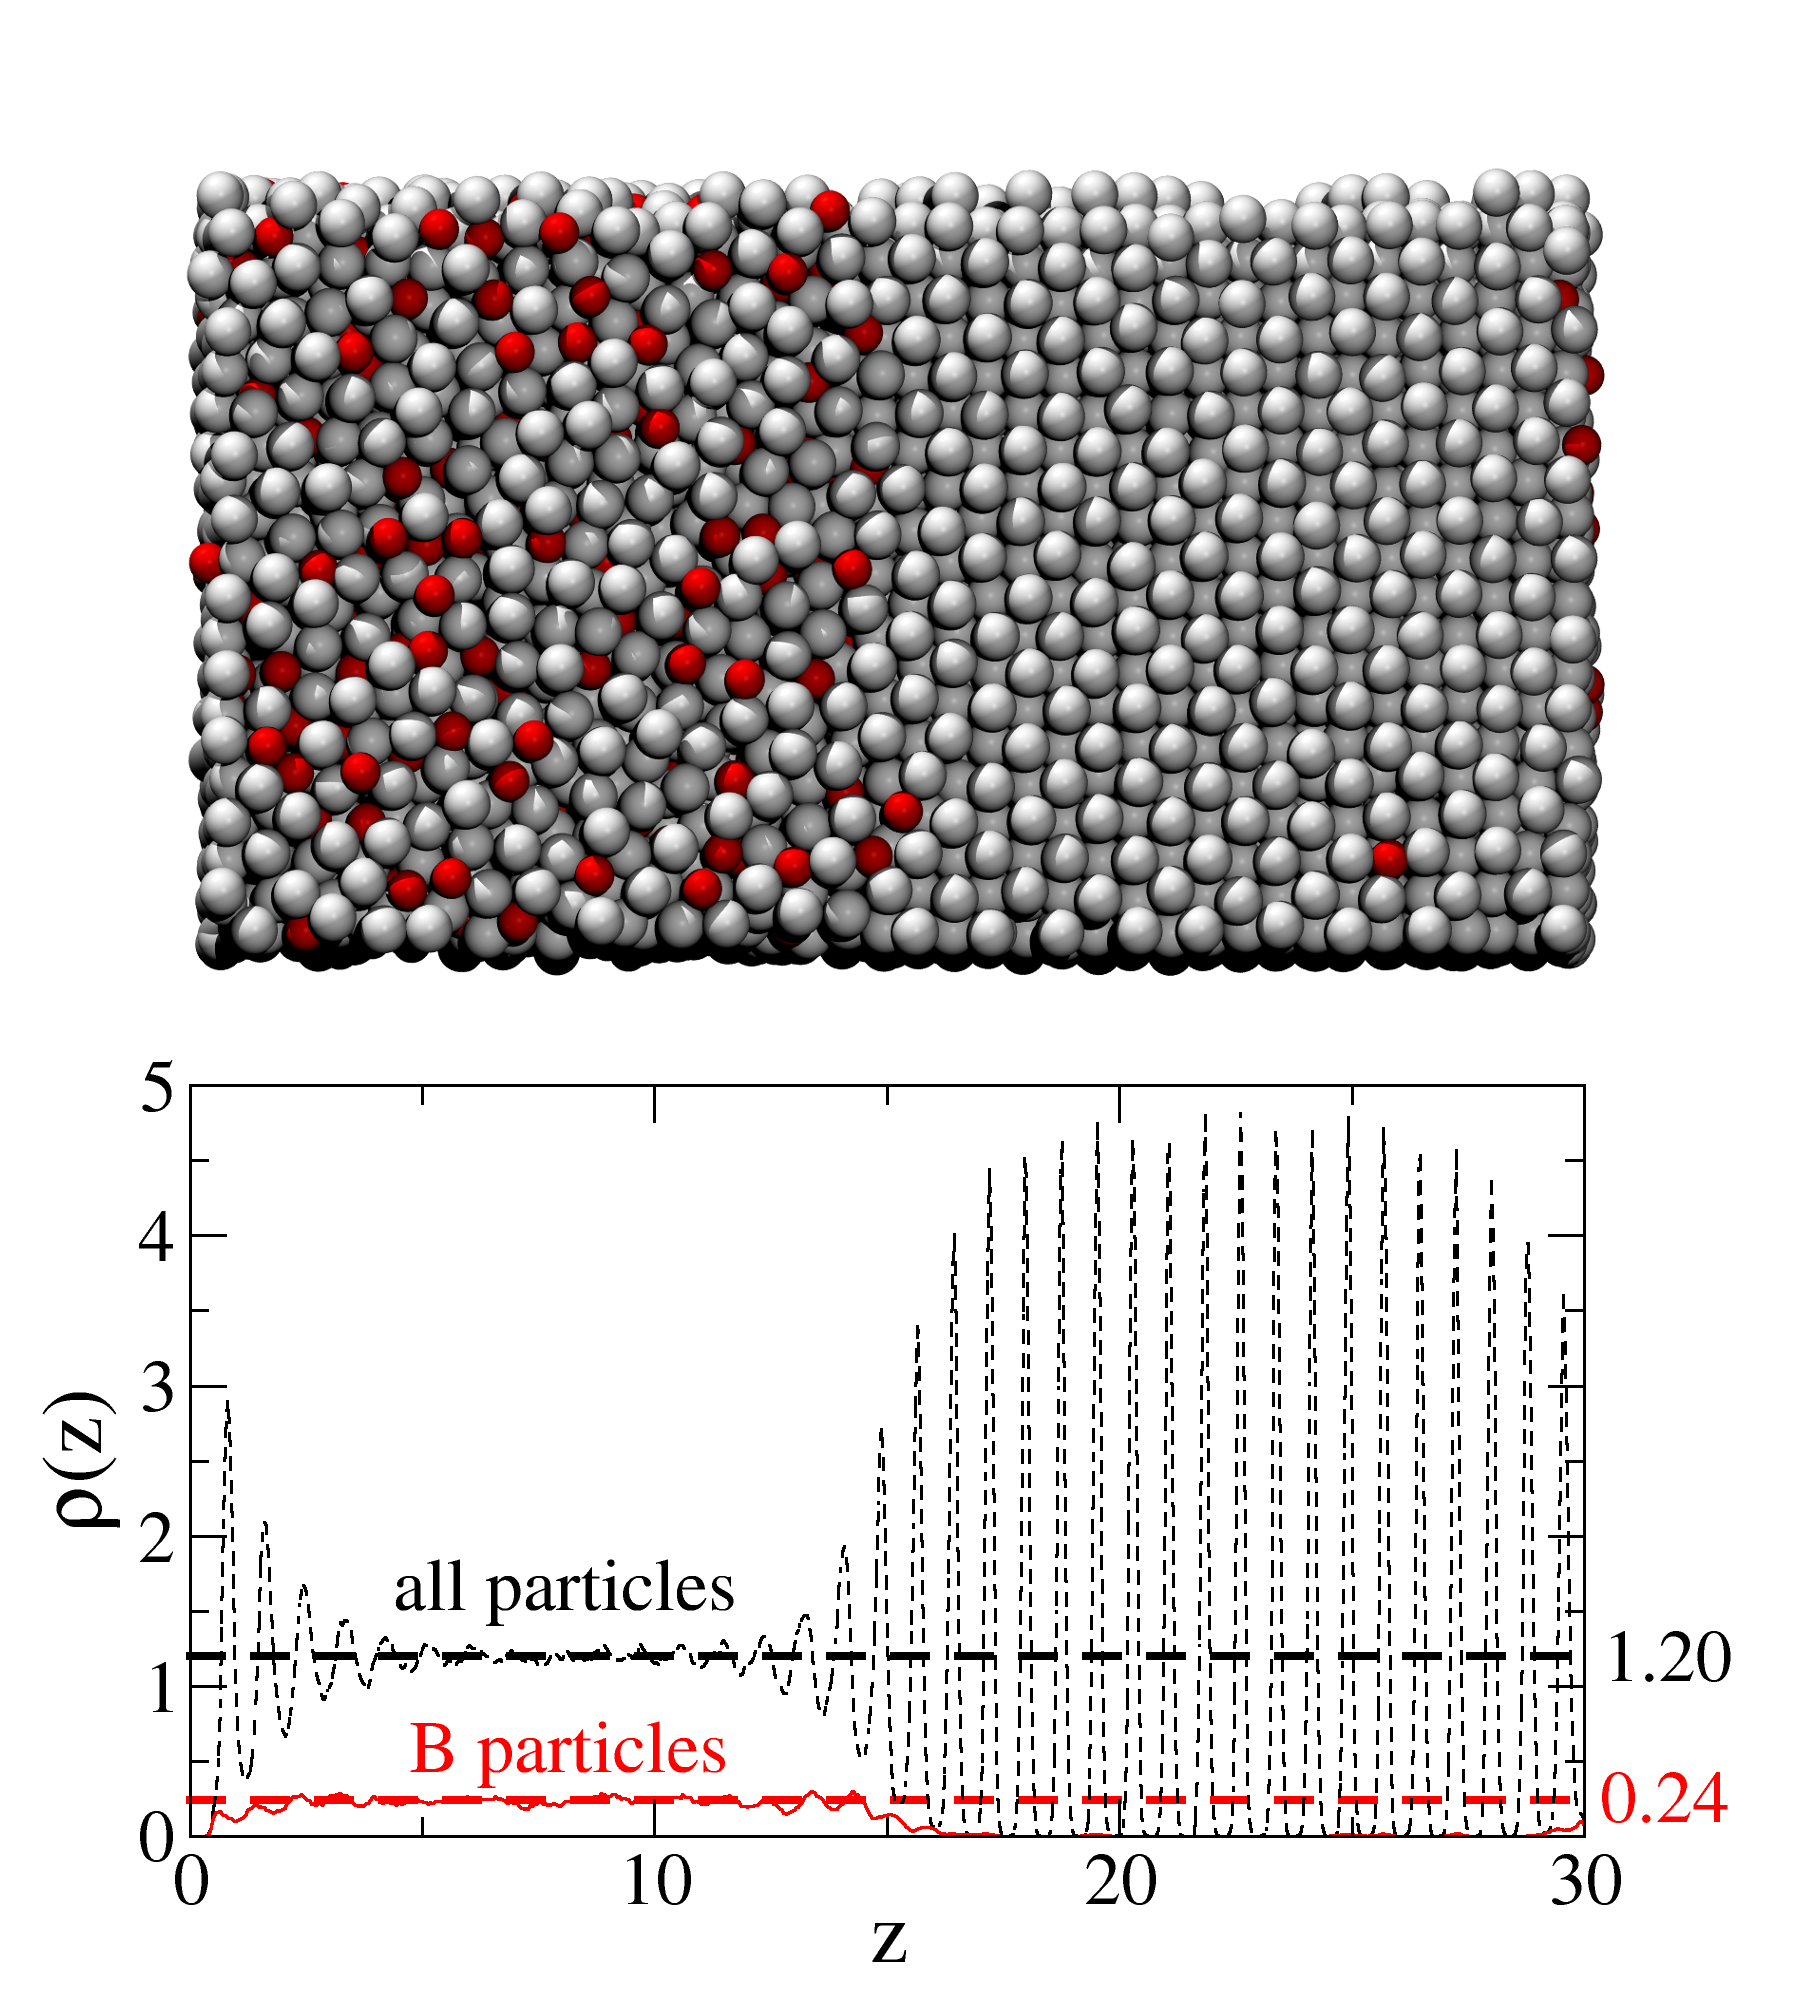
Figure 2 shows a snapshot of the two-phase equilibrium KA system at and . A few B particles (red) have diffused into the pure A crystal, which is to be expected given the relatively high temperature. The lower panel shows the density of B particles (red) and of all particles (black), confirming that the liquid phase has density 1.2 and contains 20% B particles.
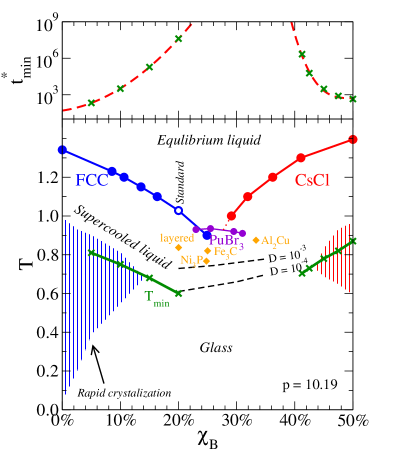
Having determined the pressure of the state point at which the KA liquid at freezing has density 1.2, we proceed to establish the composition-temperature phase diagram at this pressure (Fig. 3). The phase diagram was arrived at by the above method in which the solid-liquid interface is “pinned” due to the composition constraint in the liquid. When the liquid has same composition as the crystal this constraint is absent, however, in which case we used the interface-pinning method Pedersen (2013).
At small B particle concentrations the solid phase is a pure A phase FCC crystal. Upon increasing the B particle concentration, at some point the system crystallizes instead into the 50/50 CsCl structure of two interpenetrating cubic lattices of A and B particles Fernandez and Harrowell (2003); Nandi et al. (2016). The eutectic of these two crystal phases is located around 26% B particles, but interestingly there is a narrow region around the eutectic in which the bipyramidal orthorhombic structure is the thermodynamically stable phase. We also studied the Al2Cu, Fe3C, and Ni3P structures shown by Fernández and Harrowell to be of low energy at and Fernandez and Harrowell (2004), but found that their melting temperatures are all lower, compare Fig. 3 and Table 1. In Fig. 3 “layered” denotes a structure of alternating layers of CsCl and pure A particle FCC crystals, known to have a low energy at Middleton et al. (2001); Fernandez and Harrowell (2003).
To investigate the dynamics of crystallization we utilized the following protocol for a range of compositions and temperatures (): First, one equilibrates up to ten liquid configurations at the coexistence temperature. Subsequently, the temperature is changed to the desired value and one computes the crystallization time , defined as the average time at which 10% of the particles are in a crystalline environment (monitored by the crystal order parameter defined as the absolute value of the density’s Fourier transform at the fundamental lattice k-vector Lechner and Dellago (2008)). The blue and red areas in Fig. 3 are regions with rapid crystallization. As expected, the spontaneously formed crystals are FCC for 0%-15% B’s and CsCl for 41%-50% B’s. The green crosses show for each composition the temperature at which the crystallization time is at a minimum, . The upper panel shows .
| FCC | [Fm; 225] | 0% | 1.341(4) | 1.0535 | 0.9796 | -3.6460 | -2.7971 | 1.177 |
|---|---|---|---|---|---|---|---|---|
| PuBr3 | [Cmcm; 63] | 25.5% | 0.935(8) | 1.3515 | 1.2712 | -7.1192 | -6.3170 | 1.367 |
| Fe3C | [Pnma; 62] | 25.0% | 0.820(8) | 1.3501 | 1.2950 | -7.1446 | -6.5360 | 1.134 |
| Ni3P | [I; 82] | 24.8% | 0.767(6) | 1.3582 | 1.2878 | -7.0759 | -6.6409 | 1.102 |
| Al2Cu | [I/mcm; 140] | 33.4% | 0.875(8) | 1.4256 | 1.2858 | -7.1720 | -6.9785 | 1.109 |
| CsCl | [Pmm; 221] | 49.4% | 1.394(4) | 1.6427 | 1.4392 | -7.5850 | -5.9561 | 1.798 |
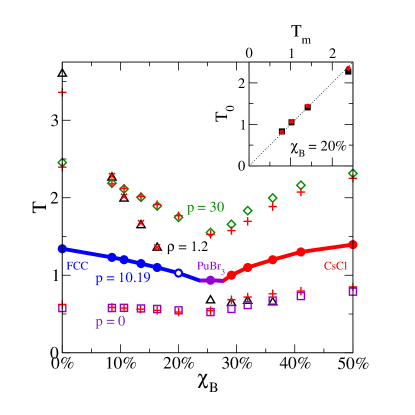
The melting line in Fig. 3 is for , the pressure at which the coexisting liquid for the standard 80/20 KA system has density . The melting temperature’s variation with B particle concentration at other pressures or at constant liquid-phase density may be estimated from the results from the fact that the melting line to a good approximation follows a liquid isomorph Gnan et al. (2009); Pedersen et al. (2016). The estimate, which makes use of the fact that LJ-type systems are R-simple, i.e., have strong virial potential-energy correlations Pedersen et al. (2008); Bailey et al. (2008); Dyre (2014), works as follows. For any mixture of LJ particles, if the melting temperature at liquid density is , the melting temperature at liquid density is approximately given Bøhling et al. (2012); Ingebrigtsen et al. (2012) by
| (1) |
Here is the density-scaling exponent at computed from equilibrium canonical-ensemble fluctuations via in which is the potential energy and the virial Gnan et al. (2009). At liquid density the predictions based on Eq. (1) are shown as triangles in Fig. 4.
If one wishes to estimate from the results the melting temperature at other pressures, the following procedure is employed. Along an LJ isomorph the pressure varies as in which and are the virial and potential energy per particle at the reference state point Schrøder et al. (2011). Equation (1) is inserted into this expression, resulting in in which and . This relation is inverted numerically and the melting temperature is estimated by inserting into Eq. (1). The parameters used in the predictions are given in Table 2.
The estimated melting temperature at and are shown in Fig. 4 as open squares and diamonds, respectively. These compare reasonably well to the actual melting temperatures (crosses). At the standard 80/20 composition the zero-pressure melting temperature is estimated to be 0.547(8). The actual melting temperature is , which is 4% below the estimate. The largest deviation from the isomorph-theory estimated melting temperatures are found for the CsCl structure. In this case there is a four times larger difference between the liquid and crystal density-scaling exponents than for the A particle FCC crystal, implying that the melting line is less accurately represented as an isomorph Pedersen et al. (2016). For single-component systems a more accurate melting-line theory exists based on a first-order Taylor expansion from the approximate melting isomorph Pedersen et al. (2016).
| 0.000 | 1.341 | 0.980 | 5.16 | -4.817 | 9.056 |
|---|---|---|---|---|---|
| 0.085 | 1.230 | 1.062 | 5.15 | -5.256 | 8.372 |
| 0.106 | 1.200 | 1.084 | 5.11 | -5.372 | 8.204 |
| 0.135 | 1.150 | 1.117 | 5.12 | -5.548 | 7.971 |
| 0.163 | 1.100 | 1.151 | 5.10 | -5.724 | 7.752 |
| 0.200 | 1.028 | 1.200 | 5.11 | -5.974 | 7.444 |
| 0.255 | 0.935 | 1.278 | 5.10 | -6.343 | 7.042 |
| 0.291 | 1.000 | 1.305 | 5.13 | -6.354 | 6.808 |
| 0.319 | 1.100 | 1.316 | 5.18 | -6.263 | 6.641 |
| 0.362 | 1.200 | 1.343 | 5.18 | -6.202 | 6.384 |
| 0.410 | 1.300 | 1.375 | 5.19 | -6.118 | 6.115 |
| 0.494 | 1.395 | 1.439 | 5.21 | -5.953 | 5.691 |
By fitting relaxation times for the standard 80/20 KA system to the frustration-limited-domain theory of the glass transition Tarjus et al. (2004), Coslovich and Pastore determined the “onset temperature” below which the non-Arrhenius temperature dependence of the relaxation time initiates Coslovich and Pastore (2007). The inset of Fig. 4 compares their data to the melting temperature at different pressures. There is good agreement, which tentatively confirms physical pictures of Sastry and of Yanagishima et al. Sastry et al. (1998); Sastry ; Yanagishima et al. (2017). Though the identity of onset and melting temperatures may not apply universally, it suggests that a class of liquids exists for which this is the case.
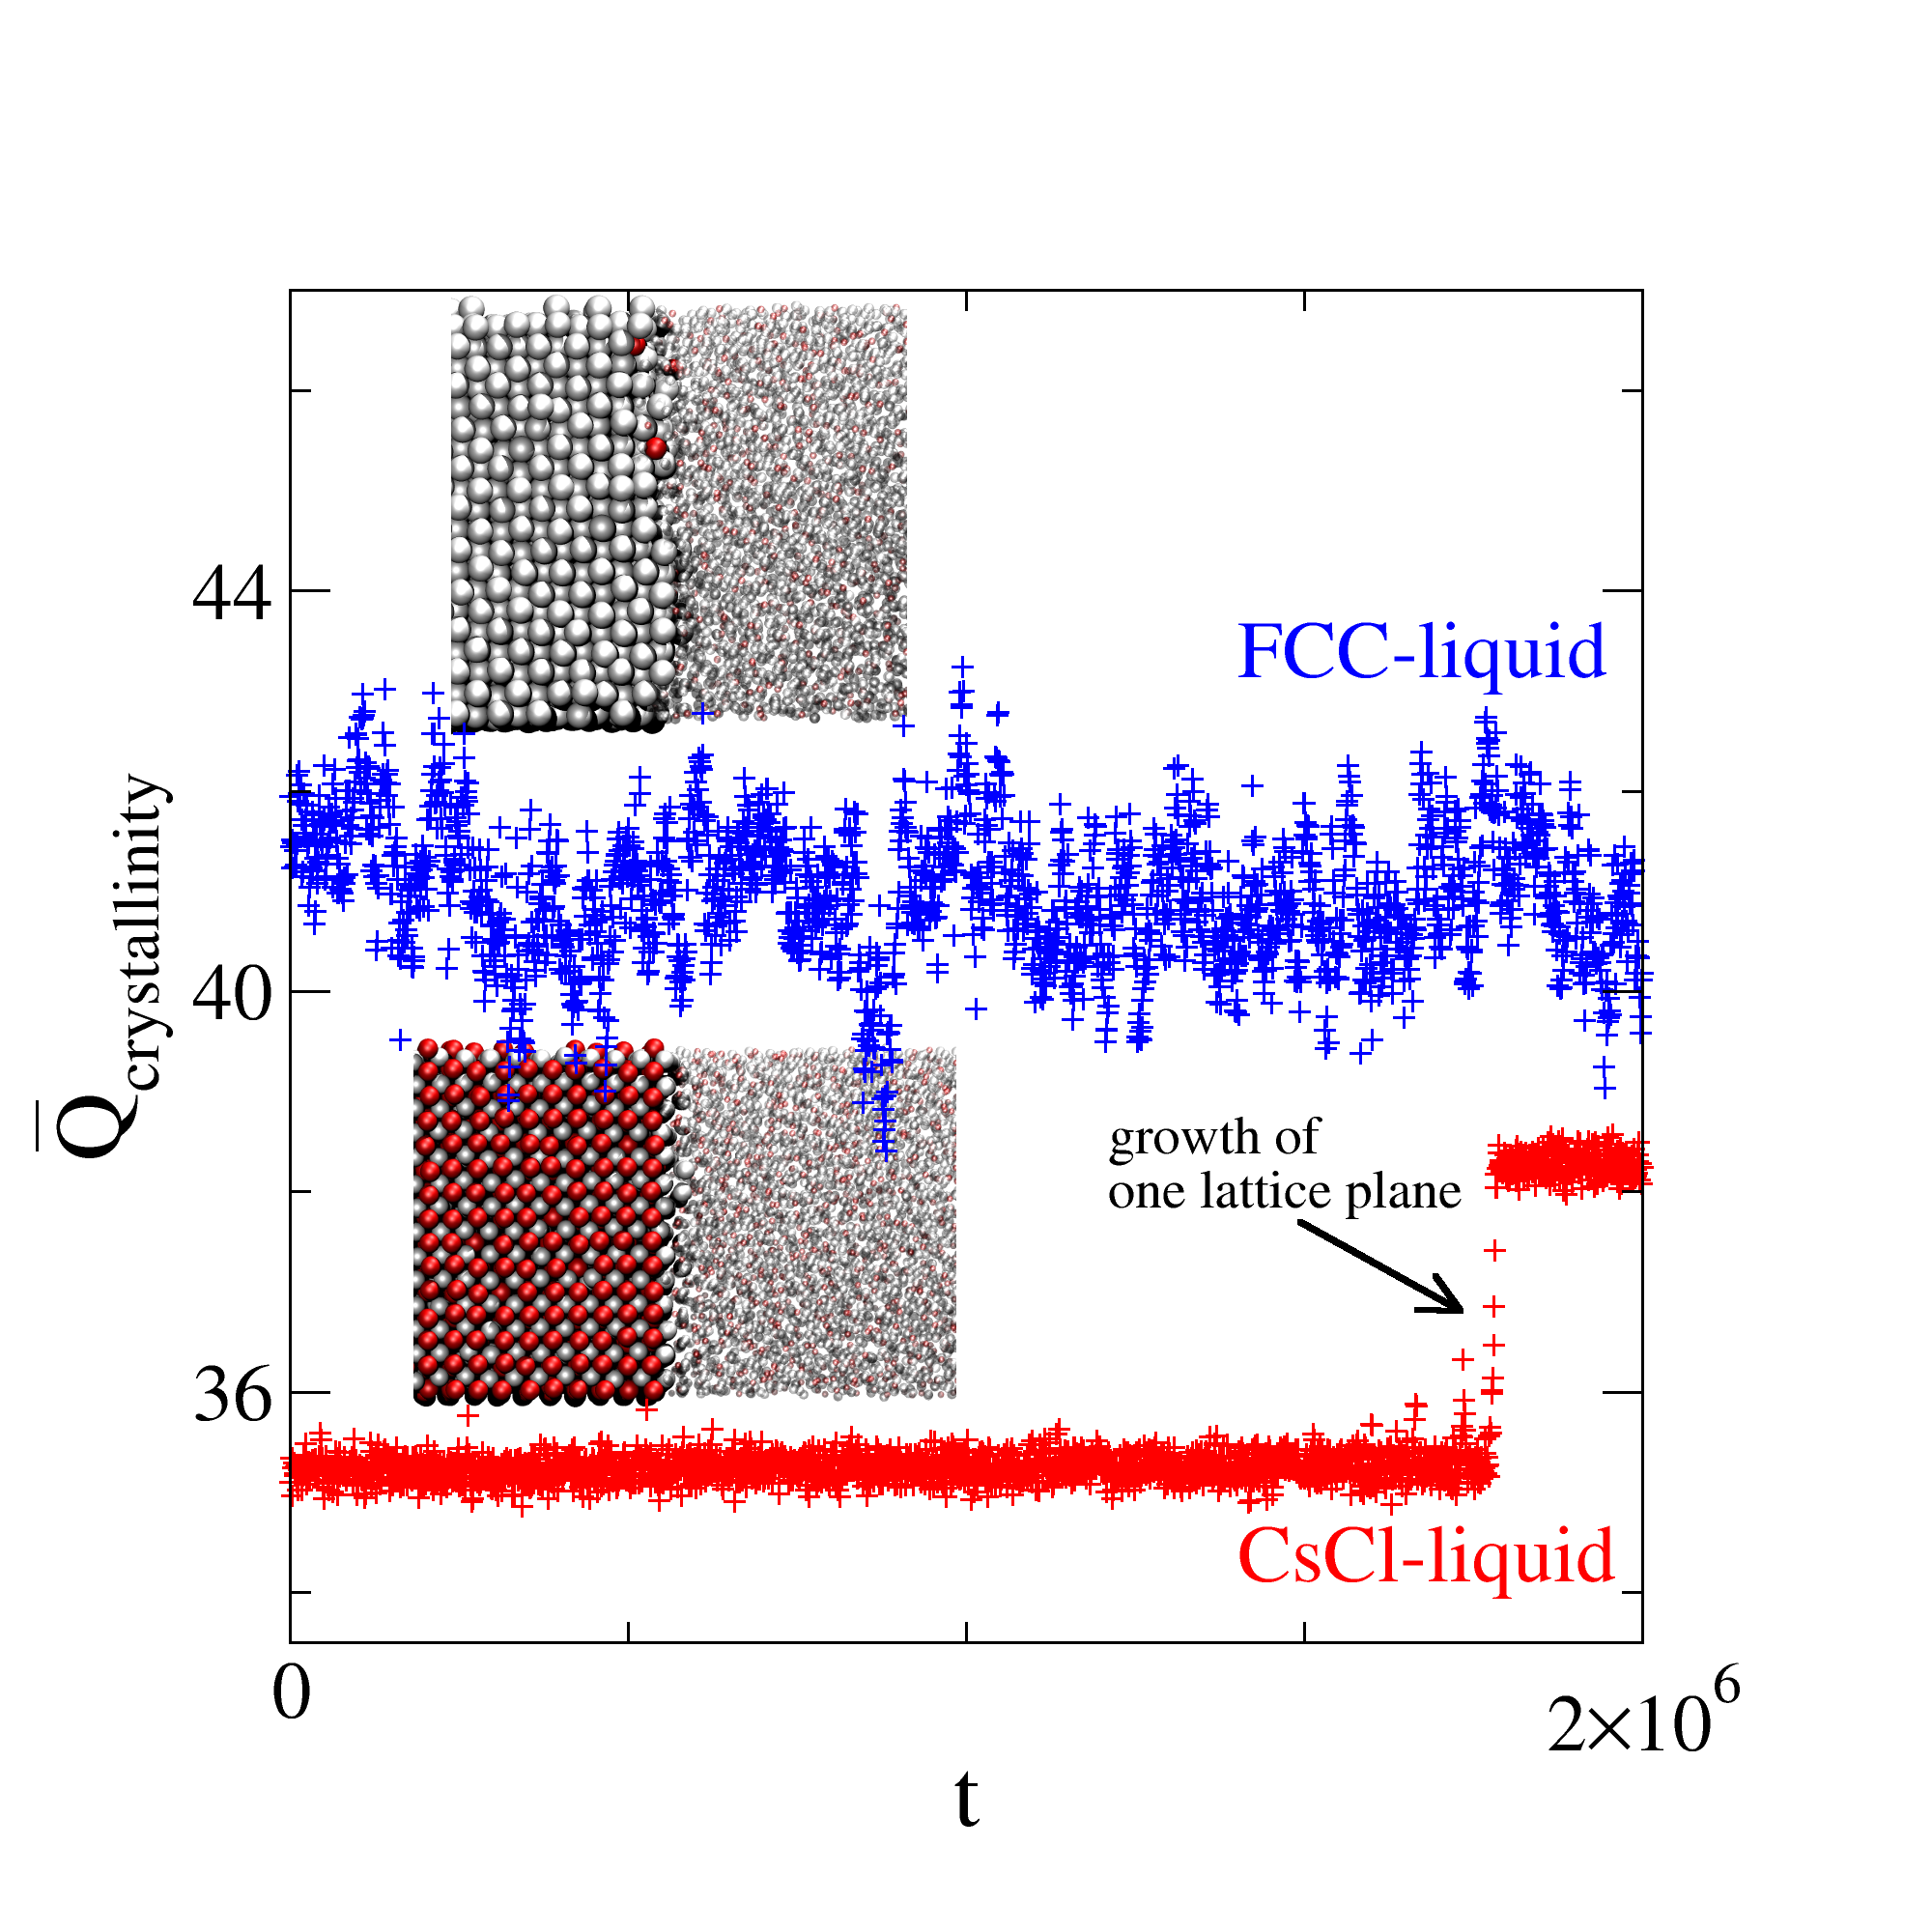
The two main crystal structures have different formation dynamics. Figure 5 shows how the crystal order parameter fluctuates at solid-liquid equilibrium. The coexisting FCC-liquid situation is more noisy than the CsCl-liquid case. We interpret the former as reflecting a rough interface, whereas in the latter case the interface is flat, i.e., grows layer by layer Pimpinelli and Villain (1998). This is consistent with general findings Jackson (2004) since the melting entropy is larger in the latter case (Table 1).
In summary, we have mapped out the phase diagram of KA-type binary LJ mixtures showing, in particular, that the standard 80/20 KA liquid at density crystallizes at . Our findings suggest that KA systems more stable against crystallization are those of 26-30% B particles. This is consistent with recent results of Ingebrigtsen and Royall, who have simulated the density KA viscous liquid with 30% B particles for months on a GPU cluster without being able to crystallize it Ingebrigtsen and Royall .
Acknowledgements.
This work was supported by the VILLUM Foundation’s VKR-023455 and Matter (16515) grants.References
- Goldenfeld (1992) N. Goldenfeld, Lectures on phase transitions and the renormalization group (Addison-Wesley, Reading, MA, 1992).
- Niss (2005) M. Niss, Archive for History of Exact Sciences 59, 267 (2005); ibid. 63, 243 (2009); ibid. 65, 625 (2011).
- Amit (2005) D. J. Amit, Field Theory, the Renormalization Group, and Critical Phenomena, 3rd ed. (World Scientific, Singapore, 2005).
- Barrat et al. (2000) A. Barrat, J. Kurchan, V. Loreto, and M. Sellitto, Phys. Rev. Lett. 85, 5034 (2000).
- Franz et al. (2002) S. Franz, R. Mulet, and G. Parisi, Phys. Rev. E 65, 021506 (2002).
- Ashwin and Sastry (2003) S. S. Ashwin and S. Sastry, J. Phys.: Cond. Mat. 15, S1253 (2003).
- Flenner and Szamel (2005) E. Flenner and G. Szamel, Phys. Rev. E 72, 011205 (2005).
- Gnan et al. (2009) N. Gnan, T. B. Schrøder, U. R. Pedersen, N. P. Bailey, and J. C. Dyre, J. Chem. Phys. 131, 234504 (2009).
- Pedersen et al. (2010a) U. R. Pedersen, T. B. Schrøder, and J. C. Dyre, Phys. Rev. Lett. 105, 157801 (2010a).
- Kob and Andersen (1995) W. Kob and H. C. Andersen, Phys. Rev. E 51, 4626 (1995).
- Hedges et al. (2009) L. O. Hedges, R. L. Jack, J. P. Garrahan, and D. Chandler, Science 323, 1309 (2009).
- Toxvaerd et al. (2009) S. Toxvaerd, U. R. Pedersen, T. B. Schrøder, and J. C. Dyre, J. Chem. Phys. 130, 224501 (2009).
- Wahnström (1991) G. Wahnström, Phys. Rev. A 44, 3752 (1991).
- Pedersen et al. (2007) U. R. Pedersen, N. P. Bailey, J. C. Dyre, and T. B. Schrøder, arXiv:0706.0813 (2007).
- Pedersen et al. (2010b) U. R. Pedersen, T. B. Schrøder, J. C. Dyre, and P. Harrowell, Phys. Rev. Lett. 104, 105701 (2010b).
- Schmetterer et al. (2009) C. Schmetterer, J. Vizdal, and H. Ipser, Intermetallics 17, 826 (2009).
- Zhang et al. (2012) Q. Zhang, K. De Oliveira Vigier, S. Royer, and F. Jerome, Chem. Soc. Rev. 41, 7108 (2012).
- Turnbull (1969) D. Turnbull, Contemp. Phys. 10, 473 (1969).
- Hitchcock and Hall (1999) M. R. Hitchcock and C. K. Hall, J. Chem. Phys. 110, 11433 (1999).
- Lamm and Hall (2001a) M. H. Lamm and C. K. Hall, Fluid Phase Equilibria 182, 37 (2001a).
- Lamm and Hall (2001b) M. H. Lamm and C. K. Hall, AIChE Journal 47, 1664 (2001b).
- Kofke (1993) D. A. Kofke, J. Chem. Phys. 98, 4149 (1993).
- Middleton et al. (2001) T. F. Middleton, J. Hernandez-Rojas, P. N. Mortenson, and D. J. Wales, Phys. Rev. B 64, 184201 (2001).
- Asta et al. (2009) M. Asta, C. Beckermann, A. Karma, W. Kurz, R. Napolitano, M. Plapp, G. Purdy, M. Rappaz, and R. Trivedi, Acta Materialia 57, 941 (2009).
- Fernandez and Harrowell (2003) J. R. Fernandez and P. Harrowell, Phys. Rev. E 67, 011403 (2003).
- Jungblut and Dellago (2011) S. Jungblut and C. Dellago, J. Chem. Phys. 134, 104501 (2011).
- Brüning et al. (2009) R. Brüning, D. A. St-Onge, S. Patterson, and W. Kob, J. Phys.: Cond. Mat. 21, 035117 (2009).
- Crowther et al. (2015) P. Crowther, F. Turci, and C. P. Royall, J. Chem. Phys. 143, 044503 (2015).
- Nandi et al. (2016) U. K. Nandi, A. Banerjee, S. Chakrabarty, and S. M. Bhattacharyya, J. Chem. Phys. 145, 034503 (2016).
- Bailey et al. (2017) N. P. Bailey, T. S. Ingebrigtsen, J. S. Hansen, A. A. Veldhorst, L. Bøhling, C. A. Lemarchand, A. E. Olsen, A. K. Bacher, L. Costigliola, U. R. Pedersen, H. Larsen, J. C. Dyre, and T. B. Schrøder, Scipost Phys. 3, 038 (2017).
- Plimpton (1995) S. Plimpton, J. Comp. Phys. 117, 1 (1995).
- Humphrey et al. (1996) W. Humphrey, A. Dalke, and K. Schulten, J. Mol. Graph. 14, 33 (1996).
- Parrinello and Rahman (1981) M. Parrinello and A. Rahman, J. Appl. Phys. 52, 7182 (1981).
- Martyna et al. (1994) G. J. Martyna, D. J. Tobias, and M. L. Klein, J. Chem. Phys. 101, 4177 (1994).
- Becker et al. (2006) C. A. Becker, M. Asta, J. J. Hoyt, and S. M. Foiles, J. Chem. Phys. 124, 164708 (2006).
- Pedersen (2013) U. R. Pedersen, J. Chem. Phys. 139, 104102 (2013).
- Fernandez and Harrowell (2004) J. R. Fernandez and P. Harrowell, AIP Conf. Proc. 708, 496 (2004).
- Lechner and Dellago (2008) W. Lechner and C. Dellago, J. Chem. Phys. 129, 114707 (2008).
- Coslovich and Pastore (2007) D. Coslovich and G. Pastore, J. Chem. Phys. 127, 124505 (2007).
- Pedersen et al. (2016) U. R. Pedersen, L. Costigliola, N. P. Bailey, T. B. Schrøder, and J. C. Dyre, Nat. Commun. 7, 12386 (2016).
- Pedersen et al. (2008) U. R. Pedersen, N. P. Bailey, T. B. Schrøder, and J. C. Dyre, Phys. Rev. Lett. 100, 015701 (2008).
- Bailey et al. (2008) N. P. Bailey, U. R. Pedersen, N. Gnan, T. B. Schrøder, and J. C. Dyre, J. Chem. Phys. 129, 184507 (2008).
- Dyre (2014) J. C. Dyre, J. Phys. Chem. B 118, 10007 (2014).
- Bøhling et al. (2012) L. Bøhling, T. S. Ingebrigtsen, A. Grzybowski, M. Paluch, J. C. Dyre, and T. B. Schrøder, New J. Phys. 14, 113035 (2012).
- Ingebrigtsen et al. (2012) T. S. Ingebrigtsen, L. Bøhling, T. B. Schrøder, and J. C. Dyre, J. Chem. Phys. 136, 061102 (2012).
- Schrøder et al. (2011) T. B. Schrøder, N. Gnan, U. R. Pedersen, N. P. Bailey, and J. C. Dyre, J. Chem. Phys. 134, 164505 (2011).
- Tarjus et al. (2004) G. Tarjus, D. Kivelson, S. Mossa, and C. Alba-Simionesco, J. Chem. Phys. 120, 6135 (2004).
- Sastry et al. (1998) S. Sastry, P. G. Debenedetti, and F. H. Stillinger, Nature 393, 554 (1998).
- (49) S. Sastry, unpublished.
- Yanagishima et al. (2017) T. Yanagishima, J. Russo, and H. Tanaka, Nat. Commun. 8, 15954 (2017).
- Pimpinelli and Villain (1998) A. Pimpinelli and J. Villain, Physics of Crystal Growth (Cambridge University Press, Cambridge, UK, 1998).
- Jackson (2004) K. A. Jackson, Kinetic Processes (Wiley-VCH, 2004).
- (53) T. Ingebrigtsen and P. Royall, unpublished.