Dissipative structures in magnetorotational turbulence
Abstract
Via the process of accretion, magnetorotational turbulence removes energy from a disk’s orbital motion and transforms it into heat. Turbulent heating is far from uniform and is usually concentrated in small regions of intense dissipation, characterised by abrupt magnetic reconnection and higher temperatures. These regions are of interest because they might generate non-thermal emission, in the form of flares and energetic particles, or thermally process solids in protoplanetary disks. Moreover, the nature of the dissipation bears on the fundamental dynamics of the magnetorotational instability (MRI) itself: local simulations indicate that the large-scale properties of the turbulence (e.g. saturation levels, the stress-pressure relationship) depend on the short dissipative scales. In this paper we undertake a numerical study of how the MRI dissipates and the small-scale dissipative structures it employs to do so. We use the Godunov code RAMSES and unstratified compressible shearing boxes. Our simulations reveal that dissipation is concentrated in ribbons of strong magnetic reconnection that are significantly elongated in azimuth, up to a scale height. Dissipative structures are hence meso-scale objects, and potentially provide a route by which large scales and small scales interact. We go on to show how these ribbons evolve over time — forming, merging, breaking apart, and disappearing. Finally, we reveal important couplings between the large-scale density waves generated by the MRI and the small-scale structures, which may illuminate the stress-pressure relationship in MRI turbulence.
keywords:
accretion, accretion disks — MHD — turbulence — magnetic reconnection1 Introduction
The turbulent angular momentum transport observed in sufficiently hot or ionised accretion disks is most plausibly supplied by the magnetorotational instability (MRI; Balbus and Hawley 1991, 1998). By permitting material in the disk to accrete, MRI turbulence drives the intense luminosity of numerous astrophysical sources, AGN most notably, while regulating the growth and evolution of the central object. Meanwhile, it influences several separate processes, such as planet formation, outflows, outbursts, warping, and magnetic flux transport (e.g. Nelson and Gressel 2010, Fromang et al. 2013, Gammie 1996, Latter and Papaloizou 2012, Ogilvie 1999, Guilet and Ogilvie 2012).
In the process of transporting angular momentum and mass, the MRI’s turbulent stress extracts energy from the orbital shear which, after tumbling down a turbulent cascade, degrades into heat by Ohmic and viscous dissipation. At least in thin disks, the preponderance of this energy is radiated away, to be intercepted by astronomical instruments. For many purposes, the details of the thermalisation of orbital energy is unimportant and an alpha viscosity model suffices to reproduce the disk’s broad-brush features (accretion, structure, spectra, etc). However, there are applications and contexts for which we might want to probe a little deeper.
To begin, turbulent heating is rarely uniform, with intense dissipation (reconnection, in particular) taking place in localised regions (e.g. sheets and vortices) and almost no dissipation in the large volumes between (e.g. Uritsky et al. 2010). Rapid reconnection in these regions could produce unexpectedly energetic and non-thermal emission, which might relate to observed variability, flares, and even particle acceleration (McClintock and Remillard 2006, Belloni 2010, Yuan and Narayan 2014). The low filling factor of dissipation also means narrow filaments of gas can be significantly hotter than their surroundings. Thus spatially and temporally intermittent dissipation in protoplanetary disks might provide a way to thermally process chondrule-precursors in gas that is too cool on the average to do so (e.g. McNally et al. 2013).
More generally, the issue of dissipation is important in establishing how the MRI operates. Recent local simulations show that large-scale features of the turbulent flow depend on the short dissipative scales, especially in the absence of net-flux magnetic fields. Saturation levels, the magnitude of alpha, and the pressure-stress relationship all appear to depend on the size of the magnetic Prandtl number and whether explicit diffusion is used or not (Fromang and Papaloizou 2007, Fromang et al. 2007, Simon et al. 2009, Riols et al. 2013, Meheut et al. 2015, Ross et al. 2016, Ryan et al. 2017). It is yet unclear if this non-locality in wavenumber space carries over to realistic astrophysical flows, where the separation of scales is vast compared with what is possible in simulations (see discussion in Lesur and Logaretti 2011). It is hence essential to understand physically the interaction between the small and large scales in simulations so as to help us understand this issue better.
We undertake local box simulations of the MRI using the finite-volume Godonov code RAMSES (without its AMR capabilities) (Fromang et al. 2006). Our focus is the characterisation and evolution of dissipative structures, and so we describe their geometry and heating intensity at given instants (snapshots), and how these properties vary over time. We also make a start exploring their relationship with compressibility. To perform the analysis we adopt the techniques and diagnostics developed by Uritsky et al. (2010), Zhdankin et al. (2013), Momferratos et al. (2014), and Zhdankin et al. (2015a, 2015b). Recently, Zhdankin et al. (2017; hereafter ZWBL17) presented similar results but for an incompressible gas and mean magnetic field; they also restricted themselves to a ‘spatial analysis’, i.e. to snapshots. We generalise these results to compressible flow (thus bringing in an explicit outer scale, the disk thickness ) and zero-net-flux fields. We also track the evolution of dissipative structures over time.
Our simulations show that these features exhibit a characteristic geometry akin to thin ribbons, elongated in azimuth, but canted at some angle . While the thinness and width of the ribbons are small and controlled by the diffusivities, their length can be remarkably large, with an average . In our simulations, dissipative structures are hence meso-scale, and not necessarily tiny nor neglectable. In particular, their elongation may present an avenue whereby small-scale dissipation influences the large-scales. Moreover, intense heating events associated with the biggest structures may have observable consequences, possibly exciting low-level variability in luminosity. Separately, we construct statistics and scaling laws for the heating rate, which accord with those derived from reduced MHD (RMHD), in agreement with ZWBL17; though the majority of our simulations are zero-net-flux simulations, strong azimuthal fields do develop that can function locally as a guide field for the small-scales.
The hot dissipating ribbons of gas are dynamic in time — forming, merging, breaking apart, and evaporating. The longest-lived structures tend to be the biggest, and during an orbit can dissipate considerable energy, potentially causing significant temperature inhomogeneities. The largest structures start breaking up midway through their lives, possibly through the action of instabilities of Kelvin-Helmholtz or tearing type (Loureiro et al. 2007, 2013). We also uncover intriguing couplings between the dissipating ribbons and both small-scale acoustic waves and large-scale density waves. Of special interest is how the passage of a density wave through a structure intensifies heating within it, while concurrently distorting the wave. This is a clear example of how small-scale dissipation and large-scales can interact.
The paper is organised as follows. The model equations, numerical approach, and setup are presented in Section 2. Significant space is devoted to the diagnostic tools developed by Zhdankin et al. (2013, 2015b) which we use to identify dissipative structures, characterise their spatial properties, and track them over time. Sections 3, 4, and 5 present our results, which are split into a spatial analysis of structures at given moments, a temporal analysis which describes their evolution, and a brief exploration of their relationship with shocks and density waves. We draw our conclusions in Section 6.
2 Governing equations, numerical tools, and diagnostics
2.1 Formulation
We wish to explore the essential small-scale features of the turbulent flow and so we adopt an idealised local set-up, the shearing box model (Goldreich & Lynden-Bell 1965, Latter & Papaloizou 2017). It describes a small Cartesian chunk of disk embedded near the midplane where locally the differential rotation appears as a linear shear flow plus rotation, and the vertical gravity of the central object can be omitted. The angular frequency vector of the corotating frame is . As is customary, are the radial, azimuthal, and vertical spatial variables in the shearing box, and , , are the corresponding unit vectors. The gas located in the shearing sheet is governed by the equations of compressible MHD:
| (1) | ||||
| (2) | ||||
| (3) |
where is the mass density, is the velocity, is the gas pressure, and is the magnetic field. The (molecular) viscous stress is given by
and is the constant kinematic viscosity. The constant magnetic diffusivity is .
For most of the simulations in this paper these equations are closed by the isothermal equation of state , with the constant isothermal speed of sound. However, the small set of simulations shown in Section 5 are diabatic with the internal energy determined from
| (4) |
where viscous and Ohmic heating is represented by and cooling by , a simple relaxation law , where, is the adiabatic index, is a relaxation timescale, and is the pressure the system wants to cool to, chosen so that the quasi-steady turbulent state settles on a temperature approximately equal to the initial temperature. The relaxation time is set to . In this case we adopt an ideal gas equation of state, and so .
2.2 Numerical methods and set-up
All of the simulations that we perform are carried out using RAMSES, a finite-volume Godunov code based on the MUSCL-Hancock algorithm (Teyssier 2002; Fromang et al. 2006), but with its AMR capabilities disabled (i.e. the ‘Dumses’ version). We employ the HLLD Riemann solver (Miyoshi & Kusano 2005), and the multidimensional slope limiter described in Suresh (2000). For further details of our numerical scheme see Ross et al. (2016).
For the all the simulations shown, we used a box size of with a resolution vector of where . The scale height of the disk is . The grid lengths are denoted by , , and .
Three initial configurations of magnetic field were trialled: (a) zero net-flux, for which , (b) net-toroidal flux, , and (c) net-vertical flux, . To induce the MRI we introduce random velocity perturbations in all principle directions with amplitudes . We choose code units so that and . Thus the plasma beta in code units is .
The relative sizes of viscous and Ohmic diffusion are quantified by the Reynolds and magnetic Reynolds numbers: and . The magnetic Prandlt number is defined to be their ratio: Pm= Rm/Re. In previous work a resolution of 128 is deemed adequate for Reynolds numbers of roughly 6000, and a resolution of 256 for numbers twice that (e.g. Fromang et al. 2007). However, it is likely that even better resolution is necessary to accurately describe small-scale dissipative phenomena (as opposed to quantities like ). We note that ZWBL17 employ grid zones to represent simulations with . However, to completely mitigate grid pollution, we employ much lower Reynolds numbers, taking Rm=5000 and Pm=4. (Another consideration is that finite volume codes are less accurate than spectral codes for a given resolution.)
The results of five simulations are presented. Three are zero-net-flux simulations with resolutions , 128, and 256, labelled ‘znf64’, ‘znf128’, and ‘znf256’. A single vertical-net-flux simulations is shown with and , labelled ‘vert128’, and a toroidal-net-flux simulation with and , labelled ‘tor128’.
2.3 Spatial characterisation of dissipative structures
We outline the main diagnostics to (a) identify coherent dissipative structures in the simulations, and (b) measure their fundamental properties. In this subsection we deal with the extraction and analysis of these structures at fixed times, i.e. at snapshots. In the subsequent subsection we describe how to analyse their temporal evolution. The method follows that of Zhdankin et al. (2013, 2015b).
2.3.1 Identification
The single most important part of the analysis is to distinguish, within the disordered turbulent flow, coherent spatially connected regions of the fluid that dissipate at a level far greater than the average. These special blobs of fluid we identify as dissipative structures, the regions in which most of the turbulent energy is thermalised.
To begin, we quantify the local resistive and viscous dissipation by and . In a given snapshot it is possible to compute the spatial means of these dissipation rates, and , respectively, in addition to their standard deviations and . We next construct the quantities
| (5) |
which are the Ohmic and viscous dissipation rates greater than their respective means by -sigma, where is a free parameter we can choose. These quantities serve as the boundaries above which we deem a dissipative structure to be active. Formally, a region, or structure, of high dissipation is then defined to be a spatially connected set of points that satisfy one or both of the conditions
| (6) |
In practice we only use the first condition, as Ohmic dissipation in MRI turbulence is so dominant.
Within our simulation code, we have written an algorithm that at any given instant, computes both and and by applying (6) thus identifies all the grid points of high dissipation. Coherent spatially adjoining points we group together and identify as a dissipative structure. To distinguish the coherent structures, we index them with an integer, , and represent them by , a spatially connected set of points (grid cells). Note that the algorithm takes into account the periodicity of the domain: a structure on the boundary is matched with a structure at the spatially identified points on the opposite boundary.
Lastly, we impose an additional filter to screen out tiny short-lived structures the size of a few grid-cells. These we regard as artifacts of the grid, and probably due to insufficient resolution. Structures of a width below some threshold , are discarded from the analysis. See below for a quantitative definition of a structure’s ‘width’.
2.3.2 Structure analysis
Once the structures have been identified, various measurements can be made that outline their geometry and other properties.
First, we define the primary ‘length’ of a structure, , the maximum distance between two points in :
| (7) |
with associated vectors and . Here, the maximum is with respect to the Eulerian distance. The subscript refers to the th structure. Unless otherwise stated, will refer to the length of the structure and not the box size.
Second, we measure the ‘width’ of the structure, defined as the longest distance between two cells in whose separation vector is perpendicular to :
| (8) |
with associated vectors and
Finally, the longest direction perpendicular to both the width and length can be defined through:
| (9) |
with associated vectors and . This is referred to as the ‘thickness’.
In addition to these quantities, we measure the volume , area , and power dissipated by each structure :
| (10) | ||||
| (11) | ||||
| (12) |
where , and are the number of exterior faces of cell and recall that are the grid lengths.
2.4 Temporal characterisation of dissipative structures
We now present diagnostics and ideas to help understand how the structures identified in the previous subsection evolve over time and interact. This requires not only the identification of a structure at a given time, but also the identification of the same structure at adjacent times, as it moves and changes. Note that finite data storage restricts the number of outputs (snapshots), putting limitations on any temporal analysis. Only moderate cadences and durations can be analysed for high resolution simulations.
At any instance in time, once structures are extracted and measured, they must be related to the structures identified in the previous snapshot, through a mapping which need not be bijective (due to merging and dividing, for example). Therefore, the cadence must be sufficiently high for this process to be possible. However, this can only be an approximation and grid-sized structures are problematic to track. Larger and longer lived features, however, can be characterised adequately. The time increment between outputs is referred to as .
2.4.1 Terminology and procedure
Following Zhdankin et al. (2015b), we use the following terminology. A ‘state’ is an individual spatial structure at a fixed time. A ‘path’ is a sequence of states over time, describing the evolution of what we regard as the same coherent structure with no merging or division. The states within a path hence may be connected by a bijective mapping, except at the endpoints of the path. A ‘process’ is a collection of paths that are connected at their endpoints, and thus corresponds to a group of dissipative structures that interact over time. Finally, a ‘complete path’ is one whose existence (formation and destruction) is contained within the duration of our temporal analysis.
Suppose we have snapshots of our turbulent flow, each taken apart in time. The basic method to identify paths and processes is as follows. In each snapshot we conduct the spatial characterisation described in the previous subsection, i.e. we identify and characterise all the states (i.e. dissipative structures). We then, at each snapshot , construct a ‘state map’, by which each structure in that snapshot is identified with a structure in the previous snapshot, . This is effected rather crudely: a structure, , in is identified with a structure, , in if contains a grid cell that is in or adjacent to a grid cell contained in . Having done that, we can construct path segments, with the path ending when the bijectivity of the state maps breaks down. At these break-downs we can then identify which paths are connected and construct ‘path maps’, which permits us to identify processes as the sum of connected paths.
2.4.2 Measurements
The bijectivity of paths makes their analysis substantially easier than the analysis of processes. The temporal evolution of the state parameters can be calculated , and over the duration of their home structure
| (13) |
where is the number of constituent states, and and are times at the final and initial states. From the energy dissipation rate the total energy dissipated by the path can be calculated
| (14) |
Another useful measurement is the peak of a state quantity along the path i.e.
| (15) |
where represents any of the measurements. These are however sensitive to chaotic fluctuations so must be used with care.
Process properties are more difficult to calculate. Consider a given process with constituent paths with labels , each with initial and final times and . Let be the total energy dissipated by path and be the peak of a state quantity along path . The duration of the process is given by
| (16) |
The total energy dissipated by a process is found by summing over the constituent paths
| (17) |
The peaks of the measurement parameters can also be calculated over the whole process
| (18) |
3 Results: spatial analysis
3.1 Intermittency
Before we extract and characterise individual dissipative structures we provide quantitative measures of their intermittent nature. As is well-known, turbulent energy is thermalised primarily in narrow localised regions and in short bursts, not uniformly in space and time. In this subsection we focus only on spatial intermittency.
The dissipation fractions associated with Ohmic, viscous, and total heating are plotted against volume fraction in Figure 1. The simulation in question is znf256, and the measurements were taken after at least 20 orbits, once the turbulence had settled down into a steady state. The fractions are calculated by fixing , determining the total dissipation and volume of all identified structures (see Section 2.3), then iterating through a range of at a given snapshot. Finally we average over multiple snapshots.
Figure 1 tells us that approximately twice as much energy is dissipated by Ohmic heating than by viscous heating, as is expected from MRI turbulence — partly because greatly exceeds . Moreover, the shapes of the Ohmic and viscous dissipation profiles differ: Ohmic dissipation rises rapidly at the origin before plateauing, while viscous dissipation rises less steeply. Ohmic heating is thus more spatially intermittent: of the Ohmic dissipation occurs within of the volume. One expects that as the Reynolds numbers increase, dissipation becomes even more concentrated, and indeed at , ZWBL17 find that of Ohmic dissipation takes place in of the volume. No doubt there exists a scaling relation connecting the latter fraction with Rm (for given Pm), but this is numerically inaccessible at the moment. Nonetheless, the main qualitative point to take away is quite clear: dissipation in MRI turbulence is inhomogeneous, and will potentially generate extremely narrow regions of hotter gas floating in a much larger expanse of cooler gas.
Finally we compared the total dissipation fraction curves produced by znf256 and the less well-resolved znf128 and found excellent agreement. This indicates that grid dissipation contributes negligibly to the formation and behaviour of identified dissipative structures (for the Re and Rm chosen). However, in znf256 if we compare the total energy injection rate (via the action of the turbulent stress on the Keplerian shear) against the total Ohmic and viscous dissipation rate, we find a shortfall of roughly . We conclude that this anomalous heating arises primarily from grid dissipation in shocks. Because this dissipation route is subdominant we do not address it further in this paper, but we note that shock heating’s contribution to the energy budget may be important in the faster flows associate with strong net magnetic fluxes.
3.2 Current sheets
We next look at individual structures. We primarily use the zero-net flux simulations znf256, and an extraction threshold , similar to values in previous studies (Zhdankin et al. 2015b, 2016) In addition, we checked that our main results are relatively robust with respect to , for threshold values , at least for the resolution and Reynolds numbers we use. Individual structures are extracted at distinct times (‘frames’) each separated by an orbit. As most structures have lifetimes less than an orbit this means we rarely count the same structure twice (and even then if we have it will have evolved significantly from when it started).
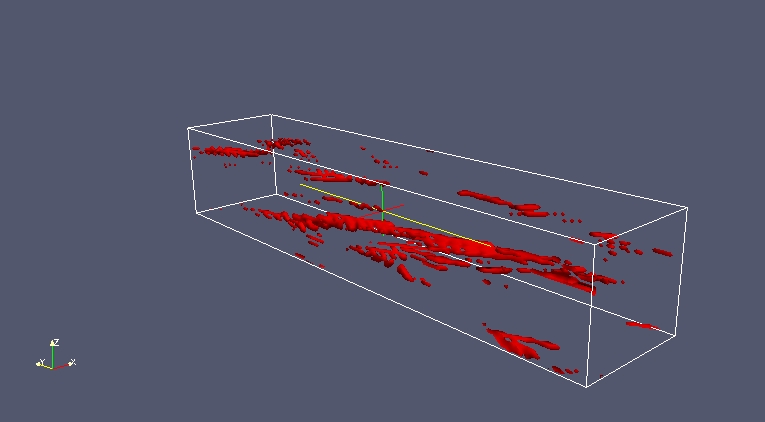
To illustrate the results of the extraction, in Figure 2 we plot , a proxy for , along with identified structures in and slices from znf256. A rendering of these dissipating filaments and ribbons is shown in Figure 3. (Note that in order to make them easier to see, these figures have been prepared with a smaller .) In the next few subsections we discuss several aspects of these features.

3.2.1 Geometry
A cursory glance at Figures 2 and 3 show that the dissipative features are elongated and oriented along azimuth direction, but canted by some small angle. This is due, presumably, to shearing out by the differential rotation. Their geometry can be quantified through the vector .
In Figure 4 we show the projection of on the and planes for multiple structures. is found to be largely aligned along , with a small offset in . Their projections onto are typically small, especially for the longest structures with . We define a tilt angle, , with respect to
| (19) |
In our znf128 and znf256 simulations, we find , where the average is taken over all structures. This is consistent with, but slightly smaller than, the magnetic field correlation tilt angle calculated by Guan et al. (2009).


In Figure 5 we plot probability distribution functions (PDFs) of and . These curves are dominated by a great many small structures that emerge and disappear rapidly. However, there is a distinct plateau in both curves at lengths above the grid scale. Mean values for and are and respectively. The former is well separated from the azimuthal box size (the relevant numerical outer scale) and the physical diffusion lengths, whereas the latter is well separated from the grid , and probably controlled by the diffusivities. The large average length of the dissipative structures is remarkable. It indicates that dissipation in MRI turbulence occurs in regions that are meso-scale, of order or less than the disk scale height. These ribbon-like features possess widths and thicknesses controlled by the diffusivities, and in reality are extremely thin, but at the same time are significantly elongated in azimuth. The fact that the mean is well separated from the outer and diffusion scales gives us hope that this basic result is independent of the numerical particulars of our simulation.
Figure 6b plots against for all extracted structures in znf256. While , there appears to be an approximate linear correlation between the two variables: the longer the structure, the wider the structure. Next, If we assume that the dissipative structures are in the form of sheets, with length , width and thickness and take , then the area of a structure will be approximately given by . In Figure 6c we plot against and indeed find there to be a linear correlation between and . For smaller , the ends of the structures give a non-negligible contribution to .
In contrast to and , there is no clear scaling between the thickness and the length or width, as Figure 6d makes clear. The range in thickness is also smaller than the other dimensions, though still roughly an order of magnitude greater than the grid.
3.2.2 Dissipation
In Figure 6a we plot the power dissipated by a structure against the length of the structures, and this reveals a strong correlation between the two measurements with approximately . If we assume the power dissipation is uniformly distributed within a structure, then this scaling can be achieved using a similar argument to earlier. The larger power dissipated in larger structures is purely a geometrical effect: larger structures dissipate more not because they are more intense, but because they are simply larger. This is another important point uncovered by our simulations.

To further illustrate this, in Figure 7 we plot the magnetic dissipation rate against the volume of the structures. The power dissipated is found to be proportional to volume, i.e. the dissipation rate per unit volume is nearly a constant, as expected. This constant is dependent on the energy of the flow and the Reynolds numbers. We calculate to be for znf256, where the angled brackets denote averaging over all current sheets.

The scalings obtained from our highest resolution simulations appear to be compatible with those associated with incompressible, nonshearing, nonrotating, forced RMHD simulations (Zhdankin et al. 2016) even though our simulations possess no imposed external magnetic field and the flow is compressible. In the MRI simulations, however, the shearing motion stretches any radial field into a strong toroidal field which can then play a similar role to the guiding field in RMHD. It is also worth noting that isothermal zero net-flux MRI simulations are only mildly compressible with only variations in density. These results suggest that dissipation in MRI turbulence is not special to the MRI —- the features are comparable to other MHD systems. A similar conclusion was reached by Walker et al. (2016).
Zhdankin et al. (2014) observed that the probability distribution of the dissipation rate of structures in MHD turbulence tends towards a power law with an index of as the Reynolds numbers are increased. Remarkably, this value is the critical index at which weak and strong structures contribute equally to the total energy dissipation (Hudson 1991): the relatively large number of weakly dissipating structures balances out the fact that they are only weakly dissipating, hence they make a contribution to the total energy budget that is comparable to the strongly dissipating structures. In Figure 8a we plot the probability distribution of for znf256 along with a curve with the critical index. For an intermediate band of , the probability distribution function is compatible with a power law distribution with an index close to . In Figure 8b, we plot the probability distribution function multiplied by , to better reveal the scaling. Note that there is a drop off in power at high . It is possible that this is due to insufficient statistics for these infrequent strongly dissipating events. It is evident, nonetheless, that current sheets with a considerable range in dissipation rates contribute significantly to the total magnetic energy dissipated.


Finally, the compensated energy dissipation rate provides a means of determining upon which spatial scale the energy is being dissipated. Let be the total energy dissipation rate for structures with scales between and where is any characteristic scale. Then the maximum of the compensated energy dissipation rate, , gives the value of at which most of the energy dissipation occurs. In Figure 9 we plot this function for . First, consider . There is a tendency for the energy to be dissipated at the longest of scales, . A similar trend is also suggested by . Zhdankin et al. (2016) also observe this feature in their RMHD simulations. If our results generalise to higher Reynolds numbers, dissipation is not necessarily on small scales as one might expect. If strongly dissipating structures possess , they may interact with other large-scale elements of the flow.
3.3 Net-flux simulations
It is worth asking whether there is a notable difference between simulations with a net field and those without. Here we attempt to explore the question by considering setups with imposed vertical and toroidal fields. To suppress strong channel flows we use a relatively modest for the net-vertical simulation , whereas in the toroidal field simulation we set . The resolution in both is .
We find the inclination angle of the toroidal field simulation to be which is comparable to the zero net flux simulations, however the vertical field simulation has a lower value, . The latter contrasts with ZWBL17 who obtained a larger tilt angle of . Either the selection criteria for choosing their structures differs to ours or, possibly, .
We calculate the dissipation rate probability distribution function for the two net-flux simulations and an identical zero-net-flux simulation. In all three simulations the power law index of the distribution is approximately for over two decades in , as shown in Fig. 8. Hence the energy is dissipated evenly over this range, which is in good agreement with ZWBL17.
For this modest choice of plasma , the presence of an imposed field appears to only have minimal impact on the current sheets. Instead their properties are largely determined by the dissipative coefficients and the shear. Zero-net-flux simulations generate their own local net which works like an imposed field, as far as dissipative structures are concerned and at least for structures not too elongated. If a strong net vertical field is imposed, then differing results are expected due to the strong channel modes that develop.
4 Results: temporal analysis
We now address a number of questions regarding the structures’ evolution over time. How long, on average, do they persist and how does this depend on their geometric properties? How do these properties evolve over time and within a given path? How does the dissipation rate vary over time? And finally, what degree of dynamical interaction takes place between nearby structures?
This task is considerably more computationally challenging than the spatial analysis, primarily due to the large amount of data to be processed when a high frame cadence is used. As a consequence, very few studies exist, the most notable being Zhdankin et al. (2015b) for forced incompressible MHD, and Yang et al. (2017) for forced compressible MHD. In order to make any progress, we present a limited survey using lower resolutions than earlier, but yet sufficient to make some ground-level points. Our resolution in this section is , mainly using simulation znf64, and the time step between outputs is taken over an interval of size , where is an orbital period. This interval is taken some 20 orbits after the simulation begins, so as to ensure that we have reached a statistically steady state.
4.1 Individual processes
First we concentrate on the longest processes, which typically survive for roughly an orbit and a half. Figure 10 presents 3D snapshots describing the evolution of one such process, composed of its various paths merging, bifurcating, and disappearing. In Fig. 11 we plot the time evolution of , and for the longest two processes. As one can see, over the course of their lifetimes these features grow in size, and in dissipative intensity, before shrinking, disassociating, and ultimately evaporating. Superimposed upon this general trend are short scale variations, some of which we attribute to acoustic waves (see Section 5). The three properties, and , track each other fairly well, although there are slight deviations. In particular, the volume and the power dissipation rate of the processes evolve together, which indicates that the dissipation rate per unit volume is nearly constant throughout the duration of the process. This is consistent with the linear relation that we found in the spatial statistics (cf. Figure 7).
Given the longevity of the most prominent processes, substantial energy can be dissipated during their lifespans, and in optically thick media, where radiative transfer is inefficient, this could induce considerable temperature inhomogeneity in the plasma. In principle, the heating rate per unit volume can be compared to an estimate of the cooling rate via radiative diffusion across the thickness of the current sheet so as to estimate the temperature change within the sheet. Of course, such estimates will be strongly influenced by the thickness of the current sheets, which is determined by ; as a consequence, they will be difficult to apply to realistic systems that are far less resistive than the simulations.
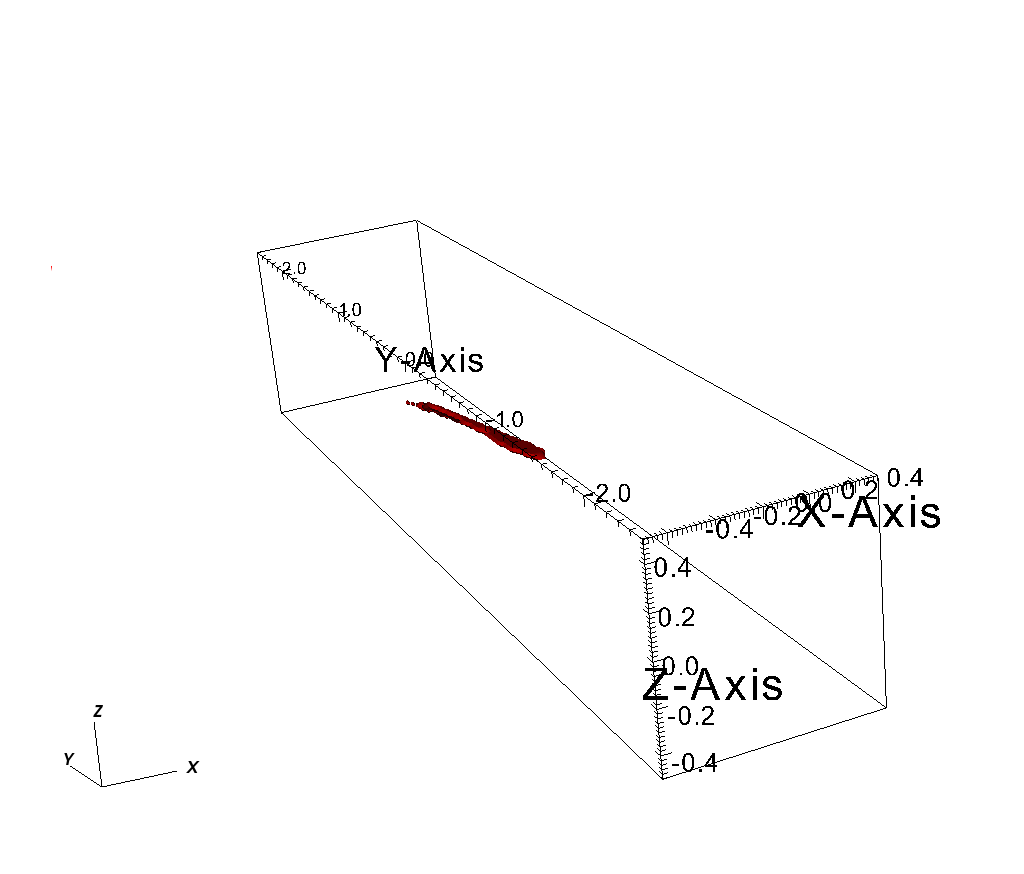
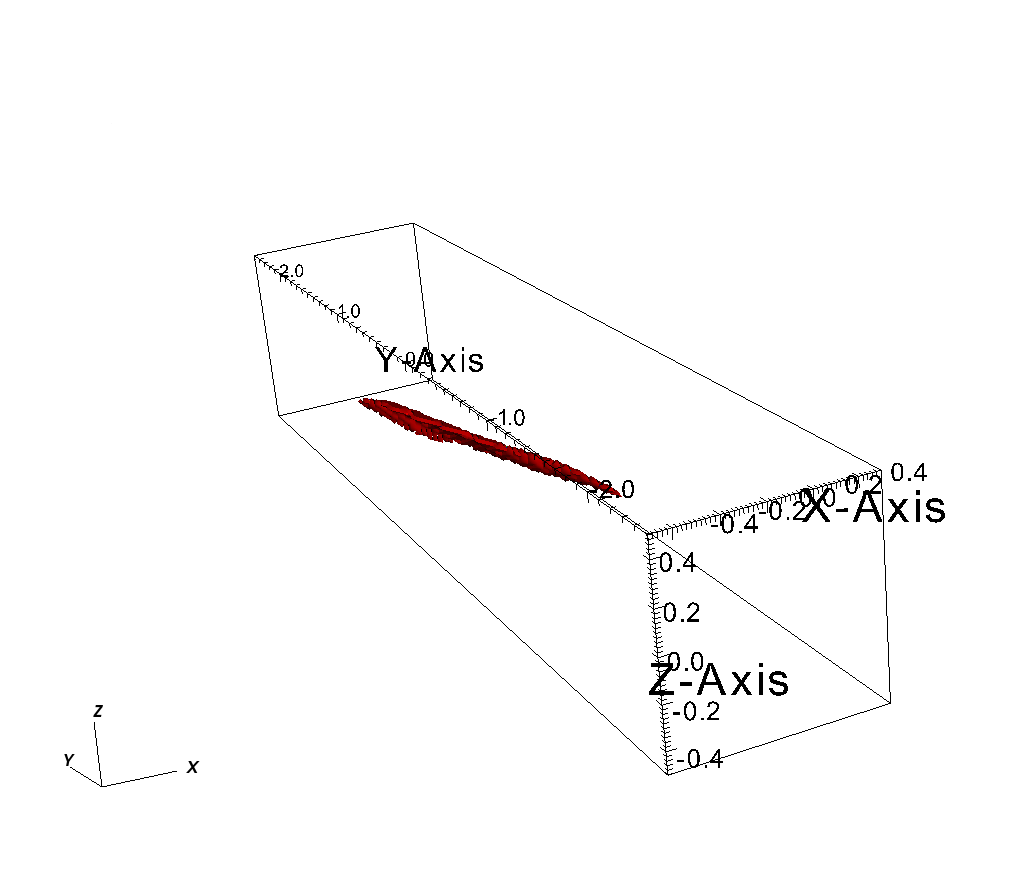
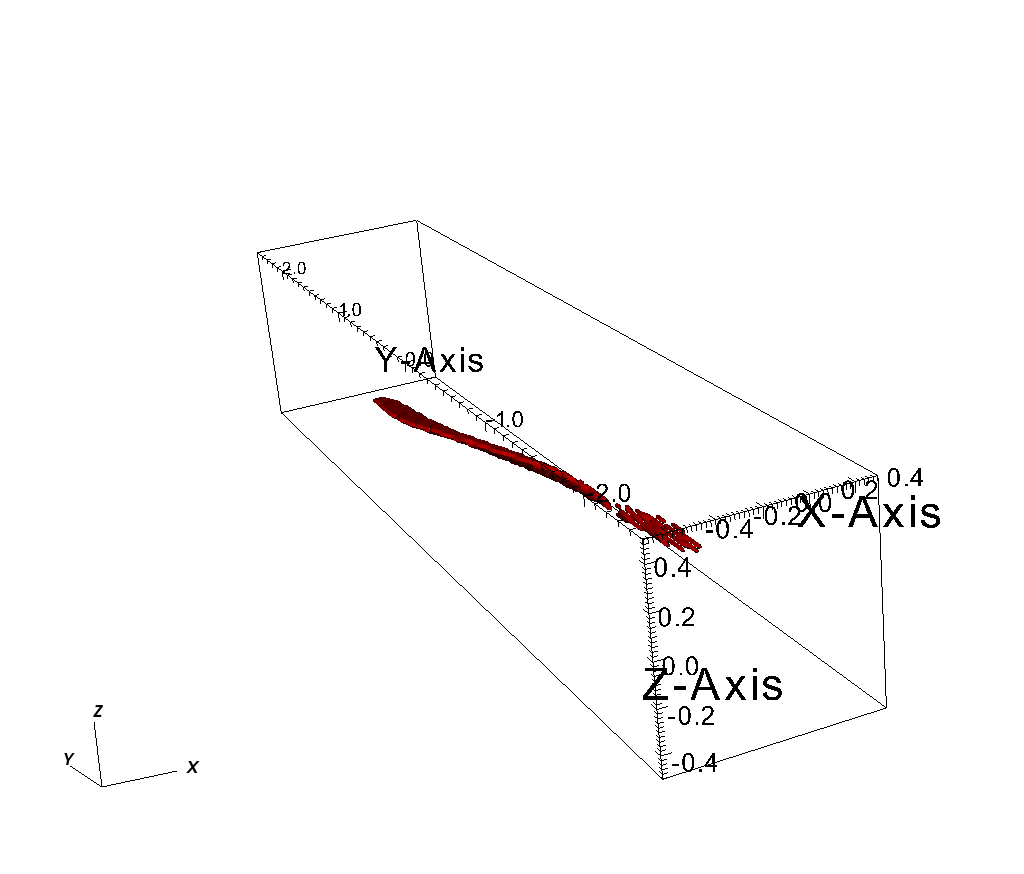
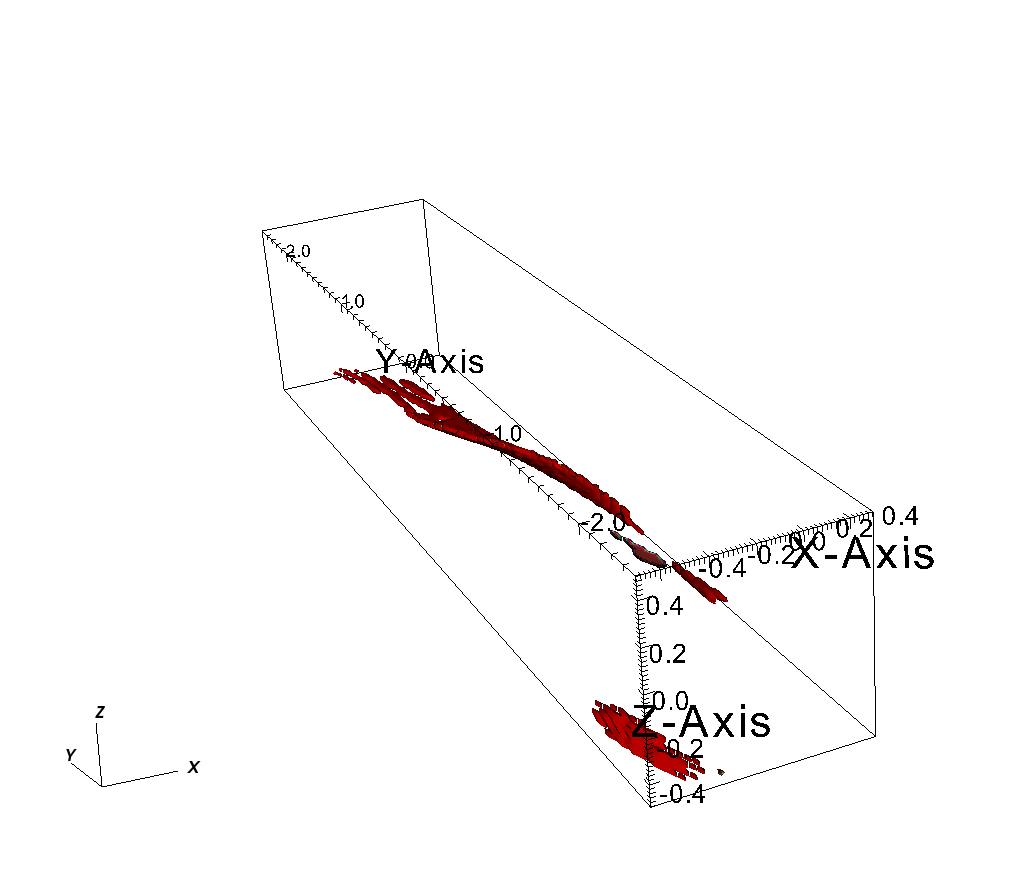
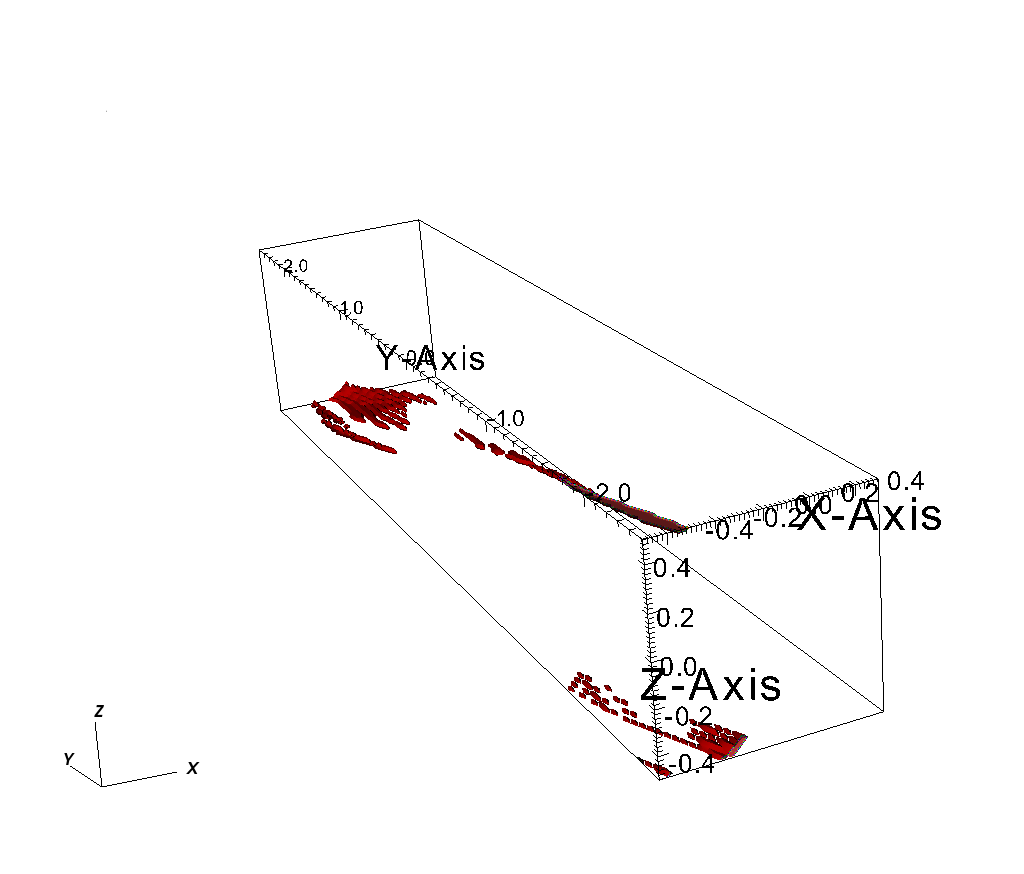
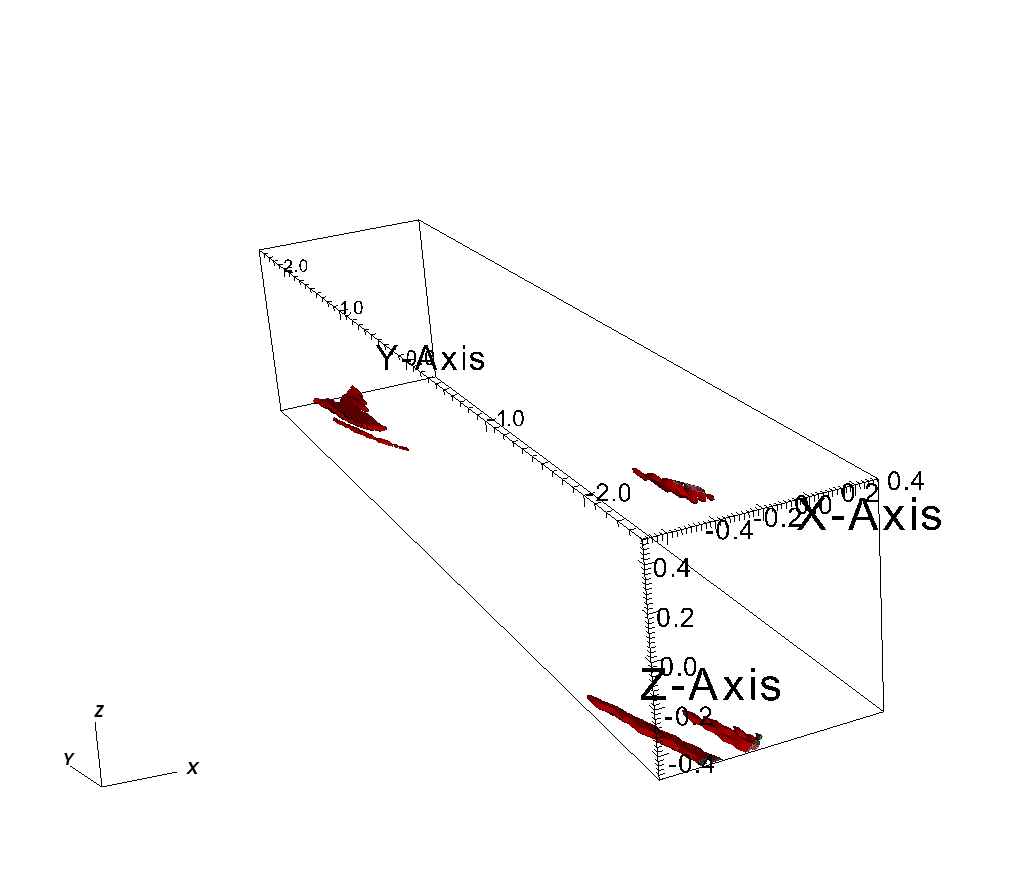

We next explore the dynamical evolution of the component paths in a given process. How many are they, and how do they interact? Figure 12 shows the number of: structures , formations , destructions , divisions , and mergers , as functions of time for the longest process. The volume of and total dissipation in the process is also included. We note that the change in must be equal to .
For the first the process is relatively simple: it is composed of only a handful of structures (), though these are growing in size and thus bringing about a growth in the total volume. During this phase there is a general increase in the dissipation rate. At around , near the peak heating rate, there is a sudden increase in complexity, with spiking at structures. The fifth panel in Figure 10 illustrates this phase. There is a great deal of rapid formation, destruction, division, and merging at this point, indicative of a climactic alteration in the morphology of the process. From this moment the process steadily dies away. This ‘temporal asymmetry’ is also witnessed in forced MHD (Zhdankin et al. 2015b), and it is tempting to attribute the catastrophe at to an instability of some form, possibly of tearing or Kelvin-Helmholtz type (Loureiro et al. 2007, 2013, Samtaney et al. 2009). Regarding the classical tearing/plasmoid instabilities, it would appear that the observed Lundquist numbers and aspect ratios in our simulations are too low for their excitation, but it is possible in our shearing, rotating, turbulent environment these thresholds might be relaxed (see Section 6.2 in Zhdankin et al 2015b). Certainly further work is required to nail down what is going on here, but it is clear the tools of the temporal analysis (appearing in Fig. 10) could provide an insightful way to study instabilities and reconnection in turbulent current sheets.

4.2 Statistics and scaling relations
In the previous subsection we focussed on only two long-lived processes, both enduring for longer than one orbit. But what is the distribution of process lifetimes ? In the lower panel of Figure 13 we plot the lifetime probability distribution function, only including complete processes. The PDF is fitted by a power law distribution with . Clearly long lasting processes are in the minority, with the mean only some 1/100 of an orbit. That being said, during the analysed, we still detect processes that last longer than half an orbit.

We next check if there is a correlation between process duration and peak dissipation rate. In the top panel of Figure 14 we see that there is indeed a correlation between and which translates across to the total power dissipated by a process. The persistence of the processes is therefore closely related to the length and dissipation rate of their component structures. Powerful dissipative events tend to be associated with spatially larger and longer-lived processes. But does the higher energy dissipation overcome the infrequent occurrence of these long lasting processes? To explore this we calculate the compensated energy dissipation rate , defined in a similar way to Section 7.3.2. For , indicating that energy is dissipated relatively uniformly over a wide range of process durations. Therefore, long lasting, coherent processes contribute significantly to the total heating.

5 Density waves and acoustic radiation
Up to now we have explored dissipation by current sheets and turbulent small-scale structures. But what about the compressible element of the problem, in particular the role of acoustic radiation and shocks? In local MRI turbulence (at least with no net flux), this dissipation route heats the gas far less effectively, on the whole, but it is nonetheless important to explore for the following reasons. Pressure appears to be a key determinant in the MRI’s saturation and, consequently, the magnitude of the turbulent viscous stress (Ross et al. 2016). But the relationship between stress and pressure is sensitive to the dissipative particulars of the gas, at least in local box simulations: with explicit diffusion coefficients , but without . Surprisingly, the manner in which diffusion works on the microscales influences the large-scale stress and its relationship to pressure. How and why this is the case is an important outstanding problem. The fact that a good fraction of dissipation occurs in meso-scale, rather than miscroscale, structures (as shown in Section 3), must certainly bear on this question and provides one inroad into thinking about the pressure-stress relationship.
In this section we explore several connections between sound waves and shocks, on one hand, and the dissipative structures, on the other. This work is a first step, and aims to sketch out certain relationships that future studies might pursue; it is no way comprehensive. Also, because our primary aim is explaining the stress-pressure dependency revealed in Ross et al. (2016), we use a similar set-up to that paper. Simulations are diabatic, incorporating viscous and Ohmic heating in addition to a simple cooling law, and we adopt an ideal gas equation of state (see Section 2.1).
5.1 Small-scale acoustic waves
MRI simulations support long-wavelength density waves that continuously propagate through the box (Heinemann and Papaloizou 2009a, 2009b, 2012); an example is shown in Figure 15. But separately to these one can discern short-scale, short-lived, and less organised sound waves. We explore these small-scale waves first.
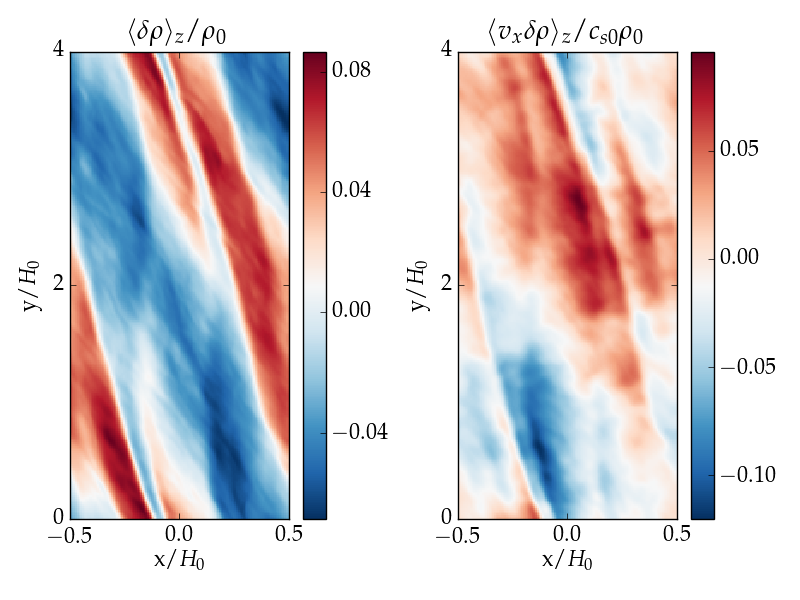
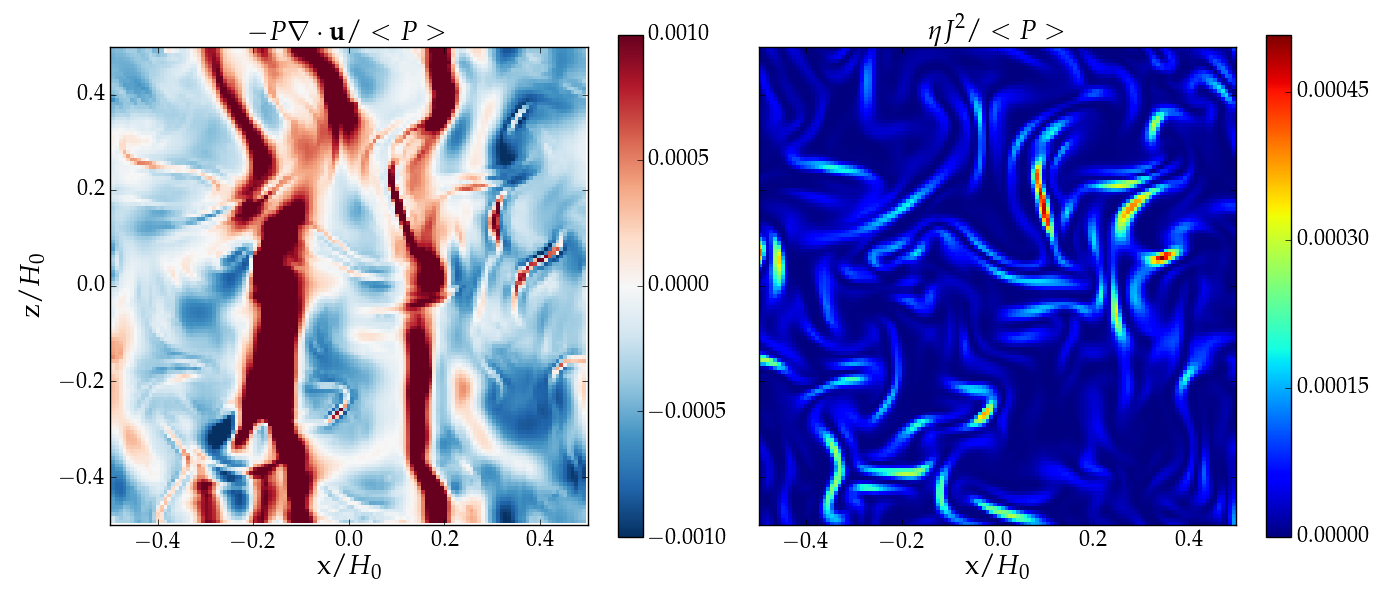
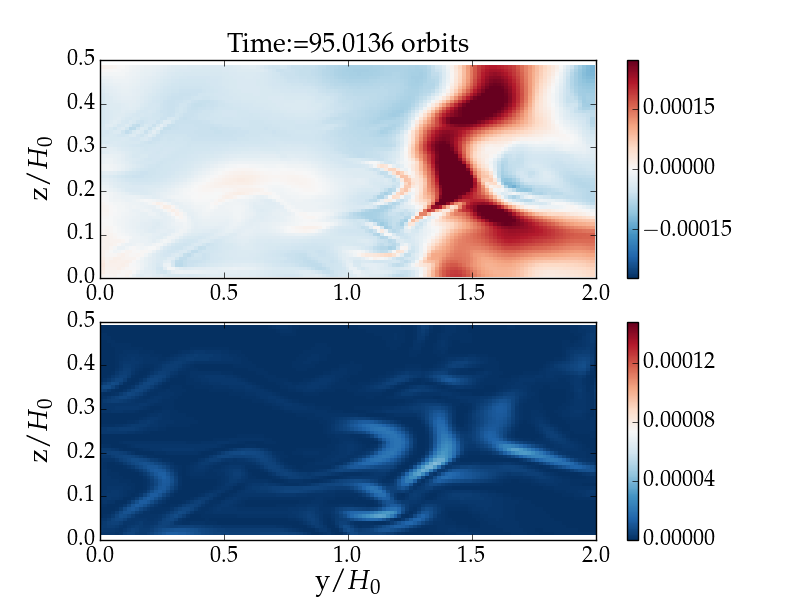
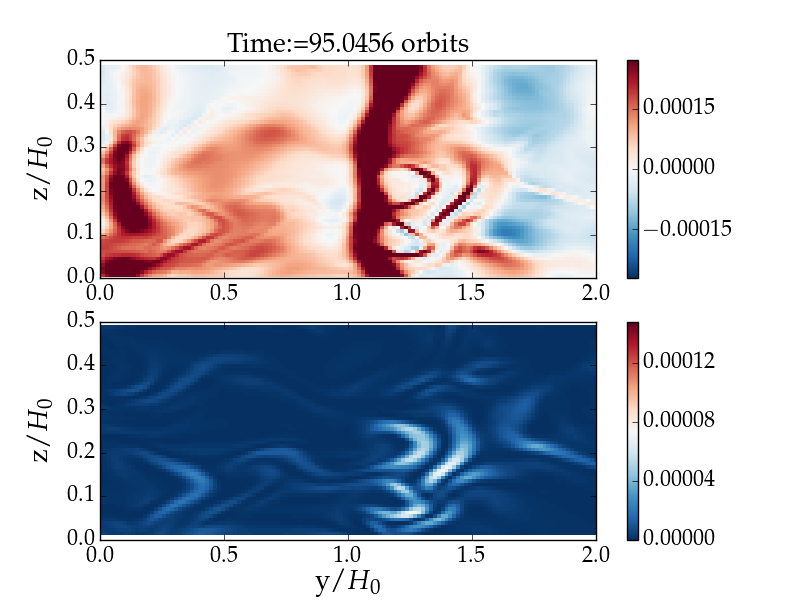
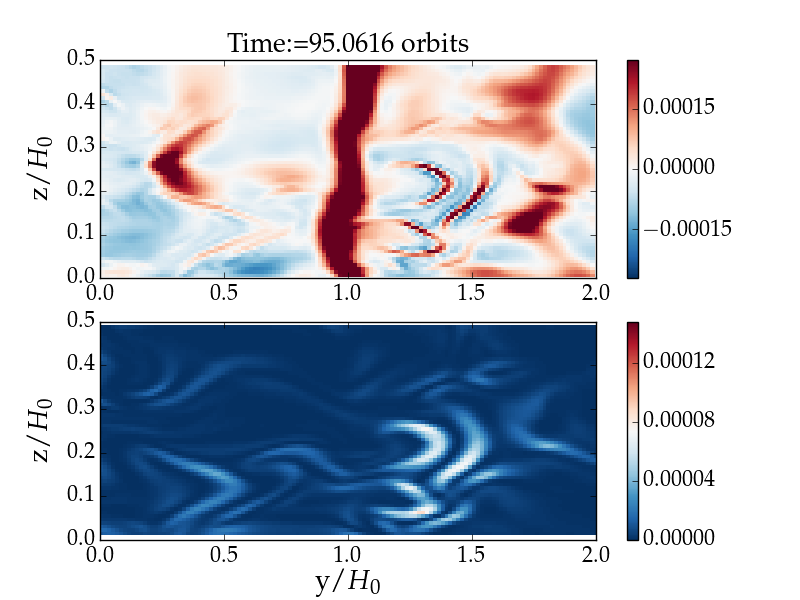
Figure 16 is an -slice showing the pressure work and Ohmic dissipation, both normalised by the instantaneous box averaged pressure. The color scale for the compression work is saturated at to prevent the large-scale density waves dominating the images. These are easy to identify as they possess little vertical structure. If we can ignore these large waves, one can observe a tangle of weaker and shorter-scale filamentary structure in the pressure work. They correspond to small-scale acoustic waves. Interestingly, while there is no correlation between and the large scale shocks, there is a strong correlation between the current sheets and the thin structures in pressure work. These features and their correlations are universal, and not limited to this particular snapshot.
It is possible that the dynamics of the current sheets, especially the reconnection events they undergo, generate the observed small waves. This would be in line with previous work showing that accelerations associated with reconnection excite slow-mode shocks (Priest and Forbes 1986, Birn and Priest 2007, Hillier et al. 2016, Riols and Latter 2016). On the other hand, the waves might also simply result from the merging and splitting of paths. Detailed tracking of individual current sheets should illuminate how these features arise.
In the Solar context, at least, the shocks may provide an effective heating route, though they appear less important here. It is also unclear how these small-scale features impact on the larger-scale properties of the turbulence. Nonetheless they do illustrate one clear connection between MRI dissipation and the compressible element of the flow. Given that the longest and most powerful dissipative structures are meso-scale the importance of their associated shocks should not be immediately discounted.
5.2 Large-scale density waves
Let us now return to the large-scale density waves: given their size they may be more effective at connecting the large-scale features of the flow to the small scales. If we examine Figure 16, one could argue that the current sheets distort the density wave as it passes through. On the other hand we might expect the density wave to impact on the current sheet’s dynamics. When a shock front propagates through a region, the fluid is compressed and magnetic fields clumped by the inflow. Ohmic dissipation and viscous dissipation will then be enhanced, and may lead to stronger pressure work in filamentary structures.
In Figure 17 we show three slices separated by illustrating the passage of a density wave through several current sheets. The top panels show pressure work, while the lower panels show Ohmic dissipation. The primary density wave, clearly represented by the red vertical ‘wall’ in the pressure work, propagates from right to left. In so doing it passes through three distinct ‘boomerang’ shaped current sheets located between and , and which appear as brighter structures in the Ohmic dissipation. As can be observed in the second and third snapshots, the dissipation intensifies as a result of the sheets’ interaction with the wave. Moreover, the interaction results in strong small-scale shocks enveloping the dissipating boomerangs. Though the detailed nature of the interaction is difficult to determine, there is clear evidence of a route by which large-scales interact with small-scale dissipation.
The interaction can be quantified to some extent via the temporal analysis of Section 4.1. Can we detect the passage of density waves in the evolution of a dissipative structure’s key quantities? If we consider a process with radial size between we would expect a modulation in the associated pressure work on a time scale of shear times. Indeed, Figure 11 shows regular modulations consistent with this. Moreover, there is a correlation between the peaks in the dissipation rate (the red curve) and the pressure work (the green curve). This shorter scale variation is superimposed on the slower rise and fall of the dissipation. In fact, it is possible that this longer trend may issue from the cumulative effect of several density waves.
6 Conclusion
Dissipation in MRI turbulence occurs in ribbon-like conglomerates elongated in the -direction and making an angle with the -axis. The average length of the structures are surprisingly large (), with the longest extending for multiple and lasting for up to approximately one orbit. During this time they appear to be attacked by an instability (possibly a Kelvin-Helmholtz or tearing mode), which destroys the conglomerate, breaking it into smaller pieces that subsequently decay. Meanwhile, a network of small-scale shock waves is generated, enveloping the structure. We find clear interactions between dissipative structures and the large-scale density waves that repeatedly pass through the box. While the structures distort the waves, the waves intensify dissipation in the structures, possibly controlling their evolution.
Our spatial results are consistent with ZWBL17, which considers net-flux simulations in incompressible MRI turbulence at Reynolds number much greater than those presented here. The agreement in the main scaling relations across this range of Reynolds numbers hints that they have reached the correct asymptotic regime associated with realistic flows. In addition, the properties of our simulated current sheets appear to be closely related to those in reduced MHD (Zhdankin et al. 2016), even without the presence of a net field. Perhaps, the strong toroidal field generated by the shearing of radial field acts analogously to the guiding field in RMHD.
There are several astrophysical consequences that follow from the non-negligible sizes of the dissipative structures and their intense energy deposition. The dissipation associated with the longest ribbons may be sufficiently violent and energetic to influence observations, cumulatively imparting low-level variability. A separate application is the thermal processing of chondrules in sufficiently ionised regions of the Solar nebula. The localised and intense heating in these structures could reach the temperatures necessary to melt dust coagulations, especially if aided by the ‘short-circuit’ instability (Hubbard et al. 2012, McNally et al. 2014). Further simulations involving realistic cooling are needed to better estimate the temperature inhomogeneities in the Solar nebula, and their evolution on short times. In addition, statistics need to be generated in order to determine how regularly, or irregularly, dust blobs encounter dissipating regions of high temperature. Finally, it should be stated that under normal conditions the MRI is most likely inactive at the radii where chondrules are thought to be created ( AU). If the MRI is responsible for chondrule production it must have been during short-lived outburst phases in the disk’s evolution (Audard et al. 2014).
The size of the dissipating ribbons may bear on the question of MRI saturation generally which has been shown to depend on dissipation, via the magnetic Prandtl number or the presence or not of physical diffusivities. The stress-pressure relation, in particular, is sensitive to the latter in simulations of zero-magnetic flux. The simulated interactions between the current sheets and large-scale density waves might provide one link connecting the dissipative properties of the flow and its compressible response. In this paper we merely point out the possibility; future work must better establish what is going on here and how this connection might influence the turbulent stress.
Lastly, we would like to make a few caveats regarding our simulations. Though our scaling laws agree with simulations at greater Re and Rm, and hence suggest a physical asympototic regime has been achieved, this is by no means conclusive. Current simulations may not yet exhibit a sufficient separation of scales between and the shortest dissipation length. As we push Rm and Re to the very large values associated with hot accretion flows, it is unclear whether the current sheets retain their elongation in azimuth (lengths ), while getting thinner and thinner and narrower and narrower. If they do, how will their dynamics differ to that described in this paper? To decide on these questions will be an enormously expensive but essential exercise.
Acknowledgements
The authors would like to thank the anonymous reviewer for a positive report that much improved the paper and Pierre Lesaffre who offered extremely helpful comments on an earlier version of the manuscript. This work was partially funded by STFC grants ST/L000636/1 and ST/K501906/1. Some of the simulations were run on the DiRAC Complexity system, operated by the University of Leicester IT Services, which forms part of the STFC DiRAC HPC Facility (www.dirac.ac.uk). This equipment is funded by BIS National E- Infrastructure capital grant ST/K000373/1 and STFC DiRAC Operations grant ST/K0003259/1. DiRAC is part of the UK National E-Infrastructure.
References
- (1) Audard, M., Abraham, P., Dunham, M.M., Green, J.D., Grosso, N., Hamaguchi, K., Kastner, J.H., Kospal, A., Lodato, G., Romanova, M.M., Skinner, S.L., Vorobyov, E.I., Zhu, Z., 2014. In: Beuther, Klessen, Dullemond, Henning (eds), Protostars and Planets VI. University of Arizona Press, Tucson, p387.
- (2) Balbus. S. A., Hawley, J. F., 1991, ApJ, 376, 214.
- (3) Balbus. S. A., Hawley. J. F., 1998, Rev. Mod. Phy., 70, 1.
- (4) Belloni, T. M., 2010, The Jet Paradigm, Lecture Notes in Physics, Volume 794, Springer-Verlag Berlin, p53.
- (5) Birn, J., Priest, E.R., 2007, Reconnection of magnetic fields : magnetohydrodynamics and collisionless theory and observations, CUP, Cambridge.
- (6) Fromang. S., Hennebelle. P., Teyssier. R., A&A, 2006, 457, 371-384.
- (7) Fromang S., Latter H., Lesur G., & Ogilvie G. I., 2013, A&A, 552, A71
- (8) Fromang. S., Papaloizou. J., A&A, 2007, 476, 1113.
- (9) Fromang. S., Papaloizou. J., Lesur. G., Heinemann. T., A&A, 2007, 476, 1123.
- (10) Gammie, C.F., 1996, ApJ, 457, 355.
- (11) Goldreich. P., Lynden-Bell., MNRAS, 1965, 130, 125
- (12) Guan. X., Gammie. C. F., Simon. J. B., Johnson. B. M., 2009, ApJ, 694, 1010.
- (13) Guilet, J., Ogilvie, G.I., 2012, 424, 2097.
- (14) Heinemann, T. and Papaloizou, J. C. B., 2009a, MNRAS, 397, 52
- (15) Heinemann, T. and Papaloizou, J. C. B., 2009b, MNRAS, 397, 64
- (16) Heinemann, T. and Papaloizou, J. C. B., 2012, MNRAS, 419, 1085
- (17) Hillier, A., Takasao, S., Nakamura, N., 2016, AA, 591, 112.
- (18) Hubbard, A., McNally, C.P., Mac Low, M., 2012, ApJ, 761, 58.
- (19) Hudson, H. S., 1991, Sol. Phys., 133, 357.
- (20) Latter. H. N., Papaloizou. J. C. B., 2012, MNRAS, 426, 1107.
- (21) Latter. H. N., Papaloizou. J. C. B., 2017, MNRAS, 472, 1432.
- (22) Lesur, G., Longaretti, P.-Y., 2011, AA, 528, 17.
- (23) Loureiro, N. F., Schekochihin, A. A., and Cowley, S. C., 2007, Physics of Plasmas, 14, 100703
- (24) McNally, C. P. Hubbard, A., Mac Low, M, Ebel, D S, D’Alessio, P, 2013. ApJ, 767, 2.
- (25) Meheut. H., Fromang. S., Lesur. G., Joos., Longaretti. P., 2015., A&A, 579, 117.
- (26) Miyoshi. T., & Kusano. K., 2005, J. Comput. Phys., 208, 315
- (27) Nelson R. P., Gressel, O., 2010. MNRAS, 409, 639.
- (28) Ogilvie, G.I., 1999. MNRAS, 304, 557.
- (29) Priest, E.R., Forbes, T.G., 1986, JGR, 91, 5579.
- (30) Remillard, R. A., McClintock, J. E., 2006, ARAA, 44, 49.
- (31) Riols. A., Rincon. F., Cossu. C., Lesur. G., Longaretti. P. Y., Ogilvie. G. I., Herault. J., Journal of Fluid Mechanics, 2013, 731, 1.
- (32) Riols, A., Latter, H., 2016, MNRAS, 460, 2223.
- (33) Ross, J., Latter, H.N., Guilet, J., 2016. MNRAS, 455, 526.
- (34) Ryan, B. R., Gammie, C.F., Fromang, S., Kestener, P., 2017, ApJ, 840, 6.
- (35) Samtaney, R., Loureiro, N. F., Uzdensky, D. A., Schekochihin, A. A., and Cowley, S. C., 2009, PRL, 103, 105004.
- (36) Simon. J. B., Hawley. J. F., Beckwith. K., 2009. ApJ, 690, 974.
- (37) Stone. J., Gardiner. T., ApJSS, 2010, 189, 142.
- (38) Suresh. A., 2000, SIAM J. Sci. Comp., 22, 1184
- (39) Teyssier. R., 2002, A&A, 364, 337.
- (40) Uritsky, V. M., Pouquet, A., Rosenberg, D., Mininni, P. D., and Donovan, E. F., 2010. Phys. Rev. E, 82, 056326
- (41) Yang, L., Zhang, L., He, J., Tu, C., Li, S., Wang, X., Wang, L., 2017, ApJ, 851, 121.
- (42) Yuan, F., Narayan, R., ARAA, 52, 529.
- (43) Zhdankin, V., Uzdensky, D.A., Perez, J.C., Boldyrev, S., 2013. ApJ, 771, 124.
- (44) Zhdankin, V., Boldyrev, S., Perez, J. C., and Tobias, S. M., 2014. ApJ, 795, 127.
- (45) Zhdankin, V., Uzdensky, D. A., and Boldyrev, S., 2015a. PRL, 114, 065002.
- (46) Zhdankin, V., Uzdensky, D. A., and Boldyrev, S., 2015b. ApJ, 811, 6.
- (47) Zhdankin, V., Boldyrev, S., and Uzdensky, D. A., 2016. Phys. of Plasmas, 23, 055705.
- (48) Zhdankin, V., Walker, J., Boldyrev, S., and Lesur, G., 2017, MNRAS, 467, 3620.