Exploring the physics of the accretion and jet in nearby narrow-line Seyfert 1 galaxies
Abstract
In this paper, we explore the physics of the accretion and jet in narrow-line Seyfert 1 galaxies (NLS1). Specifically, we compile a sample composed of 16 nearby NLS1 with . We investigate the mutual correlation between their radio luminosity , X-ray luminosity , optical luminosity and black hole mass . By adopting partial correlation analysis: (1) we find a positive correlation between and , and (2) we find a weak positive correlation between and . However, we don’t find significant correlations between and or between and after considering the effect of the black hole mass, which leads to a finding of the independence of on . Interestingly, the findings that is correlated with and is not correlated with support that the X-ray emission is saturated with increasing for in NLS1s, which may be understood in the framework of slim disc scenario. Finally, we suggest that a larger NLS1 sample with high quality radio and X-ray data is needed to further confirm this result in the future.
keywords:
galaxies: active – galaxies: nuclei – galaxies: Seyfert – accretion, accretion discs – galaxies: jets1 Introduction
Narrow-line Seyfert 1 galaxy (NLS1) is a subclass of broad-line active galactic nuclei (AGNs), identified optically by full width at half maximum (FWHM) of their broad H emission line and weak [O iii] lines with [O iii] (Osterbrock & Pogge, 1985; Goodrich, 1989). Compared to normal Seyfert 1 galaxies, NLS1s show smaller , weaker [O iii], stronger Fe ii emission, stronger blueshift of the [O iii] and C iv, steeper soft X-ray spectrum (e.g., Boroson & Green, 1992; Véron-Cetty et al., 2001; Sulentic et al., 2000, 2007; Leighly & Moore, 2004; Wang et al., 1996; Boller et al., 1996). NLS1s are located at an extreme end of a correlation matrix of AGN observables, which is believed to be driven mainly by the Eddington ratio (e.g., Boroson & Green, 1992; Boroson, 2002), where is the bolometric luminosity and . Bulk of the black hole masses of the NLS1s has been measured to be by various methods [e.g.,the reverberation mapping method (e.g., Wang et al., 2014) and the luminosity-radius relation (e.g., Zhou et al., 2006)]. They generally have high Eddington ratios close to or even above unity, so they are often suggested to be powered by slim discs (e.g., Wang & Zhou, 1999; Mineshige et al., 2000).
NLS1s are often being radio-quiet111 A measurement of the radio loudness is usually characterized by a parameter , where and are the flux densities at and Å. The optically selected AGNs can be conventionally classified as radio-quiet if (Kellermann et al., 1989). compared with other broad-line AGNs (e.g, Ulvestad et al., 1995; Stepanian et al., 2003; Whalen et al., 2006). Only of the optical selected NLS1s are radio-loud (e.g., Komossa et al., 2006; Zhou et al., 2006), while this fraction is for normal broad-line AGNs (Ivezić et al., 2002). By performing a comprehensive study of 23 genuine radio-loud NLS1s selected from a large NLS1 sample, Yuan et al. (2008) have found evidence of relativistic blazar-like jet in the radio loudest NLS1s. Then the powerful jet in the radio-loud NLS1s was confirmed by the -ray detections (e.g., Abdo et al., 2009a, b; D’Ammando et al., 2012; Yao et al., 2015). On the other hand, several works have found the evidence for the presence of jets in some radio-quiet NLS1s revealed by VLBI images, e.g., extended jet-like features and high brightness temperatures of the compact radio core component on pc scales (e.g., Lal et al., 2004; Giroletti & Panessa, 2009; Doi et al., 2013; Doi et al., 2015).
Generally, the X-ray emission in radio-quiet AGNs is believed to be produced in the hot corona by the inverse Compton scattering of the soft photons from the accretion disc (e.g., Haardt & Maraschi, 1991, 1993; Liu et al., 2002), while the origin of the radio emission in the radio-quiet AGNs is still not fully understood, which is suggested to be from jets by some works although not fully proved (e.g., Czerny & You, 2016). It is shown that the study of the relation between the radio luminosity and X-ray luminosity is a very useful tool to investigate the coupling of the accretion and the jet (Merloni et al., 2003). The radio/X-ray correlation has been investigated for different types of AGN, as well as black hole X-ray binaries (BHBs) in the low/hard spectral state (e.g., Merloni et al., 2003; Wang et al., 2006; Li et al., 2008; de Gasperin et al., 2011). It is found that in the low-luminosity AGNs (LLAGNs) and in the under-luminous low/hard spectral state of BHBs (e.g., Körding et al., 2006), while this correlation becomes significantly steeper, i.e., , in the luminous AGNs and the luminous low/hard spectral state of BHBs (e.g., Corbel et al., 2004; Rushton et al., 2010; Dong et al., 2014)
Some NLS1s have been included in previous studies of radio/X-ray correlation. However, due to that the number of the NLS1s in the sample is very small, their statistical properties are overwhelmed by other types of AGNs. (e.g., Merloni et al., 2003; Dong et al., 2014; Panessa et al., 2015). Furthermore, the measurements of their radio luminosities could be severely contaminated by the host galaxies, e.g., if the resolution of the radio observation is not high enough, the star formation activities in their circumnuclear regions can have very strong contributions to the radio luminosity (e.g., Deo et al., 2006; Ohta et al., 2007; Sani et al., 2010). Caccianiga et al. (2015) found that the star formation activities can contribute a significant fraction of VLA/FIRST radio emission even in some radio-loud NLS1s. In order to reduce the contaminations from the host galaxy as much as possible, in this work we make use of radio fluxes within the central regions () of nearby radio-quiet NLS1s measured from high resolution radio images, to study their nuclear radio/X-ray relation which was rarely studied before. This could help us understand the physics of the accretion and jet in high Eddington ratio regime. We also explore the mutual relation between the radio luminosity, X-ray luminosity, optical luminosity and black hole mass. There are several works on the radio images of radio loud NLS1s on kpc scales or even pc scales recently (e.g., Doi et al., 2011; Doi et al., 2012; Gu et al., 2015). But we do not choose the radio loud ones as to avoid the relativistically beaming effects. Throughout this work a cosmology is assumed with km s-1 Mpc-1, and . The luminosities taken from literatures would be transformed to the cosmology used here when necessary.
2 The Sample
2.1 Sample selection
We select objects from the 13th edition of the catalogue of quasars and active galactic nuclei compiled by Véron-Cetty & Véron (2010), including both quasars (defined as brighter than absolute magnitude ) and Seyfert galaxies (fainter than ), with criteria as follows.
-
1.
The object is classified as NLS1 with redshift according to its optical spectroscopy.
-
2.
The object is radio-quiet.
-
3.
The object is detected by the high-resolution radio observations within the central nuclear region less than about 1 kpc.
-
4.
The object has an Eddington ratio of .
The criterion of being classified as NLS1 in Véron-Cetty & Véron (2010) is that the FWHM of the H emission line broad component is narrower than . 265 NLS1s are picked out at this step. Then, we search for the corresponding radio observations by VLA of the selected NLS1s with an angular resolution corresponding to a physical size of at the object’s rest frame from the literatures, i.e., Ulvestad & Wilson (1984b), Miller et al. (1993), Kukula et al. (1995), Ulvestad et al. (1995), Kukula et al. (1998), Kinney et al. (2000), Schmitt et al. (2001), Ho & Ulvestad (2001), Lal et al. (2004), Orienti & Prieto (2010) and Parra et al. (2010). After this step, we have 17 sources left.
We estimate the Eddington ratios for these 17 sources (see section 2.4 for details). All of them have except for NGC 4051. The nuclear continuum flux at 5100 Å of NGC 4051 is about after subtracting the host galaxy starlight and its black hole mass estimated from the reverberation mapping method is (Denney et al., 2009). The Eddington ratio is for NGC 4051. Thus we exclude it from our sample. The final sample consists of 16 NLS1s with and (Table 1). None of them are reported to be radio-loud in previous works (e.g., Komossa et al., 2006; Yuan et al., 2008; Foschini et al., 2015). In the work of Berton et al. (2015), the radio loudness of Mrk 1239 and Mrk 766 have been reported as 16 and 23, respectively. They could be classified as so-called radio-intermediate AGNs instead of genuine radio-loud ones (Falcke et al., 1996), which are also included in our sample. Here we should note that this sample is not complete, since we only select sources that are detected in high resolution radio observations. But this is the largest sample we can find from the literatures at this stage.
| Name | size | Ref. | size | Ref. | Ref. | Ref. | ||||||||
|---|---|---|---|---|---|---|---|---|---|---|---|---|---|---|
| VLA | VLBI | |||||||||||||
| (ergs s-1) | (pc) | (ergs s-1) | (pc) | (ergs s-1) | (ergs s-1) | () | (ergs s-1) | |||||||
| (1) | (2) | (3) | (4) | (5) | (6) | (7) | (8) | (9) | (10) | (11) | (12) | (13) | (14) | (15) |
| Mrk 335 | 0.0258 | 38.31 | 152 | 1 | - | - | - | 43.17 | 1,1,1,1 | 43.45 | 6.92 | 43.60 | 1,M | 0.38 |
| I Zw 1 | 0.0611 | 38.71 | 385 | 1 | - | - | - | 43.72 | 1,1,1,1 | - | 7.26 | 44.51 | 1,S | 1.40 |
| Mrk 359 | 0.0168 | 37.36 | 170 | 1 | - | - | - | 42.60 | 1,1,1 | 42.93 | 5.48 | 41.99b | 1,S | 0.25 |
| Mrk 110 | 0.0353 | 38.42 | 320 | 1 | 37.86 | 7.5 | 1 | 43.83 | 1,1,1 | 44.22 | 7.05 | 43.61 | 1,M | 0.28 |
| Mrk 705 | 0.0292 | 38.45 | 1 | 37.91 | 6.5 | 1 | 43.48 | 1,1 | 43.49 | 6.79 | 43.04b | 1,1,S | 0.14 | |
| Mrk 1239 | 0.0199 | 38.93 | 140 | 1 | 37.70 | 4.5 | 1 | 43.02 | 1 | 43.05a | 6.11 | 43.27 | 1,S | 1.12 |
| Mrk 766 | 0.0129 | 38.41 | 95 | 1 | 37.04 | 2.9 | 1 | 42.84 | 1,1,1, | 42.91 | 6.11 | 42.53 | 1,M | 0.20 |
| 1,1,1 | ||||||||||||||
| PG 1244+026 | 0.0481 | 38.13 | 434 | 1 | - | - | - | 43.17 | 1,1,1 | - | 6.28 | 43.43 | 1,S | 1.11 |
| Mrk 783 | 0.0672 | 39.27 | 1 | 38.54 | 13.6 | 1 | 43.84 | 1 | 44.28 | 7.16 | 43.91a | 1,S | 0.44 | |
| PG 1404+226 | 0.0983 | 38.95 | 837 | 1 | - | - | - | 42.88 | 1,1 | - | 6.89 | 44.38 | 1,S | 2.40 |
| Mrk 478 | 0.0790 | 38.76 | 688 | 1 | - | - | - | 43.84 | 1,1,1,1 | - | 7.37 | 44.48 | 1,S | 1.02 |
| PG 1448+273 | 0.0645 | 38.76 | 571 | 1 | - | - | - | 43.33 | 1 | - | 7.01 | 44.01 | 1,S | 0.77 |
| IRAS 1509211 | 0.0445 | 39.44 | 1 | - | - | - | 43.57 | 1,1,1 | 44.16 | 7.00 | 43.98 | 1,S | 0.74 | |
| Mrk 493 | 0.0310 | 37.92 | 1 | - | - | - | 42.95 | 1 | - | 6.18 | 43.03 | 1,M | 0.55 | |
| Mrk 507 | 0.0559 | 38.70 | 1 | - | - | - | 42.81 | 1,1,1 | 43.56 | 6.91 | 43.77 | 1,S | 0.56 | |
| Ark 564 | 0.0247 | 38.93 | 320 | 1 | 38.40 | 1.2 | 1 | 43.36 | 1,1,1,1, | 43.52a | 6.42 | 43.68 | 1,S | 1.44 |
| 1,1,1 |
a This luminosity is converted from measured by Suzaku/HXD (Fukazawa et al., 2011) assuming a photon index of .
b This monochromatic luminosity is estimated from relation of Greene & Ho (2005) and is obtained from the corresponding references in Column (14).
Note. Column (1): source name. Column (2): source redshift. Column (3): the VLA monochromatic radio luminosity at 5 GHz. Column (4): the linear size of the emitting region from which Column (3) is measured. Column (5): the references for Column (3) and (4). Column (6): the VLBI monochromatic radio luminosity at 5 GHz, Column (7): the linear size of the emitting region from which Column (6) is measured. Column (8): the references for Column (6) and (7). Column (9): the average X-ray luminosity in the band. Column (10): the references for Column (9). Column (11): the hard X-ray luminosity in the band taken from the 70 month Swift/BAT survey (Baumgartner et al., 2013), except for Mrk 1239 and Ark 564, for which the hard X-ray luminosity in the was taken from Fukazawa et al. (2011), and then converted to the band. Column (12): the black hole masses. Column (13): monochromatic nuclear luminosity at Å. Column (14): references for the and . The black hole masses are derived from the reverberation mapping method (M) or single-epoch spectroscopy (S). Column (15): Eddington ratio.
References: (1) Kukula et al. (1995); (1) Kinney et al. (2000); (1) Miller et al. (1993); (1) Schmitt et al. (2001); (1) Ulvestad et al. (1995); (1) Parra et al. (2010); (1) Ulvestad & Wilson (1984a); (1) Lal et al. (2004); (1) Doi et al. (2013); (1) George et al. (2000); (1) Grupe et al. (2007); (1) Grupe et al. (2010); (1) Keek & Ballantyne (2016); (1) Piconcelli et al. (2005); (1) Reeves & Turner (2000); (1) Costantini et al. (2007); (1) Ueda et al. (2001); (1) Lutz et al. (2004); (1) Bianchi et al. (2009); (1) Boissay et al. (2016); (1) Nandra et al. (2007); (1) Winter et al. (2012); (1) Gallo et al. (2005); (1) Shu et al. (2010); (1) Grupe et al. (2004); (1) Matt et al. (2000); (1) Landi et al. (2005); (1) Giacchè et al. (2014); (1) Jin et al. (2013); (1) Panessa et al. (2011); (1) Shinozaki et al. (2006); (1) Inoue et al. (2007); (1) Brightman & Nandra (2011); (1) Liu et al. (2014); (1) Liu et al. (2015); (1) Iwasawa et al. (1998); (1) de La Calle Pérez et al. (2010); (1) Turner et al. (2001); (1) Vignali et al. (2004); (1) Matsumoto et al. (2004); (1) Papadakis et al. (2007); (1) Ramírez (2013); (1) Wang et al. (2014); (1) Wang et al. (2013); (1) Ho et al. (2008); (1) Marziani et al. (2003); (1) Ryan et al. (2007); (1) Grier et al. (2013); (1) Wang & Lu (2001); (1) Vestergaard & Peterson (2006); (1) Ohta et al. (2007); (1) Botte et al. (2004);
2.2 Radio luminosity
We collect the radio flux for each source from the references listed in Column (5) of Table 1. They usually have steep radio spectra (, where ), not remarkably different from the normal Seyfert 1 galaxies (Miller et al., 1993; Ulvestad et al., 1995). As shown by the radio images given in these references, most of the sources have compact and unresolved morphology within a few hundred pc in central region. A few exceptions exist, e.g., Mrk 110 and Mrk 1239 show extended features on kpc-scales (Miller et al., 1993; Kellermann et al., 1994; Doi et al., 2015), and Ark 564 has a triple radio component along the north-south direction (Thean et al., 2001).
We calculate the core radio luminosities from their peak flux densities of the core component. The observations were performed at different frequencies. We always use the flux density observed at if available. When the observation was taken at other frequencies, the flux is extrapolated from the observing center frequency to 5 GHz using the radio spectral index if available or using an typical spectral index of (e.g., Doi et al., 2013). The luminosities are listed in Table 1. A typical value of dex (Ho & Peng, 2001) is adopted as the uncertainty of the radio luminosity.
Six of these objects, namely, Mrk 110, Mrk 705, Mrk 783, Mrk 766 (Doi et al., 2013), Mrk 1239 (Doi et al., 2013; Doi et al., 2015) and Ark 564 (Lal et al., 2004), have also been detected by VLBI observations and exhibit radio core with angular size of a few milliarcsecond, corresponding to a linear size of only a few pc. The sources show clear elongated features extending to one side or both sides of the core with a brightness peak. In addition, their core components have high brightness temperatures of (Doi et al., 2013; Lal et al., 2004). The VLBI luminosities of the sources are also listed in the table.
2.3 X-ray luminosity
For the X-ray luminosities, we have searched NASA/IPAC Extragalactic Database (NED) and literatures in which the 2–10 keV fluxes or luminosities of the selected NLS1s are reported (Column 10 in Table 1). The selected objects are all nearby with and relatively bright in the X-rays. The central AGN is generally 2–3 orders of magnitude more luminous than the typical level of X-ray sources of the host galaxy, e.g., X-ray binaries and supernova remnants (Fabbiano, 1989).
The fluxes are corrected for the Galactic absorption before converted to luminosities. For most of the sources in the sample, the spectral analysis results given in the literatures show weak intrinsic absorption with , which consequently will not significantly affect the hard X-ray flux in our study. Piconcelli et al. (2005) reported an intrinsic gas column density of for PG 1404+226 from the spectral fit, which will lead to an underestimation of the luminosity by percent for a spectrum with . Another peculiar object worth mentioning is Mrk 507. This source has a very strong Fe ii with (Véron-Cetty et al., 2001), on the other hand, it exhibits a flat ROSAT spectrum with which was suggested to be caused by intrinsic absorption with a column density of (Iwasawa et al., 1998). Its ROSAT spectrum is still flat () even after correction of intrinsic absorption (Iwasawa et al., 1998). With a extremely strong Fe ii and the flattest soft X-ray spectrum, Mrk 507 is unusual in the light of positive correlation between the Fe ii strength and the steepness of ROSAT spectrum (Wang et al., 1996). However, the suggested intrinsic absorption should have little affection (a few percent) to the X-rays above . Nevertheless, we adopt the flux reported in literatures after correction of only Galactic absorption for all the sources.
We note here that the X-ray variability is very common in AGNs and its variability amplitude usually ranges from a few times to more than an order of magnitude on timescales of months up to years (e.g., Mushotzky et al., 1993). The measurement of the X-ray and other observables at different epochs may lead to large uncertainties when studying their relation. So we take the unweighted mean X-ray flux when multiple observations are available for each source. Although there are significant X-ray variabilities between different X-ray observations for individual sources, they varied within an order of magnitude. The photon indices of the spectra of the sample are in the range of and do not varied much either () for individual sources222Giacchè et al. (2014) have analyzed XMM-Newton observations on Mrk 766 between 2000 and 2005, and find the flux varied by a factor of with photon index between 0.95 and 2.1. But they suggest the X-ray emission is probably affected by occultations during . So we do not adopt the fluxes with . . Four of these objects, Mrk 110, Mrk 335, Mrk 705 and Ark 564 have been monitored by RXTE/ASM and/or by MAXI. We check the ASM and MAXI 1-day-binned light curves, and find that the sources have not been detected for most of the time. Only in few cases the light curve demonstrated flares where the fluxes increase possibly by more than an order of magnitude. The value of 2–10 keV fluxes of each source we adopted here do not vary as large as during the flares, so they were most probably in their typical flux state during the observations. We adopt the range between highest and lowest values as the uncertainty for each source if there are multiple X-ray observations. If there is only one X-ray observation, a typical uncertainty of dex is adopted (Strateva et al., 2005).
Eight sources in the sample are reported in the Swift-BAT 70-Month catalog (Baumgartner et al., 2013). For another two sources such as Mrk 1239 and Ark 564, X-ray luminosities are converted from measured by Suzaku/HXD (Fukazawa et al., 2011) to assuming a photon index of and dex for these two sources (see Column 11 of Table 1).
2.4 Black hole mass and Eddington ratio
Some of the NLS1s in the sample are included in large reverberation-mapping campaigns (e.g., Grier et al., 2013; Wang et al., 2014), in which the black hole masses are estimated by measuring the structure of the broad-line region using mapping technique. For the rest of the sources, their black hole masses are estimated with the line width-luminosity mass scaling relation using single-epoch optical spectroscopy (see column 14 of Table 1). The black hole masses are in the range of , as the typical value of NLS1 population (Zhou et al., 2006).
The Eddington ratio of the NLS1s studied here were estimated in numerous works (e.g., Wang et al., 2014; Ohta et al., 2007; Marziani et al., 2003; Ho et al., 2008; Grier et al., 2013; Wang & Lu, 2001; Ryan et al., 2007; Botte et al., 2004). All of the results support that these sources are accreting close to or above Eddington limit. We simply estimate their Eddington ratios (Column 15 in Table 1) assuming (McLure & Dunlop, 2004), where is the monochromatic luminosities at Å. For most of the sources in the sample, the are calculated from the nuclear monochromatic fluxes at 5100 Å after subtracting the starlight of the host galaxy (see references in Column 14 of Table 1). When the starlight-subtracted flux at Å is unavailable, we calculate using the measured and the relation in Greene & Ho (2005). We note that the bolometric correction factor of adopted here was measured based on a large sample of SDSS quasars (McLure & Dunlop, 2004).
3 Correlation Analysis
 |
 |
 |
 |
| Variables | Correlation | |||
|---|---|---|---|---|
| (1) | (2) | (3) | (4) | (5) |
| 0.14 | 0.47 | |||
| 0.31 | 0.45 | |||
| 0.37 | 0.17 | |||
| 0.59 | 0.15 | |||
| 0.39 | 0.04 | |||
| 0.62 | 0.13 | |||
| -0.02 | 0.94 | |||
| 0.42 | 0.12 | |||
| 0.14 | 0.47 | |||
| 0.29 | 0.47 | |||
| -0.02 | 0.95 | |||
| 0.42 | 0.30 | |||
| 0.01 | 0.97 | |||
| 0.26 | 0.52 | |||
| 0.20 | 0.31 | |||
| -0.13 | 0.74 | |||
| -0.07 | 0.78 | |||
| -0.14 | 0.72 | |||
| 0.52 | ||||
| 0.58 | ||||
| 0.95 | 0.02 | |||
| 0.59 | 0.03 | |||
| 0.74 | ||||
| 0.74 | 0.07 | |||
Note. Column (1)-(3): Variable , and , respectively. Correlation between variables and is studied, taking into account the mutual correlation of and with the third variable . Column (4)-(5): the partial Kendall’s correlation coefficient , and the probability for accepting the null hypothesis that there is no correlation between and .
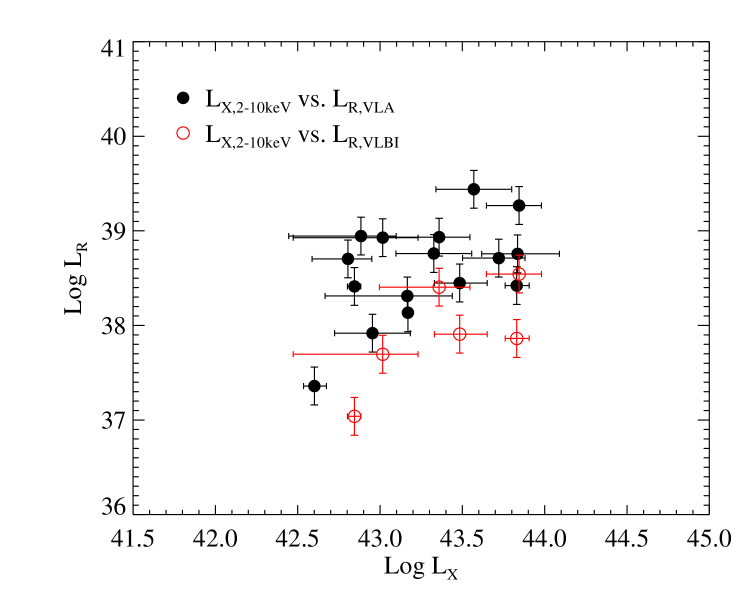
We plot X-ray luminosity versus radio luminosity in Figure 1. We calculate the Spearman’s rank correlation coefficient and the probability of null hypothesis (i.e., no correlations), , to test whether there is significant correlations between the two variables, using the X-ray luminosities either in or in , and the radio luminosities calculated from either VLA or VLBI observations. However, all the tests give , which means that there is no significant correlation between the radio luminosity and X-ray luminosity.
By analyzing a large sample of AGNs, it was found that the radio luminosity depends on both the X-ray luminosity and black hole mass (e.g., Merloni et al., 2003). In the current paper, more generally, we explore the mutual relation between , , and nuclear monochromatic luminosity by using the partial Kendall’s correlation test, which can be used to eliminate the effect of a third variable when assessing the correlation between two variables (Akritas & Siebert, 1996).
Firstly, we calculate the partial correlation coefficients and the probabilities for null hypothesis between either two of the radio luminosity , X-ray luminosity and optical luminosity , given that the black hole mass is the third variable. Only a weak correlation is revealed by the test between and with probability of . Then we test the correlations between and given that is the third variable. We don’t find significant correlations between and in any cases so far. Finally, we test if there is correlation between (or ) and , given that or (or ) is the third variable. No significant correlation has been found between and . However, both and luminosity significantly correlate with with .
 |
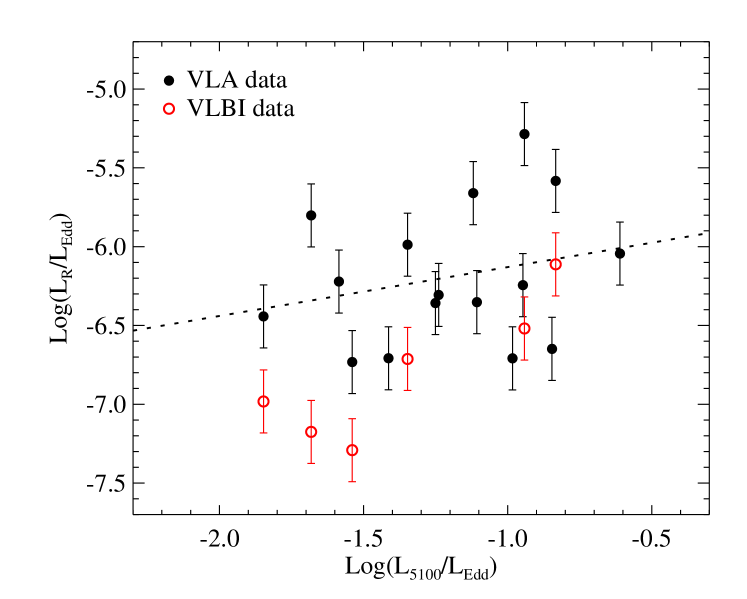 |
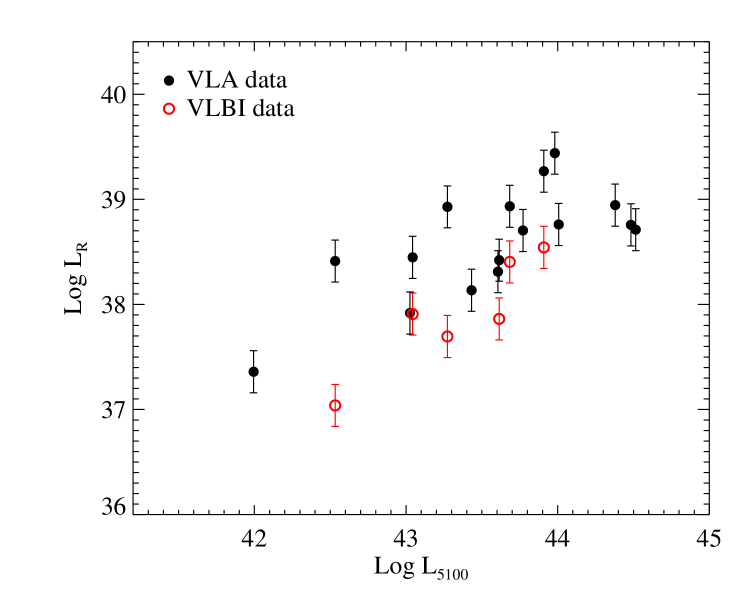
In the left panel of Figure 2, we plot versus using VLA and VLBI data respectively. It is clear that increases with increasing . Then, as suggested by the partial correlation test (the fifth row of table 2), we plot the Eddington-scaled radio luminosity versus the Eddington-scaled optical luminosity in the right panel of Figure 2. By adopting a typical uncertainty dex for the radio luminosity (Ho & Peng, 2001), the best-fitted linear relation using VLA data gives
| (1) |
 |
 |
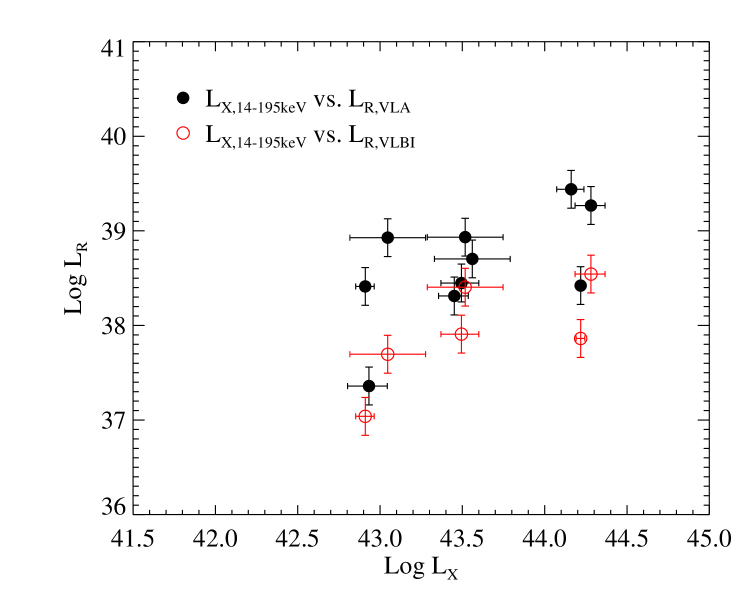
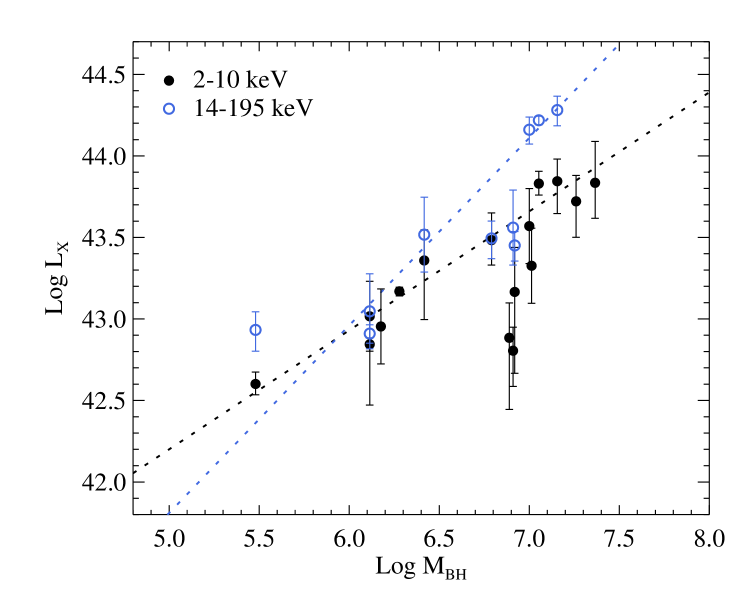
In the left panel of Figure 3, we plot versus using luminosities and luminosities respectively. The best-fitted linear relations of - are
| (2) |
and
| (3) |
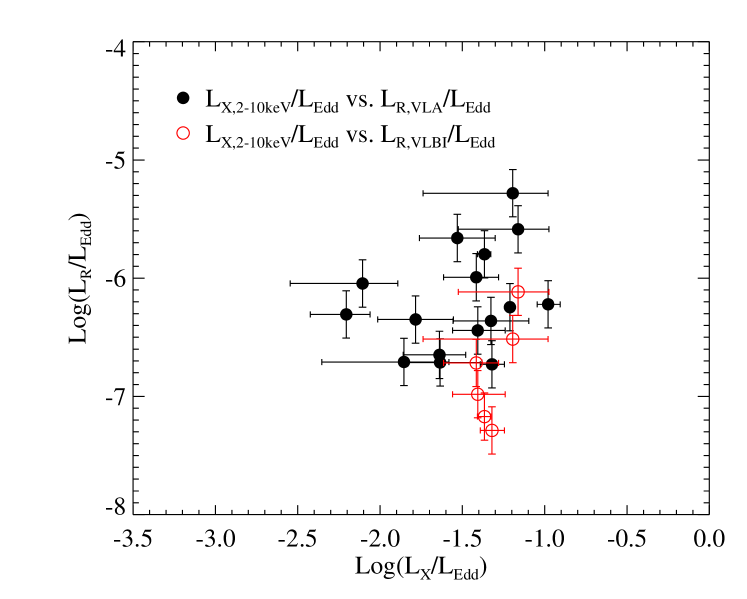
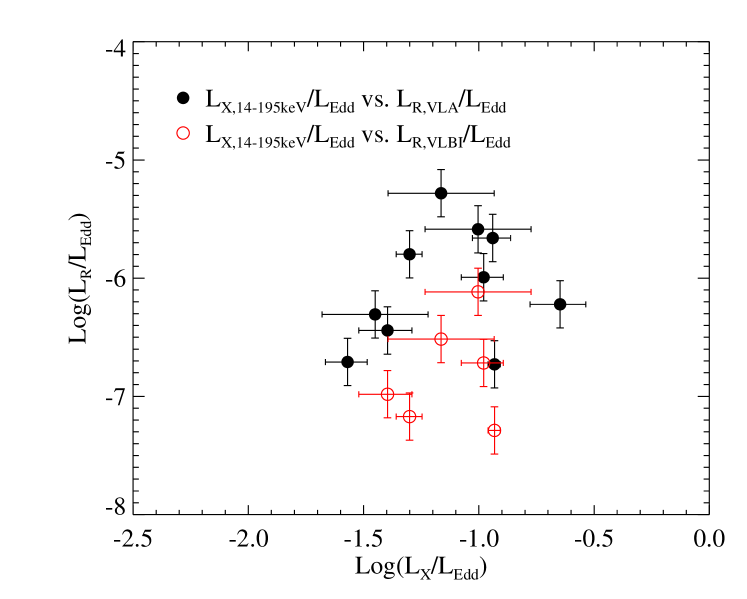
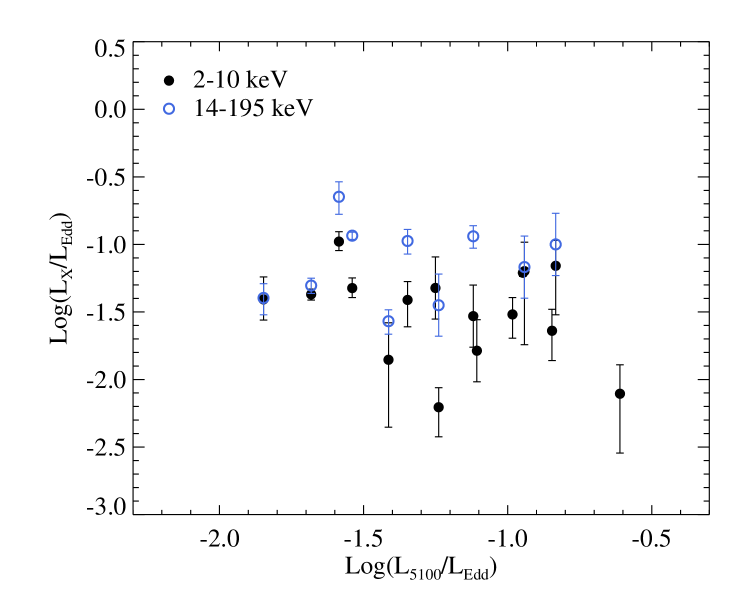
In the right panel of Figure 3, as suggested by the partial correlation test (the seventh and eighth row of table 2), we plot the Eddington-scaled X-ray luminosity versus the Eddington-scaled optical luminosity . No significant correlation between and is found.
4 Discussion
We collect the core radio luminosities calculated from high-resolution radio observations, as well as the X-ray luminosities for 16 nearby NLS1s with Eddington ratios . The high-resolution radio images avoid the host galaxy contamination as much as possible. Partial Kendall’s correlation test is used to explore the mutual relations between the radio luminosity, X-ray luminosity, nuclear optical luminosity and the black hole mass. As shown in Section 3, we don’t find any significant correlations between the X-ray luminosity , either in or , and the radio luminosity , either using VLA data measured on scales of or VLBI data measured on scales of a few pc. However, we find that there is a positive correlation between and . Meanwhile, we find that there is no correlation between and (right panel of Figure 3), which are suggested to be understood in the framework of slim disc scenario as follows.
The slim disc model has been proposed to explain the observational features of NLS1s in the past few decades (e.g., Abramowicz et al., 1988; Wang & Zhou, 1999; Mineshige et al., 2000; Wang & Netzer, 2003; Wang et al., 2013). In this model, when the accretion rate approaches or exceeds the Eddington limit, the disc within a certain radius becomes optically too thick that the time scale of the photon diffusion to the disc surface is longer than that of the viscous time scale of the accretion disc. In this case, most of the photons within this radius will be trapped in the disc until advected into the black hole rather than being radiated out. The radius of the photon trapping region is dependent on the accretion rate as (Wang & Zhou, 1999; Wang et al., 2013). As increases, the photon trapping region gets larger. The total luminosity of the slim disc is proportional logarithmically to and eventually get saturated with increasing . Then the total luminosity is independent on and only depends on the black hole mass (Wang et al., 2013).
The hard X-ray emission above in bright Seyfert galaxies and radio quiet quasars is believed to be from a so-called disc-corona system, which should be very similar in the case of NLS1s with a form of slim disc-corona system (e.g., Chen & Wang, 2004; Jin et al., 2017). The emission from the disc mainly contributes to the optical/UV band, part of which will be Compton up-scattered in the hot corona, producing the hard X-ray emissions (e.g., Haardt & Maraschi, 1991, 1993; Stern et al., 1995). Simply, the Compton cooling rate is determined by the following expressions (Rybicki & Lightman, 1986),
| (4) |
where is the seed photon energy density, is the electron temperature, is the Thomson scattering cross section, is the electron density and is the electron mass. If the NLS1s in our sample are indeed powered by the slim disc-corona accretion, we will have a general consequence as follows. When the accretion rate gets near and above the Eddington limit as in the NLS1s studied here (Column 15 of Table 1), the emission from the accretion disc will be saturated and independent on the accretion rate within the photon trapping radius . Observationally, since the corona is very compact, located within less than gravitational radii of the black hole (e.g., Reis & Miller, 2013), the covering factor of the accretion disc at the region beyond a few tens of gravitational radii as seen from the corona is very small. In this case, the seed photons to be intercepted and scattered in the corona will be mainly from the very innermost region of the accretion disc. So, in the slim disc scenario, although the luminosity of the accretion disc beyond do not get saturated, however, due to the relatively small contribution of the seed photon from this region, the seed photon energy density for the inverse Compton scattering in the corona will not change much with increasing . Meanwhile, if the property of the corona, such as the electron temperature and the optical depth also don’t change, theoretically, the produced hard X-ray emission from the corona will not change much. Then the overall hard X-ray emission will be only dependent on the black hole mass, which is just the correlation we found between and (left panel of Figure 3).
Physically, in the standard disc-corona case, the relative strength between the disc and the corona is determined by the relative mass accretion rate in the disc and corona. Generally, the radiation from the disc, , increases with an increase of the mass accretion rate in the disc, , which will make the matter in the corona collapse due to the strong Compton cooling processes, decreasing the relative strength of the emission from the corona. In the slim disc-corona case, however, an increase of does not increase the seed photon luminosity, which will not change the coronal luminosity, then consequently lead to the independence of the coronal luminosity on the accretion rate.
In summary, in the slim disc-corona scenario, with an increase of , the disc luminosity increases, leading to an increase of . However, the X-ray luminosity nearly does not change. This is strongly supported by our finding in the current paper, i.e., there is no observed correlation between and (right panel of Figure 3), meanwhile, there is a positive correlation between and (left panel of Figure 3). We note that, in some numerical simulations of supercritical accretion flows, the fully saturated luminosity of the accretion disc occurs at Eddington ratio (e.g., Ohsuga et al., 2005), which is a little higher than that of the sources in our sample, i.e., (Table 1). Obviously, when the Eddington ratio is in the range of , the disc is partly saturated, which can intrinsically predict our findings in Figure 3.
The relativistic jet has been widely observed in both AGNs and BHBs. So far, several models have been proposed for the jet formation, such as the Blandford-Znajek (BZ) process and Blandford-Payne (BP) process. In the BZ process, the jet is driven by extracting the rotational energy of the black hole via a large-scale magnetic field (Blandford & Znajek, 1977). In the BP process, the magnetic fields thread the accretion disc, extracting the rotational energy of the accretion disc to drive the jet (Blandford & Payne, 1982). Some state-of-the-art numerical simulations of super-Eddington accretion around a supermassive black hole have been done for the formation of jet, in which the jet is driven by radiation pressure (e.g., Tchekhovskoy et al., 2014; Sa̧dowski & Narayan, 2015). We should note that, although a lot of important progresses have been made for the formation of the jet, we don’t fully understand the physical mechanism for launching the jet yet (e.g., Romero et al., 2017)
As we know, a strong correlation between the radio luminosity and X-ray luminosity has been found both in AGNs and BHBs (e.g., Merloni et al., 2003). The advection dominated accretion flow (ADAF) plus jet model was proposed to explain the correlation, i.e., in LLAGNs and in the low/hard spectral state of BHBs for (e.g., Yuan & Cui, 2005; Xie & Yuan, 2016). The disc-corona plus jet was proposed to explain the correlation, i.e., for in luminous AGNs and the luminous low/hard spectral state of BHBs (e.g., Dong et al., 2014; Qiao & Liu, 2015). However, for the NLS1s in current paper, we don’t find a significant correlation between the radio luminosity and X-ray luminosity, which may imply that the physics for the coupling between the accretion (especially the corona) and jet in NLS1s is completely different from other types of AGNs and the low/hard spectral state of BHBs. Due to the high Eddington ratios, NLS1s are argued to be the scale-up version of BHBs in their high/soft state or very high state (e.g., Arévalo et al., 2006). However, the relation between the radio and X-ray luminosities in the high/soft state or very high state of BHBs is not clear now (e.g., Rushton et al., 2016). Thus, we do not compare their radio-X-ray relations here.
In Merloni et al. (2003), different kinds of black hole sources were included to study the mutual dependencies of , and , including the BHBs in the low/hard spectral state, and different types of AGNs (LLAGNs, Seyfert galaxies and quasars). They have looked for the partial correlations between and by taking as the third variable. Then they have also looked for partial correlations between () and by taking () as the third variable. In their work, is strongly correlated with both and , and, in turn, is correlated with both and when both AGNs and BHBs are considered, which then leads to the discovery of the so-called ‘fundamental plane’. In our work, we only focus on a special subclass of AGNs, i.e., NLS1s, with relatively higher Eddington ratios. We don’t find partial correlations between the radio luminosity and X-ray luminosity, and between the radio luminosity and black hole mass (Table 2). So the determination of a plane is impossible here. However, we find a significant partial correlation between the and for NLS1s by taking or as the third variable. This is in contrast with Merloni et al. (2003), in which is found to be independent on when only AGNs are included (see their Table 2). This also implies that the coupling between the accretion and jet in the NLS1s is indeed different from other types of AGNs.
But we should note that, in the current paper, the number of the sources in the sample is small, which may make the statistical properties uncertain. A larger well-defined and uniformly selected sample with high resolution radio images and X-ray observations is needed to confirm our conclusions more robustly in the not far future.
Acknowledgements
We are grateful to anonymous referee for the helpful comments, which substantially improve the quality of this paper. We thank W. M. Yuan, B. F. Liu, Z. Liu, S. Komossa and H. Y. Zhou for helpful discussions. This work has made use of the NED which is operated by the Jet Propulsion Laboratory, California Institute of Technology, under contract with the National Aeronautics and Space Administration. S. Yao thanks the supported by KIAA-CAS fellowship. E. L. Qiao thanks the supports by the NSFC grant No. 11773037. X. B. Wu thanks the supports by the Ministry of Science and Technology of China under grant 2016YFA0400703, the NSFC grants No.11373008 and 11533001, and the National Key Basic Research Program of China 2014CB845700.
References
- Abdo et al. (2009a) Abdo A. A., et al., 2009a, ApJ, 699, 976
- Abdo et al. (2009b) Abdo A. A., et al., 2009b, ApJ, 707, L142
- Abramowicz et al. (1988) Abramowicz M. A., Czerny B., Lasota J. P., Szuszkiewicz E., 1988, ApJ, 332, 646
- Akritas & Siebert (1996) Akritas M. G., Siebert J., 1996, MNRAS, 278, 919
- Arévalo et al. (2006) Arévalo P., Papadakis I. E., Uttley P., McHardy I. M., Brinkmann W., 2006, MNRAS, 372, 401
- Baumgartner et al. (2013) Baumgartner W. H., Tueller J., Markwardt C. B., Skinner G. K., Barthelmy S., Mushotzky R. F., Evans P. A., Gehrels N., 2013, ApJS, 207, 19
- Berton et al. (2015) Berton M., et al., 2015, A&A, 578, A28
- Bianchi et al. (2009) Bianchi S., Guainazzi M., Matt G., Fonseca Bonilla N., Ponti G., 2009, A&A, 495, 421
- Blandford & Payne (1982) Blandford R. D., Payne D. G., 1982, MNRAS, 199, 883
- Blandford & Znajek (1977) Blandford R. D., Znajek R. L., 1977, MNRAS, 179, 433
- Boissay et al. (2016) Boissay R., Ricci C., Paltani S., 2016, A&A, 588, A70
- Boller et al. (1996) Boller T., Brandt W. N., Fink H., 1996, A&A, 305, 53
- Boroson (2002) Boroson T. A., 2002, ApJ, 565, 78
- Boroson & Green (1992) Boroson T. A., Green R. F., 1992, ApJS, 80, 109
- Botte et al. (2004) Botte V., Ciroi S., Rafanelli P., Di Mille F., 2004, AJ, 127, 3168
- Brightman & Nandra (2011) Brightman M., Nandra K., 2011, MNRAS, 413, 1206
- Caccianiga et al. (2015) Caccianiga A., et al., 2015, MNRAS, 451, 1795
- Chen & Wang (2004) Chen L.-H., Wang J.-M., 2004, ApJ, 614, 101
- Corbel et al. (2004) Corbel S., Fender R. P., Tomsick J. A., Tzioumis A. K., Tingay S., 2004, ApJ, 617, 1272
- Costantini et al. (2007) Costantini E., Gallo L. C., Brandt W. N., Fabian A. C., Boller T., 2007, MNRAS, 378, 873
- Czerny & You (2016) Czerny B., You B., 2016, Astronomische Nachrichten, 337, 73
- D’Ammando et al. (2012) D’Ammando F., et al., 2012, MNRAS, 426, 317
- Denney et al. (2009) Denney K. D., et al., 2009, ApJ, 702, 1353
- Deo et al. (2006) Deo R. P., Crenshaw D. M., Kraemer S. B., 2006, AJ, 132, 321
- Doi et al. (2011) Doi A., Asada K., Nagai H., 2011, ApJ, 738, 126
- Doi et al. (2012) Doi A., Nagira H., Kawakatu N., Kino M., Nagai H., Asada K., 2012, ApJ, 760, 41
- Doi et al. (2013) Doi A., Asada K., Fujisawa K., Nagai H., Hagiwara Y., Wajima K., Inoue M., 2013, ApJ, 765, 69
- Doi et al. (2015) Doi A., Wajima K., Hagiwara Y., Inoue M., 2015, ApJ, 798, L30
- Dong et al. (2014) Dong A.-J., Wu Q., Cao X.-F., 2014, ApJ, 787, L20
- Fabbiano (1989) Fabbiano G., 1989, ARA&A, 27, 87
- Falcke et al. (1996) Falcke H., Sherwood W., Patnaik A. R., 1996, ApJ, 471, 106
- Foschini et al. (2015) Foschini L., et al., 2015, A&A, 575, A13
- Fukazawa et al. (2011) Fukazawa Y., et al., 2011, ApJ, 727, 19
- Gallo et al. (2005) Gallo L. C., Balestra I., Costantini E., Boller T., Burwitz V., Ferrero E., Mathur S., 2005, A&A, 442, 909
- George et al. (2000) George I. M., Turner T. J., Yaqoob T., Netzer H., Laor A., Mushotzky R. F., Nandra K., Takahashi T., 2000, ApJ, 531, 52
- Giacchè et al. (2014) Giacchè S., Gilli R., Titarchuk L., 2014, A&A, 562, A44
- Giroletti & Panessa (2009) Giroletti M., Panessa F., 2009, ApJ, 706, L260
- Goodrich (1989) Goodrich R. W., 1989, ApJ, 342, 224
- Greene & Ho (2005) Greene J. E., Ho L. C., 2005, ApJ, 630, 122
- Grier et al. (2013) Grier C. J., et al., 2013, ApJ, 773, 90
- Grupe et al. (2004) Grupe D., Mathur S., Komossa S., 2004, AJ, 127, 3161
- Grupe et al. (2007) Grupe D., Komossa S., Gallo L. C., 2007, ApJ, 668, L111
- Grupe et al. (2010) Grupe D., Komossa S., Leighly K. M., Page K. L., 2010, ApJS, 187, 64
- Gu et al. (2015) Gu M., Chen Y., Komossa S., Yuan W., Shen Z., Wajima K., Zhou H., Zensus J. A., 2015, ApJS, 221, 3
- Haardt & Maraschi (1991) Haardt F., Maraschi L., 1991, ApJ, 380, L51
- Haardt & Maraschi (1993) Haardt F., Maraschi L., 1993, ApJ, 413, 507
- Ho & Peng (2001) Ho L. C., Peng C. Y., 2001, ApJ, 555, 650
- Ho & Ulvestad (2001) Ho L. C., Ulvestad J. S., 2001, ApJS, 133, 77
- Ho et al. (2008) Ho L. C., Darling J., Greene J. E., 2008, ApJS, 177, 103
- Inoue et al. (2007) Inoue H., Terashima Y., Ho L. C., 2007, ApJ, 662, 860
- Ivezić et al. (2002) Ivezić Ž., et al., 2002, AJ, 124, 2364
- Iwasawa et al. (1998) Iwasawa K., Brandt W. N., Fabian A. C., 1998, MNRAS, 293, 251
- Jin et al. (2013) Jin C., Done C., Middleton M., Ward M., 2013, MNRAS, 436, 3173
- Jin et al. (2017) Jin C., Done C., Ward M., 2017, MNRAS, 468, 3663
- Keek & Ballantyne (2016) Keek L., Ballantyne D. R., 2016, MNRAS, 456, 2722
- Kellermann et al. (1989) Kellermann K. I., Sramek R., Schmidt M., Shaffer D. B., Green R., 1989, AJ, 98, 1195
- Kellermann et al. (1994) Kellermann K. I., Sramek R. A., Schmidt M., Green R. F., Shaffer D. B., 1994, AJ, 108, 1163
- Kinney et al. (2000) Kinney A. L., Schmitt H. R., Clarke C. J., Pringle J. E., Ulvestad J. S., Antonucci R. R. J., 2000, ApJ, 537, 152
- Komossa et al. (2006) Komossa S., Voges W., Xu D., Mathur S., Adorf H.-M., Lemson G., Duschl W. J., Grupe D., 2006, AJ, 132, 531
- Körding et al. (2006) Körding E., Falcke H., Corbel S., 2006, A&A, 456, 439
- Kukula et al. (1995) Kukula M. J., Pedlar A., Baum S. A., O’Dea C. P., 1995, MNRAS, 276, 1262
- Kukula et al. (1998) Kukula M. J., Dunlop J. S., Hughes D. H., Rawlings S., 1998, MNRAS, 297, 366
- Lal et al. (2004) Lal D. V., Shastri P., Gabuzda D. C., 2004, A&A, 425, 99
- Landi et al. (2005) Landi R., Malizia A., Bassani L., 2005, A&A, 441, 69
- Leighly & Moore (2004) Leighly K. M., Moore J. R., 2004, ApJ, 611, 107
- Li et al. (2008) Li Z.-Y., Wu X.-B., Wang R., 2008, ApJ, 688, 826
- Liu et al. (2002) Liu B. F., Mineshige S., Meyer F., Meyer-Hofmeister E., Kawaguchi T., 2002, ApJ, 575, 117
- Liu et al. (2014) Liu T., Wang J.-X., Yang H., Zhu F.-F., Zhou Y.-Y., 2014, ApJ, 783, 106
- Liu et al. (2015) Liu Z., Yuan W., Lu Y., Zhou X., 2015, MNRAS, 447, 517
- Lutz et al. (2004) Lutz D., Maiolino R., Spoon H. W. W., Moorwood A. F. M., 2004, A&A, 418, 465
- Marziani et al. (2003) Marziani P., Sulentic J. W., Zamanov R., Calvani M., Dultzin-Hacyan D., Bachev R., Zwitter T., 2003, ApJS, 145, 199
- Matsumoto et al. (2004) Matsumoto C., Leighly K. M., Marshall H. L., 2004, ApJ, 603, 456
- Matt et al. (2000) Matt G., Perola G. C., Fiore F., Guainazzi M., Nicastro F., Piro L., 2000, A&A, 363, 863
- McLure & Dunlop (2004) McLure R. J., Dunlop J. S., 2004, MNRAS, 352, 1390
- Merloni et al. (2003) Merloni A., Heinz S., di Matteo T., 2003, MNRAS, 345, 1057
- Miller et al. (1993) Miller P., Rawlings S., Saunders R., 1993, MNRAS, 263, 425
- Mineshige et al. (2000) Mineshige S., Kawaguchi T., Takeuchi M., Hayashida K., 2000, PASJ, 52, 499
- Mushotzky et al. (1993) Mushotzky R. F., Done C., Pounds K. A., 1993, ARA&A, 31, 717
- Nandra et al. (2007) Nandra K., O’Neill P. M., George I. M., Reeves J. N., 2007, MNRAS, 382, 194
- Ohsuga et al. (2005) Ohsuga K., Mori M., Nakamoto T., Mineshige S., 2005, ApJ, 628, 368
- Ohta et al. (2007) Ohta K., Aoki K., Kawaguchi T., Kiuchi G., 2007, ApJS, 169, 1
- Orienti & Prieto (2010) Orienti M., Prieto M. A., 2010, MNRAS, 401, 2599
- Osterbrock & Pogge (1985) Osterbrock D. E., Pogge R. W., 1985, ApJ, 297, 166
- Panessa et al. (2011) Panessa F., et al., 2011, MNRAS, 417, 2426
- Panessa et al. (2015) Panessa F., et al., 2015, MNRAS, 447, 1289
- Papadakis et al. (2007) Papadakis I. E., Brinkmann W., Page M. J., McHardy I., Uttley P., 2007, A&A, 461, 931
- Parra et al. (2010) Parra R., Conway J. E., Aalto S., Appleton P. N., Norris R. P., Pihlström Y. M., Kewley L. J., 2010, ApJ, 720, 555
- Piconcelli et al. (2005) Piconcelli E., Jimenez-Bailón E., Guainazzi M., Schartel N., Rodríguez-Pascual P. M., Santos-Lleó M., 2005, A&A, 432, 15
- Qiao & Liu (2015) Qiao E., Liu B. F., 2015, MNRAS, 448, 1099
- Ramírez (2013) Ramírez J. M., 2013, A&A, 551, A95
- Reeves & Turner (2000) Reeves J. N., Turner M. J. L., 2000, MNRAS, 316, 234
- Reis & Miller (2013) Reis R. C., Miller J. M., 2013, ApJ, 769, L7
- Romero et al. (2017) Romero G. E., Boettcher M., Markoff S., Tavecchio F., 2017, Space Sci. Rev., 207, 5
- Rushton et al. (2010) Rushton A., Spencer R., Fender R., Pooley G., 2010, A&A, 524, A29
- Rushton et al. (2016) Rushton A. P., et al., 2016, MNRAS, 463, 628
- Ryan et al. (2007) Ryan C. J., De Robertis M. M., Virani S., Laor A., Dawson P. C., 2007, ApJ, 654, 799
- Rybicki & Lightman (1986) Rybicki G. B., Lightman A. P., 1986, Radiative Processes in Astrophysics
- Sani et al. (2010) Sani E., Lutz D., Risaliti G., Netzer H., Gallo L. C., Trakhtenbrot B., Sturm E., Boller T., 2010, MNRAS, 403, 1246
- Sa̧dowski & Narayan (2015) Sa̧dowski A., Narayan R., 2015, MNRAS, 453, 3213
- Schmitt et al. (2001) Schmitt H. R., Ulvestad J. S., Antonucci R. R. J., Kinney A. L., 2001, ApJS, 132, 199
- Shinozaki et al. (2006) Shinozaki K., Miyaji T., Ishisaki Y., Ueda Y., Ogasaka Y., 2006, AJ, 131, 2843
- Shu et al. (2010) Shu X. W., Yaqoob T., Wang J. X., 2010, ApJS, 187, 581
- Stepanian et al. (2003) Stepanian J. A., et al., 2003, ApJ, 588, 746
- Stern et al. (1995) Stern B. E., Poutanen J., Svensson R., Sikora M., Begelman M. C., 1995, ApJ, 449, L13
- Strateva et al. (2005) Strateva I. V., Brandt W. N., Schneider D. P., Vanden Berk D. G., Vignali C., 2005, AJ, 130, 387
- Sulentic et al. (2000) Sulentic J. W., Zwitter T., Marziani P., Dultzin-Hacyan D., 2000, ApJ, 536, L5
- Sulentic et al. (2007) Sulentic J. W., Bachev R., Marziani P., Negrete C. A., Dultzin D., 2007, ApJ, 666, 757
- Tchekhovskoy et al. (2014) Tchekhovskoy A., Metzger B. D., Giannios D., Kelley L. Z., 2014, MNRAS, 437, 2744
- Thean et al. (2001) Thean A., Pedlar A., Kukula M. J., Baum S. A., O’Dea C. P., 2001, MNRAS, 325, 737
- Turner et al. (2001) Turner T. J., Romano P., George I. M., Edelson R., Collier S. J., Mathur S., Peterson B. M., 2001, ApJ, 561, 131
- Ueda et al. (2001) Ueda Y., Ishisaki Y., Takahashi T., Makishima K., Ohashi T., 2001, ApJS, 133, 1
- Ulvestad & Wilson (1984a) Ulvestad J. S., Wilson A. S., 1984a, ApJ, 278, 544
- Ulvestad & Wilson (1984b) Ulvestad J. S., Wilson A. S., 1984b, ApJ, 285, 439
- Ulvestad et al. (1995) Ulvestad J. S., Antonucci R. R. J., Goodrich R. W., 1995, AJ, 109, 81
- Véron-Cetty & Véron (2010) Véron-Cetty M.-P., Véron P., 2010, A&A, 518, A10
- Véron-Cetty et al. (2001) Véron-Cetty M.-P., Véron P., Gonçalves A. C., 2001, A&A, 372, 730
- Vestergaard & Peterson (2006) Vestergaard M., Peterson B. M., 2006, ApJ, 641, 689
- Vignali et al. (2004) Vignali C., Brandt W. N., Boller T., Fabian A. C., Vaughan S., 2004, MNRAS, 347, 854
- Wang & Lu (2001) Wang T., Lu Y., 2001, A&A, 377, 52
- Wang & Netzer (2003) Wang J.-M., Netzer H., 2003, A&A, 398, 927
- Wang & Zhou (1999) Wang J.-M., Zhou Y.-Y., 1999, ApJ, 516, 420
- Wang et al. (1996) Wang T., Brinkmann W., Bergeron J., 1996, A&A, 309, 81
- Wang et al. (2006) Wang R., Wu X.-B., Kong M.-Z., 2006, ApJ, 645, 890
- Wang et al. (2013) Wang J.-M., Du P., Valls-Gabaud D., Hu C., Netzer H., 2013, Physical Review Letters, 110, 081301
- Wang et al. (2014) Wang J.-M., et al., 2014, ApJ, 793, 108
- Whalen et al. (2006) Whalen D. J., Laurent-Muehleisen S. A., Moran E. C., Becker R. H., 2006, AJ, 131, 1948
- Winter et al. (2012) Winter L. M., Veilleux S., McKernan B., Kallman T. R., 2012, ApJ, 745, 107
- Xie & Yuan (2016) Xie F.-G., Yuan F., 2016, MNRAS, 456, 4377
- Yao et al. (2015) Yao S., Yuan W., Zhou H., Komossa S., Zhang J., Qiao E., Liu B., 2015, MNRAS, 454, L16
- Yuan & Cui (2005) Yuan F., Cui W., 2005, ApJ, 629, 408
- Yuan et al. (2008) Yuan W., Zhou H. Y., Komossa S., Dong X. B., Wang T. G., Lu H. L., Bai J. M., 2008, ApJ, 685, 801
- Zhou et al. (2006) Zhou H., Wang T., Yuan W., Lu H., Dong X., Wang J., Lu Y., 2006, ApJS, 166, 128
- de Gasperin et al. (2011) de Gasperin F., Merloni A., Sell P., Best P., Heinz S., Kauffmann G., 2011, MNRAS, 415, 2910
- de La Calle Pérez et al. (2010) de La Calle Pérez I., et al., 2010, A&A, 524, A50