Spontaneous continuous orbital motion of a pair of nanoparticles levitated in air
Abstract
We report on the discovery of a unidirectional continuous orbital motion of a single pair of nanoparticles which occurs spontaneously in room-temperature air and can be manipulated by light. By varying the relative position of two nanoparticles, we demonstrate a phase transition between two Brownian particles and a pair of co-orbiting particles. The orbital motion is sensitive to air pressure and is vanishing at low pressure, suggesting that the orbital motion is supported by air. Our results pave the way for manipulating nanoscale objects on the basis of their cooperative dynamics.
Nanoscale mechanical devices play crucial roles in the operation of biological systems Schliwa (2006); Kinbara and Aida (2005). Recent years have witnessed substantial progresses in designing and manufacturing artificial versions of such devices, resulting in a plethora of molecular motors and rotors Kinbara and Aida (2005); Kay et al. (2007). These devices comprise functional molecular parts, with each part subject to random Brownian motion imposed by surrounding environment. Extensive efforts in biophysics and nonequilibrium physics have elucidated that the Brownian motion triggers unidirectional transport of nanoscale objects Astumian and Derényi (1998); Reimann (2002); Hänggi and Marchesoni (2009); Faucheux et al. (1995).
A distinct approach for manipulating nanoscale objects has been established in the field of optomechanics, where the motion of objects is precisely controlled via light-matter interactions Aspelmeyer et al. (2014); Kippenberg and Vahala (2008). With the aim of engineering mesoscopic and macroscopic quantum states, a number of studies have realized the coherent control of the motion of nano- and micro-mechanical oscillators, such as cooling to their quantum ground state O’Connell et al. (2010); Teufel et al. (2011); Chan et al. (2011). In these studies, in stark contrast to biological and artificial nanomachines, dissipations to the surrounding environment are major obstacles in controlling the objects and thus are carefully removed, e.g. by evacuating the chamber and/or by pre-cooling the entire system.
Here, we report on the discovery and the control of spontaneous continuous optomechanical oscillations of nanoparticles laser-trapped in room-temperature air. By measuring the spatiotemporal evolution of the light scattered by nanoparticles, we clarify that the oscillation originates from a continuous orbital motion of nanoparticles. Furthermore, we reveal that the orbital motion occurs only when more than one nanoparticles are trapped in a single optical potential and stops when they are spatially separated. The observed phase transition between two Brownian particles and a pair of co-orbiting particles is a particular realization of the collective pattern formation of stochastically moving objects, which have been of great interest in biological, physical, and social systems Romanczuk et al. (2012). A remarkable aspect of the orbital motion is that it is relevant to both of the aforementioned two approaches in controlling nanoscale objects: the orbital motion occurs only in a strongly dissipative environment, while the orbiting frequency is proportional to the laser power and can be precisely controlled by it. The observed process is qualitatively different from known light-induced oscillations such as phonon lasing Vahala et al. (2009); Grudinin et al. (2010) and the parametric instability Braginsky et al. (2001); Rokhsari et al. (2005); Metzger et al. (2008), which exhibit a threshold and a saturation behavior with respect to the power of the applied light and does not require any dissipative mechanism.
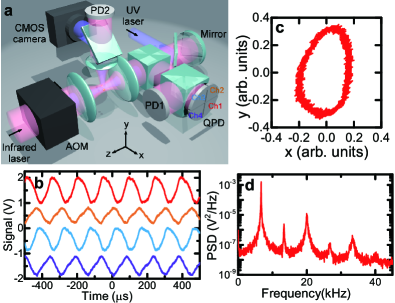
Our experimental setup is based on experiments with levitated nanoparticles Li et al. (2011); Gieseler et al. (2012); Vovrosh et al. (2017); Yoneda and Aikawa (2017) and is schematically shown in Fig. 1(a) fno (a). We trap nanoparticles in a standing-wave optical trap, an optical lattice, that has been commonly used in atomic physics experiments Bloch et al. (2008). Because of the deep optical potential of the order of , where is the Boltzmann constant, trapped nanoparticles stay in a single site of the optical lattice for hours. Specifically for the present study, we introduce two components. First, a high-numerical-aperture objective lens allows us to acquire site-resolved images of trapped nanoparticles. Second, a quadrant photodetector (QPD) allows us to measure the spatiotemporal evolution of the motion of nanoparticles Millen et al. (2014).
The motion of nanoparticles trapped in air is random due to their Brownian motion. It is only at low pressures of below that their motion shows a clear oscillation with the frequency of the harmonic confinement Li et al. (2011); Gieseler et al. (2012); Vovrosh et al. (2017); Yoneda and Aikawa (2017); Grimm et al. (2000); Chang et al. (2010). Previous experiments for cooling the motion of nanoparticles have been performed in such a pressure regime and have employed silica nanoparticles with radii of about . By contrast, the present study uses nanoparticles with radii of about . We discover that, when trapped in an optical lattice, they spontaneously exhibit a clear oscillatory behavior despite in room-temperature air fno (b). Once the oscillation starts, it survives for more than two hours without changing its frequency and amplitude. The phase difference of about 90 degrees among four channels of the QPD unambiguously shows that trapped nanoparticles are orbiting [Fig. 1(b)]. The trajectory of the orbiting nanoparticles, recovered from the QPD signals, is shown in Fig. 1(c) fno (a). The phase relations are stable for hours, indicating that the orbital motion is unidirectional and its axis is fixed fno (c). The orbiting frequencies observed during many realizations are scattered widely from a few kHz up to and do not coincide with the frequencies of the harmonic confinement fno (a). The temperature of the orbital motion calculated from its amplitude is of the order of , suggesting that there exists a robust mechanism for supporting the far-from-equilibrium dynamics.
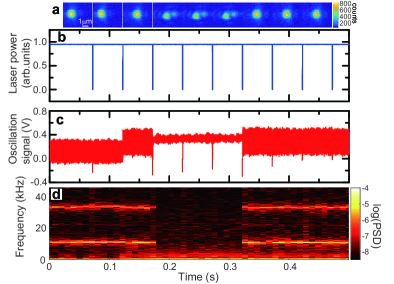
It is very unlikely that single Brownian particles abruptly start to orbit at a specific frequency and keep orbiting stably. With a speculation that more than one nanoparticle is involved in this phenomenon, we test if it is possible to release one of trapped nanoparticles by applying an intensity modulation on the trapping beam. As a result, we find that switching off the trapping beam induces the locomotion of trapped nanoparticles along the trapping beam and occasionally alters the relative distance of two nanoparticles (Fig. 2). After the trapping beam is switched off for , two nanoparticles trapped in a single lattice site get apart and trapped separately in two lattice sites. At the same instance, the orbital motion is stopped. In this configuration, the wide-spread power spectrum indicates that there are only Brownian particles. With additional switching-off pulses, they again get trapped in a single lattice site and start to orbit at the same frequency as before. Such a behavior is the direct evidence for the two crucial aspects of the phenomenon. First, the orbital motion occurs only when more than one nanoparticles are trapped in a single site of the optical lattice. Second, even trapped in the same potential, these nanoparticles are not attached to each other and can move individually fno (d).
The striking aspect of the orbital motion is that it survives without changing its amplitude for hours even in the presence of air friction. For clarifying the role of air, we vary the pressure around the trap region and acquire the oscillation signals at various pressures [Fig. 3, (a) and (b)]. We extract the orbiting frequencies and the spectral widths by fitting the PSD with a Lorentzian function fno (a). Remarkably, we observe a behavior opposite to our expectation of observing even stronger oscillations at low pressures. The orbiting frequency shows a maximum value at around . Below this pressure, the orbital motion is slowed with a decreased pressure and is hardly observable at below . Approaching this pressure, we observe a dramatic increase in the spectral width of the PSD. These facts show that the presence of air is essential for the orbital motion.
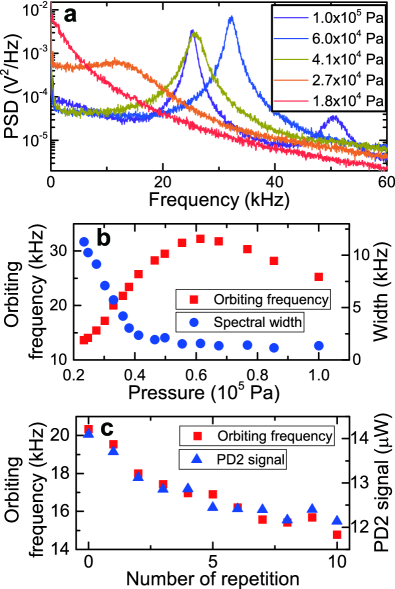
It is interesting to see what would happen to the nanoparticles if we bring them to a low pressure, where the orbital motion is hardly observable, and then again to higher pressures. In particular, we are interested in whether the orbiting frequency is reproduced each time. The result of repeating such a procedure is shown in Fig. 3(c), where the measured orbiting frequency at a specific pressure () is plotted with respect to the number of repetitions. Importantly, we observe a slight, but clear monotonic decrease in the orbiting frequencies with each repetition. We interpret that this decrease results from a decrease in the sizes of nanoparticles. As shown in Fig. 3(c), the scattered infrared light also decreases with repetition. The magnitude of Rayleigh scattering from a nanoscale object is proportional to with being the radius of nanoparticles Cox et al. (2002) and thus is a sensitive measure of the size of nanoparticles. We infer that bringing nanoparticles to low pressures promotes the desorption of gas molecules attached to nanoparticles and accordingly alters the orbiting frequency. This measurement indicates that the orbiting frequency strongly depends on the size of nanoparticles.
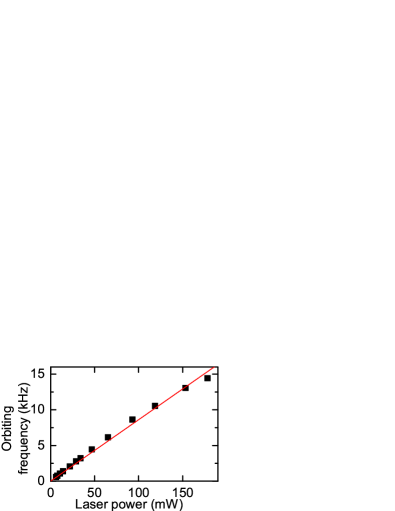
An important insight on the orbiting process is obtained by measuring how it is influenced by the trapping laser. We find that the orbiting frequency is nearly proportional to the laser power (Fig. 4). This behavior is in sharp contrast to the property of the frequency of the laser confinement, which is proportional to the square root of the laser power Grimm et al. (2000); Chang et al. (2010). The observed linearity is a direct proof that the orbital motion is qualitatively different from known light-induced oscillations, such as phonon lasing and the parametric instability, that are driven by radiation pressure: These phenomena show a threshold behavior with respect to the light power and a saturation at high power Vahala et al. (2009); Braginsky et al. (2001), neither of which is observed in the present study. Our argument is further strengthened by the fact that our experimental configuration has no mechanism of yielding rotational radiation pressure fno (a). We also point out that the heat generated at nanoparticles via light absorption is not likely to be the origin of the orbital motion, because its energy scale is orders of magnitude smaller than that of the orbital motion fno (a).
The observed orbital motion can be regarded as a particular realization of the self-organization or the collective pattern formation of randomly moving objects that have been observed in biological, physical, and social systems Romanczuk et al. (2012). Phase transitions between an ensemble of randomly moving objects and their collective ordering have attracted great interests from the viewpoint of nonequilibrium statistical physics Vicsek et al. (1995). As compared to other systems, which involve many objects, the present case is distinct in that a phase transition is observed only with two particles. The vortex pattern formation is of particular relevance to the present study and a theoretical model based on a two-dimensional limit cycle has been proposed Erdmann et al. (2002); Erdmann and Ebeling (2005). The common feature found in these studies is that the spatial order is broken with the addition of noise, in contrast to the present study where the source of dissipation, air, is inevitable for the orbital motion to occur. Thus, we find that, although a similar theoretical model may be applicable to the present case, a qualitatively new feature has to be introduced to the model for describing the orbital motion.
To conclude, we have discovered a spontaneous orbital motion of two laser-trapped nanoparticles and demonstrated a phase transition between two Brownian particles and a pair of co-orbiting particles. The orbital motion requires the presence of air and its frequency is proportional to the laser power. Elucidating the driving mechanism of the orbital motion will be an important future task. Our work opens up a unique possibility of manipulating nanoscale objects with their cooperative dynamics. With the high controllability and the precision for observing nanoparticles, our system will be ideal for exploring the collective behaviors of few-particle systems at far-from-equilibrium. Furthermore, owing to the high sensitivity to the mass variation of nanoparticles, our system provides a new approach for nanoscale gas sensing Wang (2004).
I Supplementary Information
I.1 Experimental setup
A single-frequency infrared laser at a wavelength of with a power of about is focused to a beam waist of about and is retro-reflected to form a standing-wave optical trap (an optical lattice). A piezo module attached to the retro-reflecting mirror allows us to precisely control the position of the trapped nanoparticles in the direction. The light is linearly polarized along the direction. The intensity of the trapping beam is controlled by an acousto-optic modulator (AOM). A part of the trapping beam is extracted at a polarization beam splitter and is used for detecting the motion of nanoparticles via two photodetectors. A balanced photodetector (PD1) subtracting the signal without nanoparticles from the signal with nanoparticles provides a low noise signal. A quadrant photodetector (QPD) provides the time evolution of the spatial distribution of the trapping beam. The DC voltage of the QPD is about for all the four channels. The trapped nanoparticles are imaged through an objective lens with a numerical aperture of 0.42 on a CMOS camera. For imaging, an ultraviolet (UV) light at is overlapped with the trapping laser with a dichroic mirror and shone on nanoparticles. The infrared light scattered perpendicularly to the trapping beam by nanoparticles is monitored via an independent photodetector (PD2) that allows us to estimate the size of nanoparticles. The setup around the trap region is installed in a vacuum chamber.
I.2 Loading nanoparticles
We load nanoparticles into the trap in the following manner Gieseler et al. (2012); Vovrosh et al. (2017); Yoneda and Aikawa (2017); Millen et al. (2014). For each implementation, we introduce a mist of ethanol including nanoparticles into the vacuum chamber. When an ethanol droplet crosses a tightly focused laser beam at around the focus of the laser beam, ethanol is evaporated and nanoparticles are left trapped.
The frequencies of the harmonic confinement of nanoparticles are measured to be about , , and in the , , and directions, respectively, at around , slightly above the pressure where they disappear. We infer that the disappearance indicates evaporation due to heating with laser absorption (see below).
I.3 Estimation of the nanoparticle size
For silica nanoparticles, previous work has demonstrated a reliable method for estimating their size from the spectral width at around a few , which is determined by collisions with background gases Gieseler et al. (2012); Vovrosh et al. (2017). However, for nanoparticles, the same method does not provide a reliable estimation of their size, mainly because they are heated via light absorption and finally disappear at around . Therefore, we estimate the size of nanoparticles in the following manner. First, we measure the size of a silica nanoparticle according to the previous method Gieseler et al. (2012); Vovrosh et al. (2017) and simultaneously record the amplitude of the infrared scattering from it. Second, we record the amplitude of the infrared scattering from a nanoparticle. Third, taking into account the dependence of the photon scattering cross section of a nanoparticle on the refractive index , we relate the amplitude of the infrared scattering with the nanoparticle size. is given by the following expression:
| (1) |
where is the permittivity, is the wavelength of the trapping laser, and is the polarizability Cox et al. (2002); Jain et al. (2016). The value of the refractive index of silica used for this calculation is 1.45. The mean radius of the nanoparticles derived from about 60 measurements is .
I.4 Spontaneous oscillation
When only one particle is trapped in an optical lattice in room-temperature air, its PSD is wide-spread due to its Brownian motion. We confirm, on a CMOS camera, that in most cases the oscillation starts at the moment when nanoparticles are newly trapped. We confirm that the UV light for imaging does not have any influence on the oscillation. In the present study, we measure the orbiting frequency at the focus of the trapping beam by adjusting the position of nanoparticles with a piezo module attached to the retro-reflecting mirror.
The probability of observing the oscillation with nanoparticles during many implementations is about , which we interpret as a probability of trapping more than one particle in a single site of the optical lattice. The oscillation is also observed with nanoparticles made of other materials, such as silica and , with radii of about . However, with these materials, the probabilities of observing the oscillation during many implementations are lower than with . We still have not understood the origin of such a difference.
When the experiment is carried out with a single-beam optical trap, the oscillation hardly occurs and, even if it occurs, does not survive for more than a few seconds.
I.5 Analysis of the signal from the QPD
Each channel of the QPD detects the interference between the trapping beam and the scattered light from nanoparticles (homodyne detection) Gieseler et al. (2012); Vovrosh et al. (2017); Yoneda and Aikawa (2017); Millen et al. (2014). The length scale of the motion of nanoparticles in a trap is estimated to be about and is much smaller than the beam diameter (about ). Therefore, the length scale of the intensity modulation at the QPD introduced by the motion of nanoparticles should be much smaller than the size of the beam at the QPD. In such a situation, when a nanoparticle moves from the center of the beam, which we define to be the origin, to a coordinate , the intensity variations at the -th channel of the QPD are given by
| (2) | |||||
| (3) | |||||
| (4) | |||||
| (5) |
where is a numerical factor. Here we used the fact that the beam is nearly round in our experiment. Thus, we can recover the projection of the trajectory on the plane by using the detector signals as follows:
| (6) | |||
| (7) |
which are used to derive the trajectory shown in Fig. 1(c).
In this argument, we focused on the signal from a single nanoparticle. If two nanoparticles exist, we should observe the sum of the signals from both of them. Due to a large variation in the trapped nanoparticle size as mentioned before, we infer that the observed oscillation signal is dominated by the signal from the larger nanoparticle.
I.6 Fitting the PSD of the orbital motion
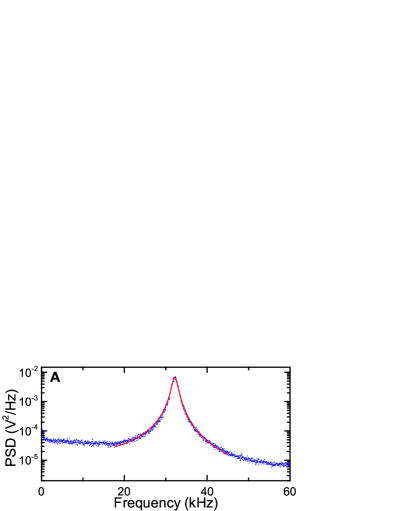
Empirically we find that the PSD of the orbital motion is well fitted by the Lorentzian function of the form
| (8) |
that has been used for describing the PSD of nanoparticles at various pressures Gieseler et al. (2012); Vovrosh et al. (2017). Here, denotes the angular frequency and , , and are fitting parameters representing the magnitude, the orbiting frequency, and the spectral width, respectively. A PSD of the orbital motion at and a fit to it are shown in Fig. 5. The quality factor of the oscillation extracted from the PSD [Fig. 1(d)] exceeds 200, enabling us to determine the orbiting frequency with a precision of the order of .
I.7 Absorption heating
The light absorption by nanoparticles can raise their internal temperature. It has been known that the heating effect is significant at low pressures Millen et al. (2014). However, in our working condition, we estimate that the temperature rise is minor, because nanoparticles are well cooled by surrounding air. Below we provide detailed arguments on our estimation.
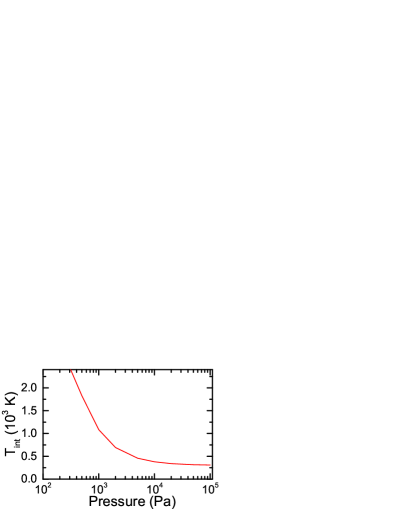
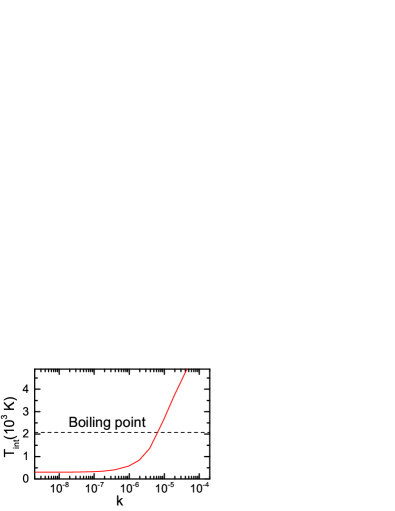
We calculate the internal temperature of trapped nanoparticles according to the formalism developed in Ref. Chang et al. (2010). For the calculation, four parameters specific to the material are needed: the complex dielectric constants at the wavelength of the trapping laser () and at the wavelength of blackbody radiation. The real and imaginary part of the dielectric constant are given by and , where and denote the refractive index and the extinction coefficient, respectively. We found literature values of and at around the wavelength of blackbody radiation (several m) to be 2.3 and 0.04, respectively Querry (1985). The value of at around the near infrared wavelength was also found to be 2.6 Karlsson et al. (1982). However, we are not able to find a literature value for at around . For estimating the value of at , we use the fact that the trapped nanoparticles disappear typically at around in our experiments. We interpret this disappearance as evaporation due to the temperature increase by laser absorption. Fig. 6 shows the calculated with respect to various values. The temperature of air is set to . Because evaporates at around , we estimate the value to be . Using this value, we estimate at various pressures (Fig. 7). We find that, at atmospheric pressure, the temperature increase is of the order of , which, in principle, produces a thermal gradient around the laser-trapped nanoparticles. However, it is unlikely that such a thermal gradient can be the origin of the orbital motion with a temperature of the order of . Moreover, if we assume that the absorption heating drives the orbital motion, we find a contradiction: at low pressure, the thermal gradient increases, whereas the orbital motion is attenuated.
Acknowledgements.
We thank M. Ueda, M. Kozuma, and K. Takeuchi for fruitful discussions. This work is supported by The Murata Science Foundation, The Mitsubishi Foundation, the Challenging Research Award and the ’Planting Seeds for Research’ program from Tokyo Institute of Technology, Research Foundation for Opto-Science and Technology, JSPS KAKENHI (Grant Number 16K13857 and 16H06016), and JST PRESTO (Grant Number JPMJPR1661).References
- Schliwa (2006) M. Schliwa, Molecular Motors (Wiley, 2006).
- Kinbara and Aida (2005) K. Kinbara and T. Aida, Chem. Rev. 105, 1377 (2005).
- Kay et al. (2007) E. R. Kay, D. A. Leigh, and F. Zerbetto, Angew. Chem. Int. Ed. 46, 72 (2007).
- Astumian and Derényi (1998) R. D. Astumian and I. Derényi, Eur. Biophys. journalJ. 27, 474 (1998).
- Reimann (2002) P. Reimann, Phys. Rep. 361, 57 (2002).
- Hänggi and Marchesoni (2009) P. Hänggi and F. Marchesoni, Rev. Mod. Phys. 81, 387 (2009).
- Faucheux et al. (1995) L. P. Faucheux, L. S. Bourdieu, P. D. Kaplan, and A. J. Libchaber, Phys. Rev. Lett. 74, 1504 (1995).
- Aspelmeyer et al. (2014) M. Aspelmeyer, T. J. Kippenberg, and F. Marquardt, Rev. Mod. Phys. 86, 1391 (2014).
- Kippenberg and Vahala (2008) T. J. Kippenberg and K. J. Vahala, Science 321, 1172 (2008).
- O’Connell et al. (2010) A. D. O’Connell, M. Hofheinz, M. Ansmann, R. C. Bialczak, M. Lenander, E. Lucero, M. Neeley, D. Sank, H. Wang, M. Weides, et al., Nature 464, 697 (2010).
- Teufel et al. (2011) J. Teufel, T. Donner, D. Li, J. Harlow, M. Allman, K. Cicak, A. Sirois, J. D. Whittaker, K. Lehnert, and R. W. Simmonds, Nature 475, 359 (2011).
- Chan et al. (2011) J. Chan, T. M. Alegre, A. H. Safavi-Naeini, J. T. Hill, A. Krause, S. Gröblacher, M. Aspelmeyer, and O. Painter, Nature 478, 89 (2011).
- fno (a) See Supplemental Materials for experimental details, analysis of the signal, and the estimation of absorption heating.
- Romanczuk et al. (2012) P. Romanczuk, M. Bär, W. Ebeling, B. Lindner, and L. Schimansky-Geier, Eur. Phys. J. Special Topics 202, 1 (2012).
- Vahala et al. (2009) K. Vahala, M. Herrmann, S. Knünz, V. Batteiger, G. Saathoff, T. Hänsch, and T. Udem, Nat. Phys. 5, 682 (2009).
- Grudinin et al. (2010) I. S. Grudinin, H. Lee, O. Painter, and K. J. Vahala, Phys. Rev. Lett. 104, 083901 (2010).
- Braginsky et al. (2001) V. Braginsky, S. Strigin, and S. P. Vyatchanin, Phys. Lett. A 287, 331 (2001).
- Rokhsari et al. (2005) H. Rokhsari, T. J. Kippenberg, T. Carmon, and K. J. Vahala, Opt. Express 13, 5293 (2005).
- Metzger et al. (2008) C. Metzger, M. Ludwig, C. Neuenhahn, A. Ortlieb, I. Favero, K. Karrai, and F. Marquardt, Phys. Rev. lett. 101, 133903 (2008).
- Li et al. (2011) T. Li, S. Kheifets, and M. G. Raizen, Nat. Phys. 7, 527 (2011).
- Gieseler et al. (2012) J. Gieseler, B. Deutsch, R. Quidant, and L. Novotny, Phys. Rev. Lett. 109, 103603 (2012).
- Vovrosh et al. (2017) J. Vovrosh, M. Rashid, D. Hempston, J. Bateman, M. Paternostro, and H. Ulbricht, J. Opt. Soc. Am. B 34, 1421 (2017).
- Yoneda and Aikawa (2017) M. Yoneda and K. Aikawa, J. Phys. B: At. Mol. Opt. Phys. 50, 245501 (2017).
- Bloch et al. (2008) I. Bloch, J. Dalibard, and W. Zwerger, Rev. Mod. Phys. 80, 885 (2008).
- Millen et al. (2014) J. Millen, T. Deesuwan, P. Barker, and J. Anders, Nat. Nanotech. 9, 425 (2014).
- Grimm et al. (2000) R. Grimm, M. Weidemüller, and Y. B. Ovchinnikov, Adv. At. Moe. Opt. Phys. 42, 95 (2000).
- Chang et al. (2010) D. E. Chang, C. Regal, S. Papp, D. Wilson, J. Ye, O. Painter, H. J. Kimble, and P. Zoller, Proc. Natl Acad. Sci. 107, 1005 (2010).
- fno (b) The oscillation is also observed with nanoparticles made of other materials, such as silica and TiO2, with radii of about .
- fno (c) Our measurement with the QPD cannot detect the motion in the direction. Hence, even if the signals show an orbital motion in the plane, it might be tilted with respect to the plane. During many implementations, we sometimes observe signals showing that the recovered trajectory is nearly a line along the direction. We interpret such a signal as indicating the orbital motion in the plane.
- fno (d) We confirm that the orbital motion is not influenced by a static electric field of up to 200 V/cm nor by a static magnetic field of up to 1000 G, suggesting that nanoparticles are not ionized and the Coulomb interaction between them does not play a role.
- Cox et al. (2002) A. Cox, A. J. DeWeerd, and J. Linden, Am. J. Phys. 70, 620 (2002).
- Vicsek et al. (1995) T. Vicsek, A. Czirók, E. Ben-Jacob, I. Cohen, and O. Shochet, Phys. Rev. Lett. 75, 1226 (1995).
- Erdmann et al. (2002) U. Erdmann, W. Ebeling, and V. S. Anishchenko, Phys. Rev. E 65, 061106 (2002).
- Erdmann and Ebeling (2005) U. Erdmann and W. Ebeling, Int. J. Bifurc. Chaos 15, 3623 (2005).
- Wang (2004) Z. L. Wang, Annu. Rev. Phys. Chem. 55, 159 (2004).
- Jain et al. (2016) V. Jain, J. Gieseler, C. Moritz, C. Dellago, R. Quidant, and L. Novotny, Phys. Rev. Lett. 116, 243601 (2016).
- Querry (1985) M. Querry, Contractor Report pp. CRDC–CR–85034 (1985).
- Karlsson et al. (1982) B. Karlsson, C. G. Ribbing, A. Roos, E. Valkonen, and T. Karlsson, Phys. Scr. 25, 826 (1982).