A trust-based recommendation method using network diffusion processes
Abstract
A variety of rating-based recommendation methods have been extensively studied including the well-known collaborative filtering approaches and some network diffusion-based methods, however, social trust relations are not sufficiently considered when making recommendations. In this paper, we contribute to the literature by proposing a trust-based recommendation method, named CosRA+T, after integrating the information of trust relations into the resource-redistribution process. Specifically, a tunable parameter is used to scale the resources received by trusted users before the redistribution back to the objects. Interestingly, we find an optimal scaling parameter for the proposed CosRA+T method to achieve its best recommendation accuracy, and the optimal value seems to be universal under several evaluation metrics across different datasets. Moreover, results of extensive experiments on the two real-world rating datasets with trust relations, Epinions and FriendFeed, suggest that CosRA+T has a remarkable improvement in overall accuracy, diversity and novelty. Our work moves a step towards designing better recommendation algorithms by employing multiple resources of social network information.
keywords:
Recommender system , Trust relations , Vertex similarity , Network diffusion , Complex networks1 Introduction
The fast development of information technologies has spawned the emergence of the E-commerce and largely boosted its expansion during the past decades [1, 2], especially in China along with its rapid economic growth [3, 4]. Recently, a large variety of online stories and services (e.g., online books, music, movies, etc) have made our lives much easier, however, the tremendous amount of available information in the era of big data has caused a serious problem of information overload [5]. For example, it will be extremely hard for us to review thousands of online stores before choosing a box of favourite chocolate. To address this problem, recommender systems as an information filtering technology have been widely applied by online platforms [6, 7], where users are provided customized and personalized services. Back to the example, recommender systems will automatically recommend us a few boxes of chocolate that may meet our tastes after analyzing our historical behavior big data including purchase records and search archive [8, 9] that are recorded by various socioeconomic platforms [10, 11].
As the core of recommender systems, a variety of recommendation algorithms have been proposed and applied to online platforms. One of the most well-known methods is the collaborative filtering (CF) [12] including the user-based CF (UCF) and the item-based CF (ICF), in which items of potential interest are recommended based on the similar users’ opinions and the similarity between items, respectively [13]. Later, some dynamical processes borrowed from the field of statistical physics are introduced into the design of diffusion-based recommendation algorithms including the heat conduction (HC) method [14], the mass diffusion (MD) method [15], a hybrid method of HC and MD [16], a weighted HC method [17], and some others [18, 19, 20]. The network-based diffusion is indeed a resource-allocation (RA) process [21], for example, MD is essentially a two-step RA process on “user-object” networks [22]. Within this framework, recent literature proposed a method built using the CosRA index [23], which combines advantages of both the cosine similarity and the RA index. In CosRA, resources are initialized for each object and then redistributed via the CosRA-based transformation. Other network-based methods are reviewed by the recent survey paper [24].
Most of these aforementioned recommendation algorithms are designed solely based on the users’ rating information [25], however, the relationships among users (e.g., trust relations [26, 27]) embedded in social networks are always ignored [28, 29]. Yet, in real-world observations, our preference of products or adoption of information could be also affected by our social relationships [30, 31] such as the friends in working places and the people connected through social media or by mobile phones [32]. Intuitively, we are more likely to adopt a trusted friend’s suggestions than those coming from a stronger in online communities [33]. To this point, some recent works have integrated trust relations into recommender systems [34, 35]. For example, Jamali et al. [36] proposed a random walk method that combines trust-based [37] and item-based CF approaches, Ma et al. [38] proposed a social trust ensemble framework that fuses both users’ tastes and trusted friends’ favors, Shen et al. [39] utilized a trust-combined user-based CF approach by proposing two user trust models, and Guo et al. [40] proposed a trust-based matrix factorization technique that integrates ratings and multiple trust information. However, studies on integrating trust relations into the diffusion-based methods remain still insufficiently [41], which urges further explorations on designing better methods under the network-based diffusion framework by leveraging multiple resources of social information.
In this paper, we propose a trust-based recommendation method, named CosRA+T, by introducing the trust relations among users into the resource-allocation processes of the original CosRA method. Specifically, the amount of the resources received by trusted users are scaled by a tunable parameter before the following redistribution back to their collected objects. Interestingly, we find an optimal value of the scaling parameter for the best recommendation accuracy under several evaluation metrics across different datasets, suggesting the universality of the optimal scaling in implicating the proposed CosRA+T method. Further, we employ two real-world rating and trust datasets, Epinions and FriendFeed, to comprehensively test the performance of CosRA+T and compare it with five benchmark methods. Results suggest that CosRA+T improves the overall performance by giving a highly accurate, inspiring diverse and well novel list of recommendations. Our work highlights the role that social trust relations play in enhancing the algorithmic performance of trust-based recommendation methods.
The remainder of this paper is organized as follows. Section 2 introduces some benchmark recommendation methods and the proposed CosRA+T method. Section 3 introduces the used datasets and performance evaluation metrics. Section 4 presents our main results. Finally, Section 5 provides conclusion remarks and related discussions.
2 Methods
In this section, we will first introduce some basic notations that are traditionally used in describing online rating systems and recommendation algorithms. Then, we will briefly describe the five benchmark methods. Last, we will introduce the proposed CosRA+T method in detail.
2.1 Notations and Benchmark Methods
Online rating systems can be modeled by a “user-object” bipartite network , where is the set of users, is the set of objects, and is the set of rating links. The bipartite rating network can be naturally represented by a adjacency matrix , where the element if there is a link connecting user and object , and the element if otherwise. The Greek and Latin letters are used to distinguish object-related and user-related indices, respectively. The key purpose of recommendation algorithms is to provide a list of objects in the recommendation list for the target user .
Five benchmark recommendation methods will be introduced in the following, including global ranking (GR), user-based collaborative filtering (UCF), heat conduction (HC), mass diffusion (MD), and CosRA. Based on the observations that users prefer popular objects, GR [22] as the most straightforward method recommends objects with the largest degree after sorting all objects in the descending order according to their degrees. In UCF, users will be recommended the objects collected by the users who share the similar tastes, where the user similarity is usually measured by the cosine similarity [42]. Together, there is also the item-based collaborative filtering (ICF), where similar objects to the users’ past collected ones will be recommended.
Both MD and HC can be considered as network-based resource-allocation processes. For a given user , the initial resource of all objects is denoted by the vector , where if user has collected object , and if otherwise. Then, these resources are reallocated via the transformation , where is the resource transfer matrix and is the vector of the final resource. The resource transfer matrices in MD and HC are mutually transposed [16]. Specifically, the element of in MD is given by [22]
| (1) |
and the element of in HC is given by [16]
| (2) |
where and are respectively the degrees of objects and , is the degree of user , and is the total number of users. So far, there have been many variants of the original resource transfer matrices and their associated recommendation algorithms [24].
CosRA is a recently proposed recommendation method based on the CosRA similarity index, which combines both the cosine index and the resource-allocation (RA) index [21]. Specifically, for a pair of objects and , the CosRA index is given by [23]
| (3) |
In CosRA, the resource of object is initialized as for a given user . Then, these resources are redistributed via the transformation , where is the -dimensional vector recording all the final resources that located on each object. After sorting all objects by their final resources , the top- uncollected objects are recommended to the user .
2.2 Trust-Based Recommendation Method
The trusted-based CosRA+T method is proposed by introducing the trust relations into the network-based diffusion processes of the original CosRA method. The intuition behind the new method is that not only the similarity among objects or users can help predict users’ preferences to objects, but also the friendship or trust relations could potentially affect users’ decisions on choosing objects. For example, if two users have the similar tastes as indicated by their past ratings, the performance of recommendations to either of them may be further improved if they are close friends who trust each other and have similar demands in the same living environment.
To explore the role that trust relations play in enhancing or suppressing the recommendation performance, we propose the CosRA+T method by taking the “user-user” trust network into consideration. The trust from user to defines a link from node to . Formally, the trust network can be represented by a adjacency matrix , where the element if there is a link from node to , and if otherwise. Together, Figure 1 illustrates the “user-object” bipartite network and the “user-user” trust network, where circles and squares correspond to users and objects, respectively. Note that, two circles in the same row connected by the dashed lines correspond to the same user. The trust relations are presented by solid directed and unweighted links from users (circles) in the right column to their trusted users (circles) in the left column.

The CosRA+T method works in three steps: First, for a given user , the resource that object is initially assigned is given by
| (4) |
where if user has collected object , and if otherwise. Second, user ’s neighboring users receive resources diffused through the bipartite network from their collected objects. Formally, the resource that user receives is given by
| (5) |
where and are respectively the degree of object and user , and is the total number of objects. Third, users redistribute their resources back to all objects after considering the trust relations from the target user . Specifically, the amount of user ’s resources are scaled by a tunable parameter before the redistribution if user is trusted by the user , otherwise the resources of user are directly redistributed back to the collected objects. Formally, the final resource that object receives regarding the target user is given by
| (6) |
where if user trusts user and if otherwise, is a tunable scaling parameter, and is the total number of users. After sorting all objects by their final resources , the top- uncollected objects are the recommendations to the target user .
As the value of the scaling parameter increases from 0 to 1, the effects of the trust information in CosRA+T gradually diminish. In the case of as illustrated in Figure 1(a), the resources of the trusted users become 1 no matter how many resources they receive while the resources of the untrusted users remain unchanged before the redistribution. In the case of as illustrated in Figure 1(b), the resources of the trusted users are squared and thus increased before the redistribution. In the case of as illustrated in Figure 1(c), the trust relations have no effects on the resource-allocation processes, and CosRA+T degenerates into the original CosRA method.
3 Data and Metrics
In this section, we first introduce the two rating datasets with the information of the trust relations among users, based on which we implement our CosRA+T method. Then, we introduce the evaluation metrics for testing the performance of recommendation methods.
3.1 Rating and Trust Datasets
Two benchmark rating datasets, namely, Epinions and FriendFeed, are used to test the recommendation performance. Epinions is a general consumer review website where people can review products by writing subjective reviews while FriendFeed is a social networking and bookmarking website where people can rate and share customized feeds. Both datasets use a 5-point rating scale from 1 to 5 (i.e., worst to best). For building the “user-object” rating network, ratings are converted to binary links by assigning 1 if the rating value is no less 3 and 0 if otherwise. After the coarse-graining, the Epinions dataset contains 4066 users, 7649 objects and 154122 rating links with the network sparsity , and the FriendFeed dataset contains 4148 users, 5700 objects and 96942 rating links with the network sparsity .
| Dataset | Users () | Objects () | Rating Links () | Sparsity () | Trust Links () | Sparsity () |
|---|---|---|---|---|---|---|
| Epinions | 4,066 | 7,649 | 154,122 | 4.96 | 217,071 | 1.31 |
| FriendFeed | 4,148 | 5,700 | 96,942 | 4.10 | 386,804 | 2.25 |
Notes: The is the rating network sparsity, and the is the trust network sparsity.
The two datasets contains also information of social networks, which can be used to estimate trust relations among users. On the two platforms (Epinions and FriendFeed), users can be friends by following each other in addition to rating objects. For building the “user-user” trust network, a directed binary link from node to is assigned 1 if user follows user and 0 if otherwise. Epinions dataset contains 217,071 trust links with the network sparsity , and FriendFeed dataset contains 386,804 trust links with the network sparsity . Basic statistics of the Epinions and FriendFeed datasets are summarized in Table 1.
3.2 Evaluation Metrics
We employ a 10-folder cross-validation strategy to evaluate the algorithmic performance in each independent realization. Specifically, all ratings are divided into 10 equal sized subsamples. Then, one subsample is left out as the testing set and the remaining 9 subsamples are used as the training set. Next, the cross-validation process is repeated 10 times, making sure that each subsample serves as the testing set once. Finally, the 10 results are averaged to produce one single result for this independent realization. To quantitatively compare the recommendation performance, we apply eight commonly used evaluation metrics, including five accuracy metrics (AUC, Ranking Score, Precision, Recall, and ), two diversity metrics (Hamming distance and Intra-similarity), and one novelty metric (Popularity). These metrics are respectively introduced in the following.
Accuracy is the most important metric for the recommendation performance evaluation. We start by introducing two accuracy metrics that are independent of the recommendation list’s length . One is the (area under the ROC curve) [43]. Given the ranks of all objects in the testing set, the value of corresponds to the probability that a randomly chosen collected object is ranked higher than a randomly chosen un-collected object. After times independent comparisons of the resources received by a pair of collected and un-collected objects, the value is calculated by [44]
| (7) |
where denotes the times that the collected object has more resources than the uncollected object, and denotes the times that they have the same amount of resources for user . Larger value suggests higher recommendation accuracy. The other one is the Ranking Score () [22]. For a given user, measures the relative ranking of a relevant object in the recommendation list. Formally, the value of is calculated by [22]
| (8) |
where is the size of the testing set, is the position of object in the ranking list of the recommendation, and is the number of uncollected objects of user in the training set. Smaller value suggests higher accuracy of a recommendation algorithm.
We then introduce three -dependent accuracy metrics: Precision, Recall, and [45]. For all user, the average value of Precision is calculated by
| (9) |
where is the number of recommended objects appeared in the testing set, and is the total number of recommended objects. The average value of Recall is calculated by
| (10) |
where is the total number of objects in the test set. Larger Precision and Recall suggest higher recommendation accuracy, however, the two measures are usually antagonistic since usually decreases with while usually grows with . To balance both Precision and Recall, the metric is introduced. The average value of is calculated by
| (11) |
where is the value of Precision and is the value of Recall for user . Larger value suggests higher recommendation accuracy.
Diversity is an important metric in evaluating the variety of recommendations. One diversity metric is Hamming distance [46]. The average value of Hamming distance is calculated by
| (12) |
where is the number of common objects in the lists of two users and with recommended objects. Larger value suggests higher diversity. The other diversity metric is Intra-similarity [47], which can be measured by the similarity between objects in the recommendation list. The average value of Intra-similarity is calculated by
| (13) |
where is the cosine similarity between objects and in the recommendation list of user with list’s length . Smaller value suggests higher diversity of recommendations.
Novelty is a key metric for quantifying an algorithm’s ability to generate novel (i.e., unpopular) and unexpected results [2]. Here, we use the Popularity of the recommended objects to estimate the novelty of recommendations. The average Popularity is calculated by
| (14) |
where is the degree of object in the recommendation list. Smaller value suggests higher novelty.
4 Results
In this section, we will first present the results on analyzing the effects of the scaling parameter in the proposed CosRA+T method. Then, we will show the results on the recommendation performance of the CosRA+T method and the five benchmark methods. Next, we study how the length of recommendation list affects the algorithmic performance. Finally, we presents the results to help understand the mechanisms of these methods.
4.1 The Impact of Scaling Parameter
In the proposed CosRA+T method, a tunable scaling parameter is used to scale the resources that are received by the trusted users before the redistribution. The effects of users’ trust relations on the resources-allocation processes increases as the scaling parameter decreases from 1 to 0. To explore the impact of the scaling parameter on the recommendation performance of the CosRA+T method, we vary from 0 to 1 and evaluate it on the Epinions and FriendFeed datasets by employing the three accuracy metrics: , , and . Figure 2 presents the corresponding results.
We observe that there seems to be an optimal value of the parameter for the best recommendation accuracy. This observation shows consistency on both Epinions and FriendFeed datasets under all the three accuracy metrics. Specifically, the values of and gradually increase as the increase of while slightly decrease after crosses its optimal value , which is around 0.70 for Epinions (see Figures 2(a) and 2(c) for and , respectively) and around 0.65 for FriendFeed (see Figures 2(d) and 2(f) for and , respectively). The value of decreases (i.e., the recommendation accuracy increases) as increases before crossing its optimal value for Epinions (see Figure 2(b)) and for FriendFeed (see Figure 2(e)).
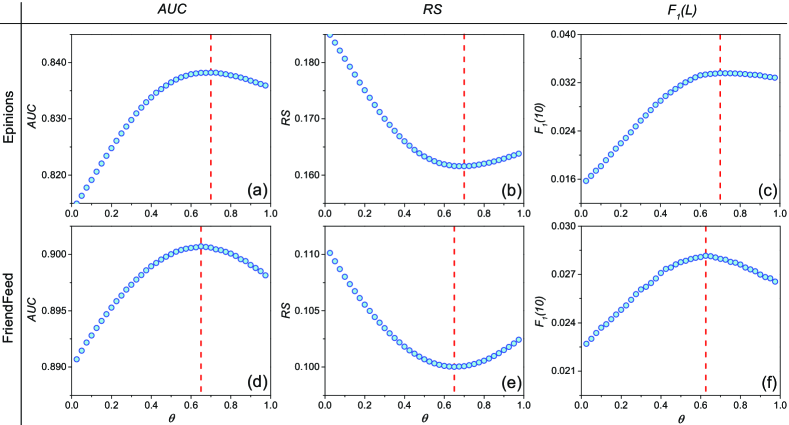
To investigate the universality of the optimal value and to better determine its critical value, we additionally employ the two -dependent accuracy metrics, namely, Precision and Recall. By varying the recommendation list’s length , we explore how the optimal value changes with respect to , and on both datasets and present the results in Figure 3. We find that the optimal value of the scaling parameter are not sensitive to the recommendation list’s length . The optimal values are around 0.70 and 0.65 for Epinions and FriendFeed as indicated by the horizontal trends in Figures 3(a) and 3(d), respectively. Similar trends are also observed for on both datasets (see Figure 3(b) for Epinions and Figure 3(e) for FriendFeed).

Further, we determine the optimal value by averaging the results under different for the three -dependent accuracy metrics and present the results in Figures 3(a) and 3(d) for Epinions and FriendFeed, respectively. Together, the results for the -independent accuracy metrics ( and ) are also included. We found that the optimal values ( for Epinions and for FriendFeed) are very close to each other under several accuracy metrics on different datasets, suggesting the universality of the optimal scaling in CosRA+T for its best performance. The presence of the optimal scaling suggests that integrating the trust relations can enhance the recommendation performance, however, relying too much on it may result in the opposite. In other words, the integration of the trust relations is like the two sides of one coin, when it comes to the improvement of recommendation accuracy.
4.2 Performance of Recommendation
We further provide a more comprehensive evaluation of the proposed CosRA+T method and compare its performance with the five benchmark methods, namely, GR, UCF, HC, MD, and CosRA. We apply five accuracy evaluation metrics including the two -independent metrics ( and ) and the three -dependent metrics (, and ). We also employ two -dependent diversity metrics ( and ) and one popularity metric (). In the experiments, we set for all -dependent metrics and analyze the impact of in the next section. In the comparisons with benchmark methods, CosRA+T method uses the optimal value for each dataset across all the evaluation metrics. Results of the algorithmic performance are summarized in Table 2.
As shown in the first five columns of Table 2, the proposed CosRA+T method outperforms all the five benchmark methods on both Epinions and FriendFeed datasets. Specifically, CosRA+T has remarkable advantages to GR, HC and UCF, as suggested by its larger value (0.8382 on Epinions and 0.9007 on FriendFeed). For the -dependent metrics, CosRA+T has even better performance than these benchmark methods, for example, CosRA+T gives remarkably larger and values on both datasets. Also, CosRA+T gives competitive value (0.0335) compared to that given by UCF (0.0259) and MD (0.0286) on Epinions. Moreover, the values of given by CosRA+T are the smallest on both datasets, indicating that CosRA+T performs the best in recommendation accuracy among all the considered methods.
| Methods | ||||||||
|---|---|---|---|---|---|---|---|---|
| Epinions | ||||||||
| GR | 0.6974 | 0.3006 | 0.0094 | 0.0315 | 0.0144 | 0.1338 | 0.1389 | 308 |
| HC | 0.7845 | 0.2161 | 0.0052 | 0.0153 | 0.0077 | 0.9742 | 0.0245 | 5 |
| MD | 0.8256 | 0.1735 | 0.0189 | 0.0590 | 0.0286 | 0.6753 | 0.1140 | 235 |
| UCF | 0.8141 | 0.1844 | 0.0170 | 0.0537 | 0.0259 | 0.5748 | 0.1317 | 262 |
| CosRA | 0.8356 | 0.1641 | 0.0221 | 0.0629 | 0.0327 | 0.9472 | 0.0900 | 107 |
| CosRA+T | 0.8382 | 0.1616 | 0.0226 | 0.0651 | 0.0335 | 0.9544 | 0.0917 | 101 |
| FriendFeed | ||||||||
| GR | 0.6058 | 0.3921 | 0.0050 | 0.0215 | 0.0081 | 0.0739 | 0.0935 | 172 |
| HC | 0.8833 | 0.1182 | 0.0088 | 0.0370 | 0.0142 | 0.9907 | 0.0542 | 11 |
| MD | 0.8925 | 0.1077 | 0.0163 | 0.0683 | 0.0263 | 0.9422 | 0.1195 | 73 |
| UCF | 0.8869 | 0.1133 | 0.0155 | 0.0661 | 0.0252 | 0.8857 | 0.1616 | 92 |
| CosRA | 0.8978 | 0.1028 | 0.0167 | 0.0633 | 0.0265 | 0.9895 | 0.0890 | 35 |
| CosRA+T | 0.9007 | 0.1000 | 0.0175 | 0.0693 | 0.0280 | 0.9899 | 0.1008 | 35 |
Notes: The length of the recommendation list is set as . The scaling parameter in CosRA+T is set as its optimal value for each dataset. The results are based on a 10-fold cross-validation and averaged over 20 independent realizations. The best result of each metric is in bold.
The diversity metrics are shown in the sixth and seventh columns of Table 2 for Hamming distance and Intra-similarity , respectively. We notice that the recommendations given by HC have the best diversity as measured by diversity metrics on both Epinions and FriendFeed. Even though, CosRA+T still outperforms the other four benchmark methods as it gives larger value (0.9544 on Epinions and 0.9899 on FriendFeed) and smaller value (0.0917 on Epinions and 0.1008 on FriendFeed). The inferior of CosRA+T to HC is indeed very small, for example, the differences between values are only 2.04% and 0.08% on Epinions and FriendFeed, respectively. Regarding the novelty of the recommendations, the performance of CosRA+T is also inspiring as it gives smaller value than most benchmark methods except for HC (see the last column of Table 2). These results suggest that CosRA+T has overall larger accuracy, more diversity and better novelty.
4.3 The Impact of Recommendation List’s Length
The length of recommendation list may affect the evaluation of recommendation performance under -dependent metrics including three accuracy metrics (, and ), two diversity metrics ( and ), and one novelty metric (). To this point, we explore how the length affects the performance of recommendation methods by varying from 1 to 100. The method of interest is CosRA+T, and benchmark methods are considered for comparison.
Figure 4 presents the results regarding the three accuracy metrics on both Epinions and FriendFeed datasets. We notice that, as the recommendation list’s length increases, the values of decreases (see Figures 4(a) and 4(d)) while the values of increases (Figures 4(b) and 4(e)) for all the considered methods. The values of first increases and then decreases as increases, where the values of reach their maximum at on Epinions (see Figure 4(c)) and on FriendFeed. Moreover, we find that the performance of CosRA+T is relatively better than other benchmark methods under different , and its advantages are even remarkable when is around its optimal value, for example, for Epinions. Further, we notice that CosRA+T has a relative improvement compared to the original CosRA, MD and UCF are competitive to each other, and HC and GR have the lowest accuracy.
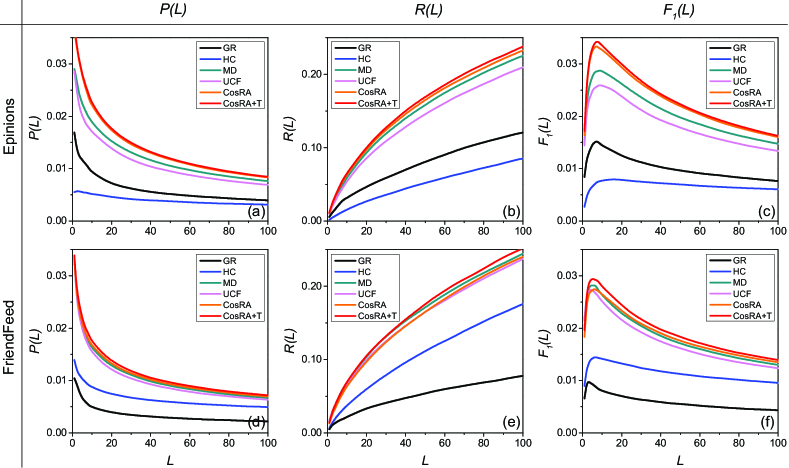
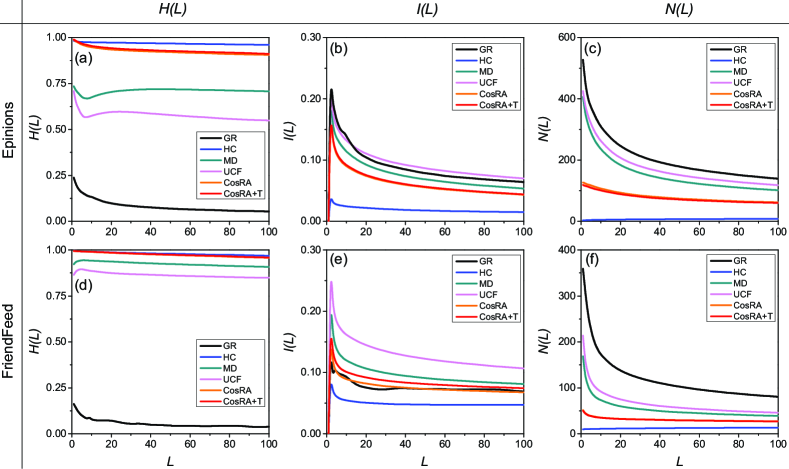
Figure 5 presents the results regarding the two diversity metrics and the novelty metric. For the Hamming distance, the values of slightly decrease as the increasing of on both Epinions and FriendFeed (see Figures 5(a) and 5(d)). MD always gives the best results, followed close by CosRA and CosRA+T. UCF is remarkably inferior to MD, and GR performs the worst. For the Intra-similarity, the values of first increase rapidly but then decreases slowly as increases (see Figures 5(b) and 5(e)). UCF performs the worst as indicated by its largest values. The performance of CosRA+T is ranked the second on Epinions but the middle on FriendFeed. HC outperforms all the other methods on both datasets as it gives the smallest values. For the Novelty, the values of decrease strongly as increases at the beginning but the decreases become slow thereafter (see Figures 5(c) and 5(f)). We notice that CosRA+T outperforms most of the benchmark methods in the novelty metric except for HC, and the result is not sensitive to . These results suggest that CosRA+T has relatively higher diversity and better novelty in the recommendations of uncollected objects.
4.4 The Analysis of Mechanisms
In order to better understand the mechanisms of the CosRA+T method, we further focus on the degree distributions of the recommended objects for all users. For the purpose of comparison, three benchmark methods (HC, MD and CosRA) are also considered in the study. Two different recommendation list’s lengths ( and ) are used. The scaling parameter in CosRA+T is set as its optimal value for each dataset. The results are presented in Figures 6(a-c) for Epinions and in Figures 6(d-f) for FriendFeed, respectively.
We notice that small-degree objects have a high probability to be recommended by HC (see Figures 6(a) and 6(e) for Epinions and FriendFeed, respectively), as suggested by the relatively small degrees of the recommended objects. By comparison, there is a large change for large-degree objects being recommended by MD (see Figures 6(b) and 6(f)) as we can observe that the degrees of its recommended objects are relatively large. These results suggest the strong trends and the potential bias of both HC and MD. When it comes to the recommendations, this issue may result in their remarkable disadvantages, for example, the low accuracy of HC and the poor novelty of MD.

By adopting a novel similarity index, CosRA fortunately finds a balance among the recommendation diversity and accuracy by recommending objects of large degree and small degree at the same time (see Figures 6(c) and 6(g) for Epinions and FriendFeed, respectively). The main reasons are that, in the calculation of the CosRA index, the effects of popular objects with large degrees are restricted, and the effects of small-degree users are enhanced. Further, by introducing the scaling parameter to enlarge the resources received by trusted users before the redistribution processes, CosRA+T relatively improves the algorithmic performance by recommending both large-degree and small-degree objects (see Figures 6(d) and 6(h)), especially when the recommendation list’s length is around its optimal value.
5 Conclusion and Discussions
In this paper, we explored the role of the trust relations among users in improving the performance of recommendation under the framework of network-based diffusion processes. Specifically, by introducing the trust relations into the original CosRA method, we proposed a trust-based recommendation method, named CosRA+T, in which the resources received by the trusted users are scaled by a tunable scaling parameter before being redistributed back to their collected objects in the networked resource redistribution process. We found an optimal scaling parameter for the proposed CosRA+T method, under which the method achieves the best accuracy in the recommendation. Interestingly, the optimal scaling values are very close to each other under different accuracy evaluation metrics on different rating and trust datasets. The result suggests the universality of the optimal scaling parameter in the proposed CosRA+T method for easy implementations.
Results of extensive experiments based on the two real-world rating and trust datasets, Epinions and FriendFeed, showed that the proposed CosRA+T method outperforms benchmark methods by giving a higher accuracy, an inspiring diversity and a well novelty in recommendations. Regarding the effects of the recommendation list’s length on the performance evaluations under some parameter-dependent metrics (e.g., Precision and Recall), we found that the optimal lengths of the recommendation list are nearly the same on the same dataset for different methods while the optimal lengths may differ on different datasets. Finally, we tried to provide some insights to the mechanisms of some considered methods through presenting the degree distributions of their recommended objects. Results suggested that CosRA and CosRA+T balance well both small-degree and large-degree objects, leading to their better performance. Our work provides a promising step towards enhancing the recommendation performance by additionally considering users’ social trust relations besides the traditionally used users’ ratings.
The presented results are under some limitations on the datasets and the modeling process, which call for further improvements towards designing a better method that deals well with accuracy, diversity and novelty. The evaluation of algorithmic performance uses two rating datasets with trust relations, which are only represents of numerous real-world online rating platforms and socioeconomic systems [11]. It would be an improvement if recommendation methods could be comprehensively tested and compared on various datasets and even on real platforms, focusing on how different recommendation algorithms affect the long-term evolution of online systems [48]. Moreover, the proposed method uses a simple way to enhance the resources received by trust users by a scaling parameter before the redistribution in the network-based diffusion processes. Yet, other possible realizations of introducing the trust relations into the rating-based methods under different frameworks could also be considered [22, 16]. Besides, not only social relationships (e.g., trust relations among users) but also users’ features (e.g., online reputation of users [49, 50]) are critical to web-based recommender systems. As future works, a promising step is to combine social trust information and users’ reputations [51, 52] to further improve the performance of personalized recommendation algorithms for real-world applications.
Acknowledgments
The authors thank Shi-Min Cai, Qian-Ming Zhang and Tao Zhou for helpful discussions. This work was partially supported by the National Natural Science Foundation of China (Grant Nos. 61673086 and 61703074).
References
- [1] J. B. Schafer, J. Konstan, J. Riedl, Recommender systems in e-commerce, in: Proceedings of the 1st ACM Conference on Electronic Commerce, ACM Press, New York, NY, USA, 1999, pp. 158–166.
- [2] L. Lü, M. Medo, C. H. Yeung, Y.-C. Zhang, Z.-K. Zhang, T. Zhou, Recommender systems, Physics Reports 519 (1) (2012) 1–49.
- [3] M. D. Clemes, C. Gan, J. Zhang, An empirical analysis of online shopping adoption in Beijing, China, Journal of Retailing and Consumer Services 21 (3) (2014) 364–375.
- [4] J. Gao, T. Zhou, Quantifying china’s regional economic complexity, Physica A 492 (2018) 1591–1603.
- [5] Y.-C. Chen, R.-A. Shang, C.-Y. Kao, The effects of information overload on consumers’ subjective state towards buying decision in the Internet shopping environment, Electronic Commerce Research and Applications 8 (1) (2009) 48–58.
- [6] J.-G. Liu, T. Zhou, B.-H. Wang, Research progress of personalized recommendation system, Progress in Natural Science 19 (1) (2009) 1–15.
- [7] J. Bobadilla, F. Ortega, A. Hernando, A. Gutiérrez, Recommender systems survey, Knowledge-Based Systems 46 (1) (2013) 109–132.
- [8] C.-J. Zhang, A. Zeng, Behavior patterns of online users and the effect on information filtering, Physica A 391 (4) (2012) 1822–1830.
- [9] L. Jin, Y. Chen, T. Wang, P. Hui, Understanding user behavior in online social networks: A survey, Communications Magazine IEEE 51 (9) (2013) 144–150.
- [10] C. L. P. Chen, C.-Y. Zhang, Data-intensive applications, challenges, techniques and technologies: A survey on Big Data, Information Sciences 275 (2014) 314–347.
- [11] J. Gao, T. Zhou, Big data reveal the status of economic development, Journal of the University of Electronic Science and Technology of China 45 (4) (2016) 625–633.
- [12] P. Resnick, N. Iacovou, M. Suchak, P. Bergstrom, J. Riedl, Grouplens: An open architecture for collaborative filtering of netnews, in: Proceedings of the 1994 ACM Conference on Computer Supported Cooperative Work, ACM Press, New York, NY, USA, 1994, pp. 175–186.
- [13] B. Sarwar, G. Karypis, J. Konstan, J. Riedl, Item-based collaborative filtering recommendation algorithms, in: Proceedings of the 10th International Conference on World Wide Web, ACM Press, New York, NY, USA, 2001, pp. 285–295.
- [14] Y.-C. Zhang, M. Blattner, Y.-K. Yu, Heat conduction process on community networks as a recommendation model, Physical Review Letters 99 (15) (2007) 154301.
- [15] Y.-C. Zhang, M. Medo, J. Ren, T. Zhou, T. Li, F. Yang, Recommendation model based on opinion diffusion, EPL (Europhysics Letters) 80 (6) (2007) 68003.
- [16] T. Zhou, Z. Kuscsik, J.-G. Liu, M. Medo, J. R. Wakeling, Y.-C. Zhang, Solving the apparent diversity-accuracy dilemma of recommender systems, Proceedings of the National Academy of Sciences, USA 107 (10) (2010) 4511–4515.
- [17] J.-G. Liu, Q. Guo, Y.-C. Zhang, Information filtering via weighted heat conduction algorithm, Physica A 390 (12) (2011) 2414–2420.
- [18] L. Lü, W. Liu, Information filtering via preferential diffusion, Physical Review E 83 (2) (2011) 066119.
- [19] C. Liu, W.-X. Zhou, Heterogeneity in initial resource configurations improves a network-based hybrid recommendation algorithm, Physica A 391 (22) (2012) 5704–5711.
- [20] A. Zeng, A. Vidmer, M. Medo, Y.-C. Zhang, Information filtering by similarity-preferential diffusion processes, EPL (Europhysics Letters) 105 (5) (2014) 58002.
- [21] Q. Ou, Y.-D. Jin, T. Zhou, B.-H. Wang, B.-Q. Yin, Power-law strength-degree correlation from resource-allocation dynamics on weighted networks, Physical Review E 75 (2) (2007) 021102.
- [22] T. Zhou, J. Ren, M. Medo, Y.-C. Zhang, Bipartite network projection and personal recommendation, Physical Review E 76 (4) (2007) 046115.
- [23] L.-J. Chen, Z.-K. Zhang, J.-H. Liu, J. Gao, T. Zhou, A vertex similarity index for better personalized recommendation, Physica A 466 (2017) 607–615.
- [24] F. Yu, A. Zeng, S. Gillard, M. Medo, Network-based recommendation algorithms: A review, Physica A 452 (2016) 192–208.
- [25] E.-P. Lim, V.-A. Nguyen, N. Jindal, B. Liu, H. W. Lauw, Detecting product review spammers using rating behaviors, in: Proceedings of the 19th ACM International Conference on Information and Knowledge Management, ACM Press, New York, NY, USA, 2010, pp. 939–948.
- [26] P. Massa, P. Avesani, Trust-aware recommender systems, in: Proceedings of the 2007 ACM Conference on Recommender Systems, ACM Press, New York, NY, USA, 2007, pp. 17–24.
- [27] H. Ma, M. R. Lyu, I. King, Learning to recommend with trust and distrust relationships, in: Proceedings of the Third ACM Conference on Recommender Systems, ACM Press, New York, NY, USA, 2009, pp. 189–196.
- [28] N. B. Ellison, C. Steinfield, C. Lampe, The benefits of facebook “friends”: Social capital and college students’ use of online social network sites, Journal of Computer-Mediated Communication 12 (4) (2007) 1143–1168.
- [29] J. Yuan, Q.-M. Zhang, J. Gao, L. Zhang, X.-S. Wan, X.-J. Yu, T. Zhou, Promotion and resignation in employee networks, Physica A 444 (2016) 442–447.
- [30] D. Centola, The spread of behavior in an online social network experiment, Science 329 (5996) (2010) 1194–1197.
- [31] J. Gao, T. Zhou, Y. Hu, Bootstrap percolation on spatial networks, Scientific Reports 5 (2015) 14662.
- [32] Q. Wang, J. Gao, T. Zhou, Z. Hu, H. Tian, Critical size of ego communication networks, EPL (Europhysics Letters) 114 (5) (2016) 58004.
- [33] H. Liao, G. Cimini, M. Medo, Measuring quality, reputation and trust in online communities, in: L. Chen, A. Felfernig, J. Liu, Z. W. Raś (Eds.), Foundations of Intelligent Systems, Springer Berlin Heidelberg, Berlin, Heidelberg, 2012, pp. 405–414.
- [34] J. O’Donovan, B. Smyth, Trust in recommender systems, in: Proceedings of the 10th International Conference on Intelligent User Interfaces, ACM Press, New York, NY, USA, 2005, pp. 167–174.
- [35] F. E. Walter, S. Battiston, F. Schweitzer, A model of a trust-based recommendation system on a social network, Autonomous Agents and Multi-Agent Systems 16 (1) (2008) 57–74.
- [36] M. Jamali, M. Ester, Trustwalker: A random walk model for combining trust-based and item-based recommendation, in: Proceedings of the 15th ACM SIGKDD International Conference on Knowledge Discovery and Data Mining, ACM Press, New York, NY, USA, 2009, pp. 397–406.
- [37] R. Andersen, C. Borgs, J. Chayes, U. Feige, A. Flaxman, A. Kalai, V. Mirrokni, M. Tennenholtz, Trust-based recommendation systems: An axiomatic approach, in: Proceedings of the 17th International Conference on World Wide Web, ACM Press, New York, NY, USA, 2008, pp. 199–208.
- [38] H. Ma, I. King, M. R. Lyu, Learning to recommend with explicit and implicit social relations, ACM Transactions on Intelligent Systems and Technology 2 (3) (2011) 1–19.
- [39] X. Shen, H. Long, C. Ma, Incorporating trust relationships in collaborative filtering recommender system, in: 2015 IEEE/ACIS 16th International Conference on Software Engineering, Artificial Intelligence, Networking and Parallel/Distributed Computing, IEEE Press, 2015, pp. 1–8.
- [40] G. Guo, J. Zhang, N. Yorkesmith, A novel recommendation model regularized with user trust and item ratings, IEEE Transactions on Knowledge and Data Engineering 28 (7) (2016) 1607–1620.
- [41] X. Wang, Y. Liu, G. Zhang, F. Xiong, J. Lu, Diffusion-based recommendation with trust relations on tripartite graphs, Journal of Statistical Mechanics: Theory and Experiment 2017 (8) (2017) 083405.
- [42] R.-R. Liu, C.-X. Jia, T. Zhou, D. Sun, B.-H. Wang, Personal recommendation via modified collaborative filtering, Physica A 388 (4) (2009) 462–468.
- [43] J. A. Hanley, B. J. McNeil, The meaning and use of the area under a receiver operating characteristic (roc) curve, Radiology 143 (1) (1982) 29–36.
- [44] T. Zhou, L. Lü, Y.-C. Zhang, Predicting missing links via local information, European Physical Journal B 71 (4) (2009) 623–630.
- [45] J. L. Herlocker, J. A. Konstan, L. G. Terveen, J. T. Riedl, Evaluating collaborative filtering recommender systems, ACM Transactions on Information Systems 22 (1) (2004) 5–53.
- [46] T. Zhou, L.-L. Jiang, R.-Q. Su, Y.-C. Zhang, Effect of initial configuration on network-based recommendation, EPL (Europhysics Letters) 81 (5) (2008) 58004.
- [47] T. Zhou, R.-Q. Su, R.-R. Liu, L.-L. Jiang, B.-H. Wang, Y.-C. Zhang, Accurate and diverse recommendations via eliminating redundant correlations, New Journal of Physics 11 (12) (2009) 123008.
- [48] D.-D. Zhao, A. Zeng, M.-S. Shang, J. Gao, Long-term effects of recommendation on the evolution of online systems, Chinese Physics Letters 30 (11) (2013) 118901.
- [49] J. Gao, Y.-W. Dong, M.-S. Shang, S.-M. Cai, T. Zhou, Group-based ranking method for online rating systems with spamming attacks, EPL (Europhysics Letters) 110 (2) (2015) 28003.
- [50] X.-L. Liu, J.-G. Liu, K. Yang, Q. Guo, J.-T. Han, Identifying online user reputation of user-object bipartite networks, Physica A 467 (2017) 508–516.
- [51] H. Liao, A. Zeng, R. Xiao, Z.-M. Ren, D.-B. Chen, Y.-C. Zhang, Ranking reputation and quality in online rating systems, PLoS ONE 9 (5) (2014) e97146.
- [52] J. Gao, T. Zhou, Evaluating user reputation in online rating systems via an iterative group-based ranking method, Physica A 473 (2017) 546–560.