Vertebrate pollinators: phase transition in a time-dependent generalized traveling-salesperson problem
Abstract
We introduce a model for the global optimization problem of nectar harvesting by flower visitors, e.g., nectar-feeding bats, as a generalization of the (multiple) traveling-salesperson problem (TSP). The model includes multiple independent animals and many flowers with time-dependent content. This provides an ensemble of realistic combinatorial optimization problems, in contrast to previously studied models like random Satisfiability or standard TSP.
We numerically studied the optimum harvesting of these foragers, with parameters obtained from experiments, by using genetic algorithms. For the distribution of travel distances, we find a power-law (or Lévy) distribution, as often found for natural foragers. Note, in contrast to many models, we make no assumption about the nature of the flight-distance distribution, the power law just emerges. This is in contrast to the TSP, where we find in the present study an exponential tail.
Furthermore, the optimization problem exhibits a phase transition, similar to the TSP, at a critical value for the amount of nectar which can be harvested. This phase transition coincides with a dramatic increase in the typical running time of the optimization algorithm. For the value of the critical exponent , describing the divergence of the correlation length, we find , which is on the other hand compatible with the value found for the TSP.
Finally, we also present data from field experiments in Costa Rica for the resource use for freely visiting flower bats. We found that the temporal patterns in experiments and model agree remarkably, confirming our model. Also the data show that the bats are able to memorize the positions of food sources and optimize, at least partially, their routes.
Key words: phase transitions, optimization, foraging, traveling salesperson, vertebrate pollinators
I Introduction
Evolution is a process of the constant optimizing of a species regarding its survival and reproduction capabilities. One particular activity each animal has to perform is harvesting Stephens et al. (2007); Prins and van Langevelde (2008). Hence nature poses another optimization problem, since every single animal has to optimize its own effort in obtaining as much food as needed with as little effort as possible in a potentially dangerous world.
However, each animal competes with other animals of the same and other species. Thus the food resources available within a given area are harvested simultaneously by, in our case, multiple bats. This poses the question of whether the single-animal optimization can even take into account the activity of other bats, such that overall optimal or near-optimal behavior is reached by the total group of animals. Being able to calculate such overall optima would allow the determination of how the efficiency of a bat’s behavior approaches the theoretical optimum solution. To date, a theoretical approach for this everyday animal foraging problem of determining minimum-effort harvesting optima in multiple bat and time-dynamic resource landscapes has, to our knowledge, not been published. With this study we present a corresponding model and an approach to determining such optima. Note that for static non-time dependent situations, simulations to detect optimal harvesting exist, e.g., for the social foraging behavior of bacteria like E.coli Liu and Passino (2002). On the other hand, also many models for search in random environments, but without spatio-temporal memory exist Viswanathan et al. (1996); van Dartel et al. (2004); Wosniack et al. (2017).
From the theoretical point of view, optimization problems have been moved into the focus of statistical physics, where the collective behavior of many-particle systems is investigated. Of particular interest are phase transitions, which are abrupt changes of the properties of a system, e.g., for the solid-liquid transition of water when increasing the temperature above the melting point. Few years ago, phase transitions have been observed Hartmann and Weigt (2005); Mitchell et al. (1992); Gent and Walsh (1996); Moore and Mertens (2011) also for simple random ensembles of optimization problems, like the (TSP), K-Satisfiability (K-SAT), or the vertex-cover problem. These ensembles have the advantage of being easy to describe but among practitioners they are often criticized as being very artificial and far from real-world problems.
Therefore, we study here an optimization problem directly occurring in nature, the problem Papadimitriou and Steiglitz (2000); Hartmann and Weigt (2005) of nectar harvesting by flower visitors. Nectar harvesting behavior leads to a single movement path during daily activity, with intermittent stops at flowers to collect nectar. The length of this path can serve as a measure of the cost of harvesting. This means we want to find spatio-temporal sets of paths, one path for each animal, such that the overall net gain of energy is maximized. The global optimization of the “nectar-harvesting problem” (NHP) is a generalization of the (multiple) traveling-salesperson problem (TSP) Gutin (2002), which is known to be NP-hard Garey and Johnson (1979). This means, that the NHP is computationally hard to solve and the only algorithms available are those, where the worst-case running time grows exponentially with the size of the problem (i.e. the number of flowers available in the environment). In comparison with the standard TSP there are further special characteristics of foraging at replenishing resource locations. First, a flower’s value is not only 0 or 1 but can take intermediate values depending on its current nectar content. Furthermore, flowers are revisited within the daily activity period as nectar is replenished through ongoing secretion. Thus we can expect that, from the computational point of view, the nectar harvesting problem NHP is even harder to solve than the TSP.
Note that the NHP does not take into account if a neural system could actually implement the optimization process used, instead it should serve as a null-model for the best optimizing bats possible, to which real bats and models based on learning theory can and could be compared with. Nevertheless, it is well known that swarm intelligence may lead to finding global optima. This is used in nature-inspired approaches like ant-colony optimization Dorigo and Stützle (2004); Pintea (2014). Therefore, investigating (near) global optima of the NHP might tell actually a lot about the global result of the individual behavior of real bats, even tough in the moment the capabilities of the individuals with respect to optimization are yet not extensively known.
The notion that bats optimize their behavior was motivated by data from field experiments in the Costa Rican rain forest, where we investigated the spatio-temporal behavior of nectar-feeding bats Winter and von Helversen (2001); Helversen and Winter (2003), which exploit resource landscapes with flowers at fixed locations offering nectar to their visitors in variable amounts depending on secretion rate and past exploitation events. Flower fields thus constitute potentially predictable resource distributions with deterministic spatio-temporal dynamics. Vertebrate flower visitors with cognitive abilities may have evolved mechanisms to adapt their resource-exploitation behavior to such dynamics. Hence each animal may be able to optimize its own behavior, justifying the comparison with the result of an optimization approach.
We analyzed the step-size distribution of the optimum paths. We observed a power-law, i.e., Lévy distribution of the flight distances as an emergent property of our model, without assuming a power-law distribution anywhere in the model. Note that for the related but much more abstract and non-time-dependent traveling-salesperson problem (TSP), our results presented below do not show power-law behavior but a faster exponential decrease. For the NHP, the power-law nature of the distribution is a true emergent property of the system and its optimization. Such distributions have been observed often in nature Cole (1995); Viswanathan et al. (1996); Humphries et al. (2010); Raichlen et al. (2014) and used, i.e., assumed in modelling approaches Viswanathan et al. (1999); Reynolds and Bartumeus (2009); Gautestad and Mysterud (2013); Zhao et al. (2015); Kuśmierz and Toyoizumi (2017). It is an open question F. (2007) whether the Lévy-type distributions seen in natural systems arise from an evolutionary process, as seen in some models van Dartel et al. (2004); Wosniack et al. (2017), or whether it is an emergent property of the system, as for the present case.
As we will furthermore show below, the NHP also exhibits a phase transition in terms of solvability, and computational complexity. This is similar to, e.g., K-SAT or TSP but in contrast to these previously studied model the NHP describes a quite realistic ensemble of real-world optimization problems. With our experiments we tested the validity of the three central assumptions on which our theoretical analyses are based and gathered evidence that real bats indeed optimize their foraging behavior. We assume that a forager discriminates within patches between resource locations differing in profitability. This requires spatial reference memory. Furthermore, a forager must remember its own foraging actions in order to avoid otherwise profitable locations after depletion and before subsequent replenishment. This requires spatial working memory. Thirdly, a forager able to visit resource locations along shortest travel paths needs besides a cognitive spatial representation the ability for odometry to discriminate path lengths. Our experimental data support these assumptions. Furthermore, our method of examining decision making and foraging behavior with free-ranging animals provides a novel experimental approach of how to actually test predictions of theoretical models under natural conditions.
II Material and methods
II.1 Model
An animal’s daily foraging tour consisted of a series of visits to flowers. Food intake during the visit to a flower depended on the current nectar content of the flower at the time of a visit, and was limited by the bat’s maximal intake rate and by its stomach capacity. Each tour was characterized by a total amount of nectar intake and a total amount of net energy gain, determined after the energy cost of foraging activities was subtracted.
A habitat was modeled as bats living in a square area of size one hectare (m2), where randomly placed flowers are available for feeding. Our model and the parameters we used are based on experimental data for bats obtained in earlier studies Winter and von Helversen (2001); Helversen and Winter (2003); Winter (1999). We studied habitats with up to 24 bats having 10 to 120 flowers available. The positions of the flowers determine the matrix of distances between flowers . Each flower produces nectar with rate , is the time during one night, in which at h the bats start harvesting. Here we considered usually constant production rates const l/h for h. For some simulations we also used triangle-like rates, which have and rise from h linearly with time until l/h, and decrease linearly with time afterward until h. Each flower can hold a maximum amount of nectar, here l
The behavior of each bat during one night is described by a series of visited flowers () and time moments when the flowers are reached. We assumed that all bats fly with constant speed m/s. Hence, the time to travel between the ’th and ’th visit is . The remaining time a bat spends at the ’th visit, most of the time at rest. An “instance” is a completed simulation based on a set of (randomly chosen) positions of the flowers together with resulting travel schedules of all bats during one night.
We are interested in the net energy balance of an instance . The net energy balance is the harvested nectar minus the nectar expended by the bats for the energetic cost of their tours (all energies are measured in terms of amount l of nectar). To be more specific, the net energy gain per bat is given by
| (1) | |||||
-
•
is the amount of nectar bat collects. If a bat arrives at a flower, it takes as much nectar as possible, i.e., limited by the amount of available nectar at the given time (which is determined by the nectar produced so far and the nectar taken during previous stops by this and other bats) and by the capacity of the stomach, here l for all bats. Nectar is digested with rate , hence after some time a full stomach can take additional nectar again.
-
•
determines the energy consumed by flying between the different visits and is determined by the total flight distance and by the energy consumption l/s (with velocity m/s).
-
•
accounts for a higher energy need when feeding at a flower (hovering flight) and is, for simplicity, for each bat just a constant energy l times the number of stops .
For our simulations, we are interested in maximizing the net energy gain for a given distribution of the flowers and number of bats. It is the net gain that an animal can invest directly or indirectly into reproduction. We used a genetic algorithm briefly described in the next subsection. This energy gain increases when the cost for collecting the nectar decreases. Biologically speaking, this would mean that a bat minimizes its own locomotion effort and that it also minimizes the effects of exploitative competition between itself and the other bats. In particular, we want to determine whether under given ecological conditions it is possible in principle for each bat to obtain enough nectar to meet at least its basic requirements. Having the optimum solution available, it is then possible to compare it with the performance of real bats. Agent-based simulations could also be used to test assumptions about information gathering, information processing, and decision making by individual or competing bats, extending previous experimental laboratory studies on the spatial memory and spatial cognition of bats Thiele and Winter (2005); Winter and Stich (2005)
II.2 Simulation Algorithms
We have performed computer simulations Hartmann (2015) using genetic algorithms Goldberg (1989) and using a greedy algorithm (see below) to find optimum or at least near-optimum solutions.
The basic idea of an evolutionary (or genetic) algorithm is to mimic the evolution of a group of possible schedules (often called “individuals” in this context, not to be confused with the bats) to the same problem. Schedules that adapt better to the optimization task (i.e. have a higher “fitness”) have a higher probability of survival. Thus they pass their genes in the simulation process more frequently to subsequent generations than others. This means that the average fitness of the population of schedules increases with time, hence one gradually approaches the optimum schedule. To be specific, we used a “population size” (not to be confused with the number of bats) ranging from 100 schedules (smallest system size) to 1000 realizations, tournament selection Goldberg and Deb (1991); Blickle and Thiele (1995), and an adaptive mutation rate of for each bat. Mutation operators allowed the random changing of the time a bat pauses after a series of visits by a small amount, as well as the insertion/deletion/exchange of one or several flowers within and between different schedules of an instance. As a crossover mechanism we took “time-point crossover”, which means that a new schedule can be built from taking the sequence of flowers visited before some absolute (randomly chosen) time from one schedule (for all bats), and the sequence of flowers visited after from a second schedule . We also applied local optimization steps, where changes are only accepted if they increase . Possible changes here are replacing a visited flower by another flower, changing the order in which two flowers are visited, or changing the time a bat pauses at a flower. To find the global optimum schedules with high probability we applied up to generations of the genetic algorithm.
We also computed exact solutions for single TSP problems Bektas (2003). We used this partially to generate initial schedules for the genetic algorithms, but also for the purpose of comparison of some quantities. Technically, we used the CONCORDE library. Applegate et al. (2003).
Also a “greedy” algorithm was used to find a solution of the NHP. Solutions from this algorithm may not converge as closely to the optimal solution as with the genetic algorithm. However, we applied it as the greedy heuristic derived from reinforcement learning could actually be similar to a strategy used by real bats. The greedy algorithm did not use the mutation and recombination methods of the genetic algorithm but instead proceeded as follows:
-
•
each bat approaches the flower with highest current energy gain (energy intake - energy costs for flight)
-
•
if the stomach of the bat is full, rest until fully digested
-
•
if highest energy gain is negative (cost of flying is higher than any nectar content) wait for 10 minutes and try again until a positive best energy gain is found.
As in the genetic algorithm, several problem instances were calculated with this strategy: typically an average over 800 runs was performed. Note that these systems are computationally easier, hence we could study larger systems.
II.3 Experiments
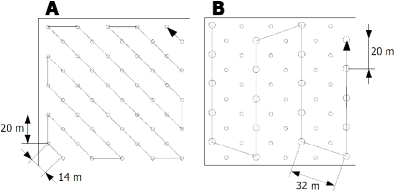
Experiments were conducted to gather evidence that real bats indeed optimize flight behavior. Data were obtained from eight individuals of free-flying Glossophaga commissarisi bats visiting a field of 50 artificial flowers Thiele (2006) in the rain forest at La Selva Biological Station, Costa Rica (Fig. 1).
Artificial flowers were computer controlled and produced nectar at a quality and rate found in natural flowers. Ongoing secretion occurred into a virtual nectar account that determined nectar availability during an actual visit by a bat. Bats had been caught and equipped with passive transponder identification tags (RFID PIT tags) prior to the experiments. We present the data from the first three days after onset of the experiment. Nectar-feeding bat species other than Glossophaga commissarisi were uncommon on the experimental plot ( captures) and did not participate in the experiment.
Each artificial flower was equipped with an electronic reader that identified a bat in real-time as it visited a flower. This allowed counting on an individual basis the visitation data of the free-flying bats.
Also, the delivery of nectar was dependent on the individual identity of the visiting bat. This allowed us to operate the flower field in a “non-competition” mode where separate sets of virtual nectar accounts that were kept for each individual allowed depletion and replenishment of nectar to be made individually specific and independent from the potential competition by others. This was useful, since we wanted to investigate cognitive abilities of individual bats by exposing them to experimentally defined conditions of food availability that remained unaffected by other individuals. Our artificial flowers were of two types “slowly refilling” (SR, 30 mins to refill) and “quickly refilling” (QR, 15 mins to refill). Flowers were arranged such that the closest neighbors of QR flowers were all SR (diagonal direction, 14 m) while the next QR type was further away (up-down direction, 20 m). The rationale behind this experiment was that while a forager naïve about flower qualities should minimize path length by flying diagonally, a forager with knowledge of flower quality should fly in up-down direction predominantly visiting QR flowers. Thus we expected a forager that optimizes to have a preferred angle of traveling within the flower field and that this angle would change, assuming quality is discriminated, after the spatial positions of QR flowers were learned.
III Results
Below we state the results of our simulations to find optimized joint exploitations of a habitat with randomly arranged flowers. The distribution of travel distances exhibits a power law as often found for natural systems. Also, we find a second order phase transition between a phase where enough resources are available to a phase where this is not the case. We characterize the phase transitions by means of finite-size scaling.
Also, we show results from the experiments in the rain forest, which, considering the frequency of visits during the night, agree qualitatively with the simulation results. Furthermore, the results indicate that the bats use their spatio-temporal memory to optimize their foraging paths.
III.1 Properties of optimized schedules
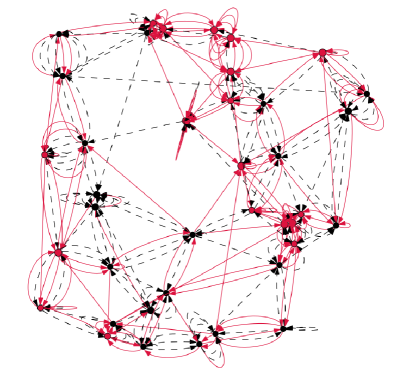
An example for an optimum solution of a one-night schedule for two bats having available 40 flowers is shown in Fig. 2. One can observe that all flowers are visited several times, but not too often, since it is beneficial after emptying a flower to wait before the flower is revisited. Correspondingly, the bats spent most of the time waiting at some flowers, which costs the least amount of energy. Note that for this sample solution, both bats visit basically all flowers.
Nevertheless, for larger number of bats and larger number of flowers, it becomes beneficial that the bats partition the area among them, because this reduces the overall flight distance slightly. To quantify this, we have measured the “area coverage” which is defined as follows: To each flower we assign a circle , centered at the position of the flower, which has a radius and therefore an area . For each bat of a tour , we take the union of all circles for the flowers visited and measure its covered area, i.e.,
| (2) |
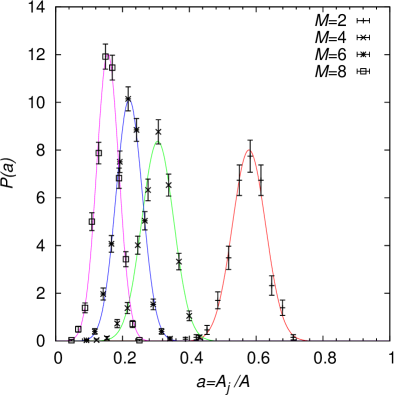
Therefore, flowers which are close to each other will not contribute so much to , because the corresponding circles overlap extensively. In this way the quantity takes into account the geographical distribution of the flowers, as compared to measuring just the fraction of visited flowers. This makes sense, because visiting close-by flowers will not cost so much energy for the bats. The measurement is done each time by two-dimensional numerical integration. In Fig. 3, the distribution of the relative area coverage (for all bats ), where is the total area, is shown for different number of bats and always 80 flowers. Note that the relative coverage of a bat visiting 80 randomly distributed flowers has a mean of approximately . Therefore, already 2 bats do not visit during a night all flowers, but almost all. Furthermore, one can observe that decreases on average with growing number of bats. This means, with increased competition, it becomes, to achieve a global cooperative optimum, more beneficial to partition the area among the bats. Therefore, only through the global optimization constraint, an indirect repulsive interaction among the bats is introduced.

Next, we present the distribution of flight distances between two consecutive stops, as shown in Fig. 4 for the case of 200 flowers and two bats, here, to fit all bats in, for a larger system m2. The histogram is taken from 100 independent problem instances. As visible, very small distances are rare, because the flower are distributed uniformly inside the square, therefore small distances do not occur very often, even if they are overrepresented in optimum schedules. The typical flight length is about 2 m. Large flight distances are also rare, which is reasonable because of the optimization task, therefore, if possible, long direct flights are avoided. Within the double-logarithmic scale, a power law is visible for large distances. From a fit we obtained an exponent . Note that the underlying distribution of distances, for a uniform random distributions of the flowers in the plane, is growing . Therefore, a power-law distribution which decreases with distance is not evident from the distribution of underlying distances. Nevertheless, a power-law (“Lévy-flight”) behavior is common for experimentally measured distribution of distances of natural foragers Cole (1995); Viswanathan et al. (1996); Humphries et al. (2010); Raichlen et al. (2014). Thus, such a power-law distribution was used in an analytically solvable “local-search” model Viswanathan et al. (1999) of harvesting with refilling resources. Within the model, a forager either moves to a close by resource if a filled one is available, and where otherwise the forager performs a long step with a random direction and a power-law distributed step length. The value of the exponent was determined from optimizing the efficiency, which resulted in an exponent , for the case the exact locations of resources in not known ( otherwise). This exponent is smaller than the result obtained here, i.e., the distribution for NHP decreases faster. The reason that very long distances are suppressed in the NHP with respect to the local search case, is that the global optimization target of NHP takes the full environment into account, leading to shorter solutions and avoiding long distances.

For a further comparison, we have also obtained the distribution of distances for the standard TSP case, here, for flowers distributed in the same square of side length m. The result is shown in Fig. 5. The behavior in the tail is very different, an exponential behavior is visible. We verified that this is not a finite size effect, by studying a much larger system with flowers, where we again found an exponential tail. The reason is apparently, due to the constant refilling of the flowers, for the time-dependent NHP it is more beneficial to take few long flights several times, as compared to the TSP, where each flower is visited exactly one time and it is not important when. Anyway, the addition of the biological characteristics of NHP like multiple harvesters and time-dependence make it apparently fundamentally different from the TSP. Hence, in general, studying ensembles of realistic optimization problems might lead in many cases to insights which cannot be provided solely by studying classical and very abstract optimization problems.
Also, we studied the temporal patterns of visits at flowers during one night for a direct comparison of simulation and experimental data. These data are explained in detail below, together with the corresponding experimental results, see Sec. III.4.
III.2 Phase transition
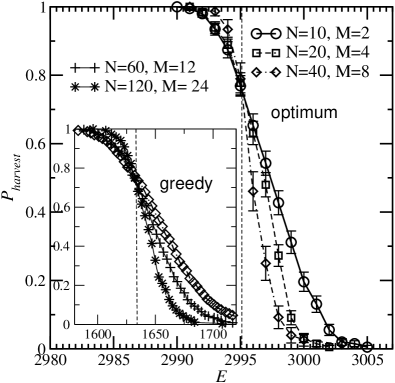
For each given random distribution of the flowers we obtained the maximum amount of the net energy, optimized over all schedules. We measured the probability that the bats can effectively harvest at least some given amount of energy per bat, i.e. the probability that . We have performed corresponding simulations for system sizes 10 flowers/2 bats, 20/4 and 40/8, so that the number of bats per flower was kept constant. In Fig. 6, the result obtained from averaging over 100 flower distributions is shown. Note that the amount of nectar produced by all flowers per 12-hour night amounted to 3024l per bat. Since the bats have to expend energy for flying, the net gain will always be less than the nectar energy produced.
The different curves cross near l and become steeper with growing system size . The “globally-optimizing” bats will be able most of the time to collect an amount of nectar smaller or equal to , which is very close to the amount of nectar produced during one night. Clearly, the bats will never be able to harvest all nectar, since each flower will produce some nectar after the last visit of a bat. From the behavior of the data it is visible that for very large systems with many bats and many flowers, keeping the same bat/flower ratio, we can expect a threshold behavior resembling a physical phase transition Stanley (1971), where suddenly a collective property of the system changes dramatically. Similar phenomena have recently been observed for artificial random ensembles of some classical NP-hard problems like TSP, K-SAT or the vertex-cover problem Hartmann and Weigt (2005). The phase transition observed here appears to be of interdisciplinary interest for researchers working on applied optimization and their relation to typical computational hardness, because in contrast to these rather academic cases like TSP and K-SAT, the NHP ensemble is a quite realistic and comprehensive model of a real-world problem.
Note that the actual existence of a phase transition does not depend on how well the bats optimize. The simulations based on the greedy algorithm (inset of Fig. 6) lead to lower individual net energy gain but again a transition is visible, just occurring at much lower energy l.
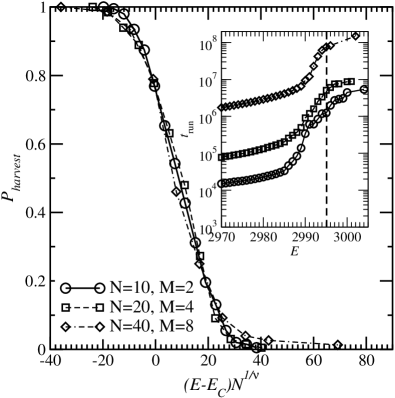
Next, we characterize this phase transition quantitatively by means of critical exponents as obtained from finite-size scaling (FSS) Goldenfeld (1992); Reichl (1998). FSS is a fundamental approach for overcoming the limited system sizes accessible in simulations by studying several “small” systems and extrapolating to large system sizes. Actually applying FSS works as follows: First, we determined as the point where the curves for different system sizes intersect. Next, we plotted as a function of , starting with and gradually changing the value of such that all curves collapse onto one, resulting in . The result is shown in Fig. 7. The fact that the data can be rescaled in this way means that the phase transition exhibits a growing correlation length, i.e. the optimal tours of the bats depend more and more on each other when the phase transition point is approached.
The value of the parameter is compatible with the value found in simulations of the TSP Gent and Walsh (1996). Therefore, with respect to the scaling of the phase transition, TSP and NHP might be comparable, opposed to the distribution of distances (see above), where TSP and NHP exhibit non-universality. Therefore, some characteristics of TSP “survive” in the more complicated multiple-traveler time-dependent NHP.
Next, we turn to the relationship between the phase transition and the behavior of the optimization algorithm. The genetic algorithm used to optimize gradually improves the solutions during the optimization. Hence at any given so-far running time of the algorithm, measured in (number of generations)(size of population), there exists a best so-far generated solution characterized by the net energy that is harvested during the corresponding tours. In the inset of Fig. 7 the running time required to gain a net energy is shown. Interestingly, the running time grows only moderately as a function of for energy less than , but exhibits a drastic increase very close to the phase transition. Note also the logarithmically scaled time axis. Thus, the data indicate that the running time increases exponentially as a function of problem size. Hence, the solvability of the NHP seems to be closely related to the typical degree of hardness in finding a solution on a computer. This behavior is similar to the run time behavior recently observed within the statistical-mechanical analysis of the above mentioned classical optimization problems like K-SAT Hartmann and Weigt (2005).
III.3 Experimental results
Next, we present the results from the experiments in the rain forest. Note that these experiments were performed without having the simulation results already at hand. Therefore, the experiments were not designed, e.g., to prove that a phase transition for real bats exists or that they achieve a harvesting close to optimum (which is an interesting question for sure, because natural evolution always aims at the optimum). Nevertheless, we were able to observe experimental indications that indeed bats in some way optimize over time and space. Also, we compare the distribution of activity over time between experiments and simulations, which yields a remarkable qualitative agreement. In the summary, we suggest refined experimental setups for future expeditions, where the simulation results are taken into account.
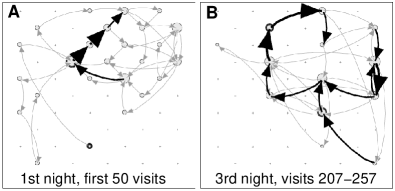
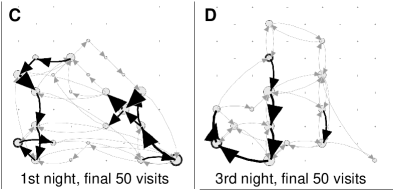
Here, we analyzed 772 bouts of activity by 8 bats. Feeding bouts lasted 1 to 3 mins during which 7 to 23 flowers were visited and were followed by intervals of resting for 5 to 25 mins. Bats flew between experimental flowers for minimum mean distances of 12 to 33 km per night. Within our experimental patch of flowers bats did not visit flowers at random. While initially SR and QR flowers were visited more or less equally (see Fig. 8A), after three days about 80% of the visits were to QR flowers (see Fig. 8B).
The spatial pattern of experimental flower distribution allowed us to evaluate if bats minimized the lengths of travel paths (Fig. 8). The experimental flowers were distributed such that a bat that did not discriminate between flower qualities should predominantly travel along diagonal directions to minimize travel distance whereas it should travel along up-down directions when preferring quickly-refilling flowers. Although we were not able to perform a large number of experiments to obtain good statistics, the data indicate that the angle of travel directions deviated significantly from random. Examples of this development of flight pattern are shown in Fig. 8 for two bats. At the onset of the experiments the mean angle was apparently closer to a diagonal orientation than to an up-down orientation (Fig. 8A, 8C) and this angle changed to a predominantly up-down direction towards the end of the experiment (Fig. 8B, 8D). This result shows that the bats were both able to distinguish the quality of flowers and minimize path lengths (while preferentially sticking to QR flowers) and that they optimized their behavior with respect to efficiency.
III.4 Temporal patterns

Finally, we studied the temporal patterns of visits at flowers during one night. The experimental findings as shown in the main plot of Fig. 9. Some bats remained active in the study area throughout the night whereas other bats only made shorter visits to the area. Overall, activity was markedly higher at the beginning of the night and again, with a smaller peak at the end of the night. This can be understood as follows: At the beginning of the night a large quantity of nectar has already accumulated from before the onset of harvesting activity, while towards the end, the bats can again, and with little effort, harvest non-depleted nectar that has accumulated during the night. Furthermore, another less important effect is that after an initial harvesting the stomachs of the bats are full and they need time to digest the nectar.
This can be compared with our numerical results of the optimized schedules, see inset of Fig. 9. The difference between active and less-active periods is more pronounced in the simulation data: in particular the first peak in the simulation is shifted towards the middle of the night. This is probably because for globally optimum harvesting the bats in the simulation need to be “aware of the future” such that they wait until even more nectar has accumulated and then harvest it from multiple different resource locations within short time intervals. By contrast, real bats at the end of daily rest are hungry and compete with each other. Hence, waiting for too long early at night increases the risk that other bats deplete the resources. Nevertheless, the qualitative similarity of the simulation results with the data obtained experimentally in the rain forest shows that our model makes qualitative predictions of spatial and temporal resource use that already reproduce the behavior of real bats.
Note that we also studied numerically the case, where the capacity of the flowers was set to infinity. Here, to attain the global optimum, it is worth waiting long until almost the end of the night, to reduce the total flight distance. And indeed (not shown here), the temporal distribution changes to one which grows monotonously and exhibits one large peak at the end of the night. This shows that the temporal flight pattern is a direct consequence of optimization performed by the bats and the limited capacity of the flowers, which the bats are apparently aware of.
IV Summary and Discussion
We have introduced a model to describe the exploitative behavior of flower visitors harvesting nectar. The model is a generalization of the NP-hard traveling-salesperson problem, hence no fast algorithm yet exists to solve it on a computer. Therefore a treatment of the problem using algorithms which calculate the exact optima is out of reach. We used genetic algorithms to find optimal or nearly optimal routes and schedules in numerical simulations such that a collection of bats can jointly exploit a habitat globally efficiently.
Note that it is not clear a prioi whether real bats in a habitat are able to harvest nectar so efficiently, primarily because an ideal-free distribution of individuals in the spatial and temporal dimension with a complete avoidance of overlap between all individuals of a bat population is very unlikely. Also, as we observed during our rain forest studies, a bat’s flight path during a night does not only connect harvesting events but detours to interact with other bats, search for new flowers or avoid danger. This makes a direct comparison of efficiency impossible. Nevertheless, as mentioned, collective individual optimization may lead to global optima, which is exploited by swarm intelligence algorithms like ant-colony optimization. Therefore, the study of global optima of the NHP is justified.
In fact, from the preliminary results of our experiments in the rain forest, we can conclude that the bats are indeed able to partially optimize. The experiments are based on the surveillance of bats using artificial flowers and measuring their level of activity during the night. The results indicate that the underlying model exhibits enough ingredients to sufficiently describe the basic behavior of the bats, in particular that the bats exhibit spatio-temporal memory: The bats seem to be able to optimize their exploitation, which is apparent in the increasing fraction of flights to “quickly refilling” flowers.
In an analysis of the flight lengths of the optimum schedule, we found a power-law (Lévy) distribution. Such distributions have often been observed in various ecological systems, like flies Cole (1995), Albatrosses Viswanathan et al. (1996), marine predators Humphries et al. (2010), or humans Raichlen et al. (2014). The quest for the origin of such behavior arose a great deal of attention and led to many studies trying to explain its origins F. (2007). In modelling harvesting or food search, power-law distributions have been used severals times, e.g., for determining the optimum exponent of such a distribution, when the ressource distribution might be unkown Viswanathan et al. (1999). There are other more recent models, where a power-law distribution of the step sizes is also assumed in some way or the other Reynolds and Bartumeus (2009); Gautestad and Mysterud (2013); Zhao et al. (2015); Kuśmierz and Toyoizumi (2017). In all these studies the power-law behavior does not emerge without assuming it, but they are explicit part of the models. Therefore, such models correspond to the assumption that evolution has led the animals to develop a (random) search strategy which encodes such Lévy walks, in particular with the aim to detect yet unknown food ressources.
It is not always true that Lévy flights lead to the optimal foraging behavior. Clearly, if the ressources are dense, ranom walk behavior is suffiecient to find them, while minimizing the step length. Also, under certain conditions other distribuions of the step sizes are optimal, e.g., a ballistic search James et al. (2008).
On the other hand, a power-law distribution of distances was also found for a foraging model Maya et al. (2017), where no assumption about the distribution of step sizes was made, but where the ressources were distributed in the plane with ressource qualitiy values drawn from a scale-free power-law distribution. One forgager with a local search strategy was simulated, such that always the closest ressource was taken with the smallest distance to quality ration. A power-law distribution for the distance was only found with a proper choice of the power for the quality distribution. Hence, the observed distance distribution seems to be here a result of the specific power-law choice of the ressource quality distribution, but not a true emergent property of the system.
Thus, we find in the present study a power-law distribution of travel distances without any correspoding assumption and with the ressources being distributed uniform randomly. In no part of the present model a power-law distribution is assumed, neither for step-sizes of animal movement nor for the quantities describing the food ressources. This means also that no assumptions about evolutionary processes favoring such power-law distributions have been made. Thus, emerging Lévy-walk distributions is possible without the assumption of directly influence of evolution, in contrast to some previous ideas F. (2007). On the other hand, there exist models of target-searching agents in randomly changing environments, where an evolution-caused power-law distribution was observed van Dartel et al. (2004); Wosniack et al. (2017).
Nevertheless, for our model, in principal, the animals have perfect knowledge of the food ressources, partially justified by the good spatio-temporal memory of the bats, we observed in experiments. Thus the observed Lévy distribution is not describing a random search strategy, but it emerges without specific assumptions just from optimizing the search efforts versus search gain. Interestingly, the time dependence, seems to be an important ingredient, because for the TSP we observe an exponential distribution of step sizes for the optimal tours.
Furthermore, beyond the statistical properties of the optimal schedules, when increasing the demand of the bats in our simulations, we found a phase transition from a region where the bats have enough nectar available to a region where not all bats can be fed sufficiently. This, as mentioned above, is due to a growing correlation length of the system. From a biological point of view this means that optimization becomes more demanding as more individuals are in exploitation competition. This is because individual optimization becomes increasingly dependent on how well an individual can avoid the effects of exploitative competition caused by the other individuals. This we could observe also when studying the running time of the genetic algorithm: The transition coincides with a marked increase in running time, indicating that the problem becomes typically hard to solve on a computer.
Note that we have observed the phase transition, coinciding with a substantial increase in running time, for an ensemble of realistic time-dependent combinatorial optimization problems, in contrast to previously studied models which are rather simple and static, like random K-Satisfiability or the coloring problem on random graphs. This indicates that also for realistic optimization problems phase transitions occur and it may be useful to investigate them, e.g., to determine optimum working conditions by analyzing ratios of outcome versus effort, which are often found to be best near phase transitions. In particular, as visible in the distribution of flight distances, the results indicate that the behavior of NHP, which involves multiple bats and time-dependence, is different from the strongly reduced TSP model. Nevertheless, the growth of the correlation, as measured by the critical exponent , appears to be similar.
Concerning future research directions, the occurrence of a phase transition in the optimum solution could serve as a guiding line for also further experimental studies: It is tempting to ask, whether such a phase transition can be observed experimentally in the natural rain forest environment. Within an experiment using artificial flowers, for example, the amount of nectar offered until the bats start to move out of the habitat could be continuously reduced. Note that with the present experimental data, where the feeders were controlled such that the bats acted independently of each other, it is unfortunately not a simple matter of reanalysis of the data. There, new experimental (and, unfortunately, involved and expensive) campaigns in the rain forest, guided by the present result and forcing the bats to compete, will be needed. If a similar phase transition is observed experimentally, the value where the phase transition occurs would indicate how well the bats are able to optimize, compared with the theoretical optimum studied here. In particular, if the experimental data for different “sizes”, i.e., number of bats and flowers, can be rescaled (as in the simulation results in Fig. 7) this would mean that there is a growing correlation between the bats. This would provide strong evidence that the bats communicate or interact in some way, directly or maybe indirectly through flower exploitation, leading to a jointly more efficient exploitation of the habitat. Also, the analysis of the schedules of competing bats, will show whether they partition the habitat among them, as seen in the optimal schedules, and whether such a partition evolves over time. In general, performing such experiments having a comparison with the optimum will result in a much greater understanding of the exploitation capabilities of highly-evolved vertebrates.
On the simulation side, one could perform extensive detailed agent-based simulations, with bats having local memory and (possibly different) local optimization strategies. This is motivated by other results from our experiments (not shown), where we grouped the bat’s activities into bouts and measured the frequency bats revisited flowers within a bout, as a function of the number of visits in a bout. We found that, the more visits are included in a bout, the more likely revisits occur, i.e. exhibits a sigmoid shape. This inidcate that bats exhibit a limited working memory helping them to harvest efficiently. We performed some preliminary agent based simulations with bats performing greedy search for the next flower to visit. The bats had a limited amount of working memory allowing them to avoid flowers they visited recently. We found that for bats remembering two or three past visits, the function resembled the measured data best. This result makes it tempting to perform agent based simulations more extensively. Given that we found a phase transition for the optimum as well as for the very simple greedy solutions, it appears likely that it exists for the agent-based case as well. It should be of high interest to know if and how the transition depends on the “cognitive complexity” of the agents. By carefully adjusting the experiments to the agent’s complexity, one might even try to determine how well-developed the “algorithms” for spatial and temporal cognition in natural bats are.
V Acknowledgments
MJ, AKH and YW were supported by the VolkswagenStiftung (Germany) within the program “Nachwuchsgruppen an Universitäten”. HS was supported by the German Science Foundation (DFG) through the grant HA 3169/8-1. YW is supported by the DFG Cluster of Excellence “Neurocure”. The simulations were partially performed at computing clusters at the “Gesellschaft für Wissenschaftliche Datenverarbeitung” and at the “Institute of Theoretical Physics” in Göttingen. The simulations were also partially performed at the HPC cluster CARL, located at the University of Oldenburg (Germany) and funded by the DFG through its Major Research Instrumentation Programme (INST 184/157-1 FUGG) and the Ministry of Science and Culture (MWK) of the Lower Saxony State.
References
- Stephens et al. (2007) D. W. Stephens, J. S. Brown, and R. C. Ydenberg, Foraging: Behavior and Ecology (University of Chicago Press, Chicago, 2007).
- Prins and van Langevelde (2008) H. H. T. Prins and F. van Langevelde, Resource Ecology: Spatial and Temporal Dynamics of Foraging (Springer, Heidelberg, 2008).
- Liu and Passino (2002) Y. Liu and K. Passino, J. Optim. Theory Appl. 115, 603 (2002).
- Viswanathan et al. (1996) G. M. Viswanathan, V. Afanasyev, S. V. Buldyrev, E. J. Murphy, P. A. Prince, and H. E. Stanley, Nature 381, 413 (1996).
- van Dartel et al. (2004) M. van Dartel, E. Postma, J. van den Herik, and G. de Croon, Connection Science 16, 169 (2004).
- Wosniack et al. (2017) M. E. Wosniack, M. C. Santos, E. P. Raposo, G. M. Viswanathan, and M. G. E. da Luz, PLOS Computational Biology 13, 1 (2017).
- Hartmann and Weigt (2005) A. K. Hartmann and M. Weigt, Phase Transitions in Combinatorial Optimization Problems (Wiley-VCH, Weinheim, 2005).
- Mitchell et al. (1992) D. G. Mitchell, B. Selman, and H. Levesque, in Proc. 10th Natl. Conf. Artif. Intell. (AAAI-92) (AAAI Press/MIT Press, Cambridge, 1992), pp. 440–446.
- Gent and Walsh (1996) I. P. Gent and T. Walsh, in Proceedings of 12th European Conference on Artificial Intelligence. ECAI ’96, edited by W. Wahlster (Wiley, Chichester, 1996), p. 170.
- Moore and Mertens (2011) C. Moore and S. Mertens, The Nature of Computation (Oxford University Press, Oxford, 2011).
- Papadimitriou and Steiglitz (2000) C. Papadimitriou and K. Steiglitz, Combinatorial Optimization – Algorithms and Complexity (Dover Publications Inc., Mineola, NY, 2000).
- Gutin (2002) G. Gutin, The Traveling Salesman Problem and Its Variations (Kluwer Academic Publishers, Dordrecht, 2002).
- Garey and Johnson (1979) M. R. Garey and D. S. Johnson, Computers and intractability (W.H. Freemann, San Francisco, 1979).
- Dorigo and Stützle (2004) M. Dorigo and T. Stützle, Ant Colony Optimization (MIT Press, Cambridge (USA), 2004).
- Pintea (2014) C.-M. Pintea, Advances in Bio-inspired Computing for Combinatorial Optimization Problem (Springer, Heidelberg, 2014).
- Winter and von Helversen (2001) Y. Winter and O. von Helversen, in Cognitive Ecology of Pollination (Cambridge University Press, Cambridge, 2001), pp. 148–170.
- Helversen and Winter (2003) O. Helversen and Y. Winter, in Bat ecology, edited by T. H. Kunz and B. M. Fenton (University of Chicago Press, Chicago, 2003), pp. 346–397.
- Cole (1995) B. J. Cole, Animal Behaviour 50, 1317 (1995), ISSN 0003-3472.
- Humphries et al. (2010) N. E. Humphries, N. Queiroz, J. R. M. Dyer, N. G. Pade, K. M. Musyl, Michael K. Schaefer, D. W. Fuller, J. M. Brunnschweiler, T. K. Doyle, J. D. R. Houghton, G. C. Hays, et al., Nature 465, 1066 (2010).
- Raichlen et al. (2014) D. A. Raichlen, B. M. Wood, A. D. Gordon, A. Z. P. Mabulla, F. W. Marlowe, and H. Pontzer, PNAS 111, 728 (2014).
- Viswanathan et al. (1999) G. M. Viswanathan, S. V. Buldyrev, S. Havlin, M. G. E. da Lu, E. P. Raposo, and H. E. Stanley, Nature 401, 911 (1999).
- Reynolds and Bartumeus (2009) A. M. Reynolds and F. Bartumeus, J. Theor. Biol. 260, 98 (2009), ISSN 0022-5193.
- Gautestad and Mysterud (2013) A. O. Gautestad and A. Mysterud, Movement Ecology 1, 9 (2013).
- Zhao et al. (2015) K. Zhao, R. Jurdak, J. Liu, D. Westcott, B. Kusy, H. Parry, P. Sommer, and A. McKeown, J. Royal Soc. Interf. 12 (2015), eprint 20141158.
- Kuśmierz and Toyoizumi (2017) Ł. Kuśmierz and T. Toyoizumi, ArXiv e-prints (2017), eprint 1710.01889.
- F. (2007) B. F., Fractals 15, 151 (2007).
- Winter (1999) Y. Winter, J. Experim. Biol. 202, 1917 (1999).
- Thiele and Winter (2005) J. Thiele and Y. Winter, Animal Behaviour 69, 315 (2005).
- Winter and Stich (2005) Y. Winter and K. P. Stich, J. Experim. Biol. 208, 539 (2005).
- Hartmann (2015) A. K. Hartmann, Big Practical Guide to Computer Simulations (World Scientific, Singapore, 2015).
- Goldberg (1989) D. E. Goldberg, Genetic Algorithms in Search, Optimization and Machine Learning (Addison-Wesley, Reading (MA), 1989).
- Goldberg and Deb (1991) D. E. Goldberg and K. Deb, in Foundations of Genetic Algorithms, edited by G. J. E. Rawlings (Addison-Wesley, Reading (MA), 1991), pp. 69–93.
- Blickle and Thiele (1995) T. Blickle and L. Thiele, TIK-Report, ETH Zürich (1995).
- Bektas (2003) T. Bektas, Omega 34, 209 (2003).
- Applegate et al. (2003) D. Applegate, R. Bixby, V. Chvátal, and W. Cook, Math. Program. 97, 91 (2003).
- Thiele (2006) J. Thiele, dissertation, Ludwig Maximilians University, Munich (2006).
- Stanley (1971) H. E. Stanley, An Introduction to Phase Transitions and Critical Phenomena (Oxford University Press, Oxford, 1971).
- Goldenfeld (1992) N. Goldenfeld, Lectures on phase transitions and the renormalization group (Addison-Wesely, Reading (MA), 1992).
- Reichl (1998) L. Reichl, A Modern Course in Statistical Physics (John Wiley & Sons, New York, 1998).
- James et al. (2008) A. James, M. J. Plank, and R. Brown, Phys. Rev. E 78, 051128 (2008).
- Maya et al. (2017) M. Maya, O. Miramontes, and D. Boyer, The European Physical Journal Special Topics 226, 391 (2017), ISSN 1951-6401, URL https://doi.org/10.1140/epjst/e2016-60195-6.