3D-printed phase waveplates for THz beam shaping
Abstract
The advancement of 3D-printing opens up a new way of constructing affordable custom terahertz (THz) components due to suitable printing resolution and THz transparency of polymer materials. We present a way of calculating, designing and fabricating a THz waveplate that phase-modulates an incident THz beam ( mm) in order to create a predefined intensity profile of the optical wavefront on a distant image plane. Our calculations were performed for two distinct target intensities with the use of a modified Gerchberg-Saxton algorithm. The resulting phase-modulating profiles were used to model the polyactide elements, which were printed out with a commercially available 3D-printer. The results were tested in an THz experimental setup equipped with a scanning option and they showed good agreement with theoretical predictions.
Terahertz spectroscopy is a powerful tool for imaging and testing applications Tonouchi (2007); Jansen et al. (2010). In analogy to the situation in optics, elements to manipulate the intensity and shape of a beam are of crucial importance. An efficient way to design such elements is to combine the holographic principles with computer-supported calculations of the beam propagation Xing et al. (2015); Leseberg (1992); Matsushima (2005). Such an approach allows not only to manipulate a beam, but moreover to generate pictures of real and imaginary objects on short time scales. Recently, optical meta-surfaces Walther et al. (2012); Sun et al. (2013); Yu and Capasso (2014); Genevet and Capasso (2015) added several interesting new ideas to the field, especially on the way to miniaturize the optical units.
Alternatively, optical elements for picture generation may be produced based on phase control of light only. Such elements are often called phase holograms and they manipulate the incident wave by coordinate-dependent phase changes Upatnieks and Leonard (1970); Gale et al. (1993); Lin et al. (2014); Zeng et al. (2017); Rotter and Gigan (2017). Well-known examples of phase holograms are dielectric Fresnel lenses or dielectric diffraction gratings. All such elements can be designed for frequencies as low as terahertz because the underlying Maxwell equations of light do not contain the wavelength as a parameter.
The goal of this article is to demonstrate that a very practical way to produce such phase holograms is to work with a commercially available 3D-printer. Additive manufacturing with 3D-printers has gained significant attention in the recent years due to its versatility, accessibility and generally because it presents a quick, easy-to-use and cost-efficient technique to produce complex and high-precision structures. The layer height resolution of 3D-printers ( mm) and a high transparency of the polymers used in 3D-printers Busch et al. (2014) are ideally suited for printing devices that manipulate electromagnetic radiation in the THz region. Recent examples of 3D printed THz elements are diffraction grating and lenses Squires et al. (2015). Here we make a significant further step in the field of THz imaging by designing and 3D-printing dielectric plates which are able to reproduce the picture of an arbitrary object.
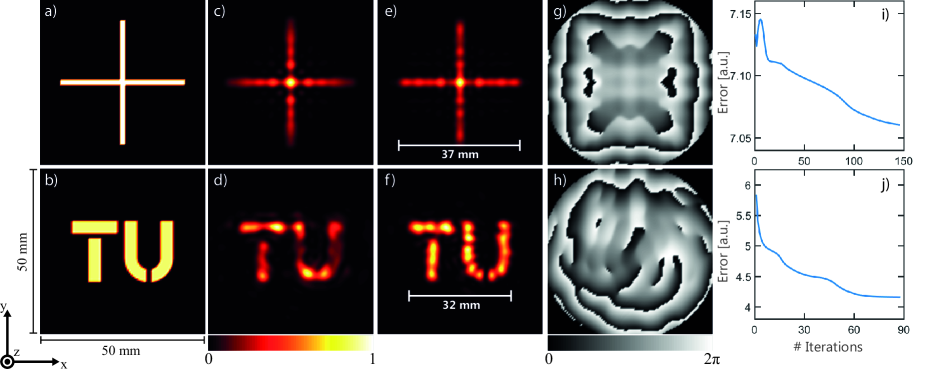
In our proof-of-principle demonstration we modulate of the phase profile of an incident asymmetric Gaussian beam ( mm) at mm with initially uniform zero phase profile (plane wave) in order to produce two distinct target intensity profiles (Fig.1(a,b)) at the image plane at mm, where the -axis represents the optical axis. These two target profiles in the shape of a cross and of our university logo were represented on a cartesian grid in a circular shape with a diameter of mm. Equally spaced grid points were used with a nearest-neighbor distance of mm. The incident beam was measured by scanning its intensity in the empty channel and was found to have a slightly asymmetric Gaussian profile with the widths of and mm along the and -axis of the optical system, respectively. These parameters were then used for calculating the profile of the phase plates explained below.
The required phase deformation of the incident beam was calculated using the Gerchberg-Saxton (GS) iterative algorithm Gerchberg and Saxton (1972). This algorithm determines the phase of the optical wave function in the imaging system, whose intensity in the diffraction (source) and the image plane of the system are known. The method typically assumes a Fourier Transform relation between the optical fields on both planes. Therefore, in order to move the image plane from far-field to a finite distance from the diffraction plane we considered a propagation function that linked the optical fields on both planes based on the Huygens principle. In this spirit the wavefront on the source plane, , was represented as point emitters of spherical wavelets with respective coordinates , amplitude and phase angle . The optical field on the distant plane, , was then calculated by summing up all contributions from every point emitter on for every point of the grid on the distant plane as:
| (1) |
where represents the vector between the two points on different planes, is the wave vector and is the angle between the normal of the source plane and the vector .
Equation (1) corresponds to the Fresnel-Kirchhoff diffraction formula Born et al. (1999). Due to the loss of the amplitude information of the optical field profiles during the GS algorithm, the pre-factors in Eq. (1) were left out. Note also that the part in square brackets represents the Fresnel inclination factor.
As the GS algorithm utilizes a subsequent back and forth propagation of the beam, the roles of the two image and diffraction planes at and and were interchanged in Eq. (1). We note that the reverse propagation requires the change of sign in the exponent in Eq. (1).
Figure 1(c,d) shows the calculated intensity profiles in the image plane for two targets after the first iteration step of the algorithm. Compared to the results after the final convergence of the algorithm (Fig. 1(e,f)) it can be seen that already the first iteration step produces reasonable intensity profiles. The calculated mean square deviations shown in Fig. 1(i,j) demonstrate that final convergence of the GS algorithm is reached after about iterations which takes about 4 hours of computer time on a commercial laptop. Analyzing the evolution of the errors with increasing iteration steps, we note that the relative improvement is rather small. This fact is due to the large amount of the zero intensity points in the target, which masks the advancement of the image.
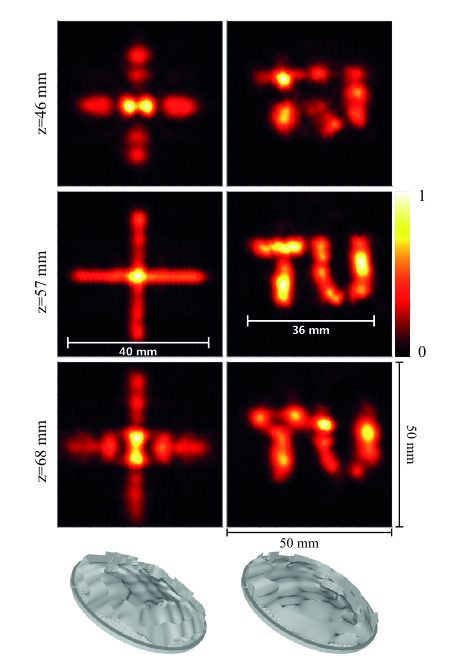
Based on the calculated phase profiles shown in Fig. 1(g,h) as gray scales, two optical elements, corresponding to the two targets, were modeled by using the formula to calculate the thickness of the optical elements at transverse positions in order to achieve the correct phase-shift profile. The refractive index of polyactide (PLA) - the plastic lament of the commercial additive 3D-printer - was measured in a separate experiment at the operating wavelength. This material was used to print the elements with a nozzle diameter of mm and spatial resolution of mm. The printed elements were positioned into the path of the THz beam at the -value of the optical system. The incident beam was produced by an IMPATT diode with 30 mW power. The transverse profile intensity of the phase-modulated optical field was then measured by using a pyroelectric detector on a translator in the -plane, where a sufficient signal-to-noise ratio was achieved by the implementation of a lock-in detection system. A sequence of intensity profiles was measured at various positions around the set image plane position . In Fig. 2 we present the measured intensity profiles at three different positions . We found that the sharpest images, which were the closest to the simulated profiles in Fig. 1(e,f), were located at mm, slightly deviating from the expected distance of mm. Simultaneously, the effective shape size of the images is also increased compared to respective target images shown in Fig. 1(e,f) by approximately %.
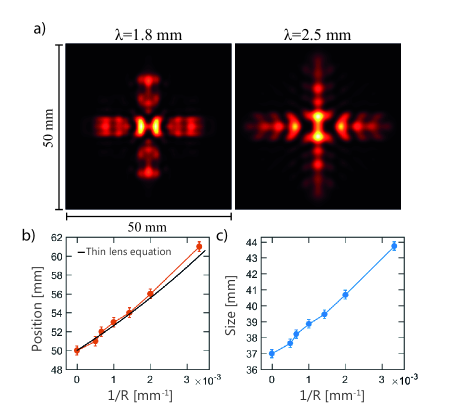
In order to find the reason for the variation of image size we investigated the influence of the phase distribution of the incident beam. Indeed, in the real experiment the phase profile of the beam deviates from an ideal plane wave and is better approximated with a spherical beam with a large but yet unknown curvature . Assuming a finite wavefront radius for the phase part of the optical field of the Gaussian incident beam causes a displacement of the image plane at which the shape of the intensity profile appears the sharpest. In addition, the size of the image increases proportionally to the change in the optimal distance (see Fig. 3(b,c)).
For each value of a set of intensity profiles at various positions with a step size of mm was simulated. From it we were able to select the position , at which the shape in the simulated intensity profile appeared focused, for each value of (see Fig. 3(b)). Figure 3 also shows that the dependence of image plane position on coincides with the simple thin lens equation with the focus of (depicted in black), in particular in the linear regime of the equation (). Effective sizes of the sharpest shapes in respect with , shown in Fig. 3(c), follow the same trend as their positions. This may be expected as a result of a linear dependence between the image plane position of the sharpest image and its position on the optical axis. For mm we see in Fig. 3(b) that the sharpest image appears at mm, relatively close to the position of the sharpest measured image in Fig. 2. In addition, the effective size of the sharpest image for mm is comparable to the measured one and thus shows that an uncollimated beam with a similar curvature explains well the mismatch of the theoretical prediction and the experimental results, despite our optimization of the optical system.
We also investigated the effect of varying the wavelength of the incoming beam keeping the phase plate fixed the one producing the cross-shaped intensity pattern (see Fig. 1(g)). Simulated intensity profiles at the image plane for two wavelengths around the value are shown in Fig. 3(a). After comparing these results to Fig. 1(e) we conclude that a noticeable change of wavelength still produces intensity profiles that preserve the basic shape of the target yet it also shows that a specific spectral width of the radiation would influence the sharpness of the image.
We also mention parenthetically that we improved the propagation function in Eq. (1) by better taking into account the finite thickness of the phase plate. Instead of an instant change of the propagation phase (as for a waveplate with zero thickness), a finite height has been added to each emitter of the source plane with a value corresponding to the actual thickness at a point (x,y). This improvement slightly corrected the simulated intensity profiles when compared to real results, yet the changes are barely seen directly and are therefore not shown here.
In conclusion, we demonstrate that versatile wave plates for THz beam shaping can be very easily produced with a commercially available 3D printer. Specifically, we showed how such dielectric phase plates can modulate an incoming Gaussian beam such that it produces an arbitrary image on the detector plane. Our results are expected to facilitate THz imaging on all levels where customized and cost-efficient beam shaping solutions are required.
The financial support by the Austrian Federal Ministry of Science, Research and Economy, by the National Foundation for Research, Technology and Development and by the Austrian Science Funds (W1243) is acknowledged.
References
- Tonouchi (2007) M. Tonouchi, Nat. Photonics 1, 97 (2007).
- Jansen et al. (2010) C. Jansen, S. Wietzke, O. Peters, M. Scheller, N. Vieweg, M. Salhi, N. Krumbholz, C. Jördens, T. Hochrein, and M. Koch, Appl. Opt. 49, E48 (2010).
- Xing et al. (2015) Y. Xing, M. Kaaniche, B. Pesquet-Popescu, and F. Dufaux, Digital Holographic Data Representation and Compression (Elsevier Science, 2015).
- Leseberg (1992) D. Leseberg, Appl. Opt. 31, 223 (1992).
- Matsushima (2005) K. Matsushima, Appl. Opt. 44, 4607 (2005).
- Walther et al. (2012) B. Walther, C. Helgert, C. Rockstuhl, F. Setzpfandt, F. Eilenberger, E.-B. Kley, F. Lederer, A. Tünnermann, and T. Pertsch, Adv. Mater. 24, 6300 (2012).
- Sun et al. (2013) J. Sun, E. Timurdogan, A. Yaacobi, E. S. Hosseini, and M. R. Watts, Nature 493, 195 (2013).
- Yu and Capasso (2014) N. Yu and F. Capasso, Nat. Mater. 13, 139 (2014).
- Genevet and Capasso (2015) P. Genevet and F. Capasso, Rep. Prog. Phys. 78 (2015), 10.1088/0034-4885/78/2/024401.
- Upatnieks and Leonard (1970) J. Upatnieks and C. Leonard, J. Opt. Soc. Am. 60, 297 (1970).
- Gale et al. (1993) M. T. Gale, M. Rossi, H. Schütz, P. Ehbets, H. P. Herzig, and D. Prongué, Appl. Opt. 32, 2526 (1993).
- Lin et al. (2014) D. Lin, P. Fan, E. Hasman, and M. L. Brongersma, Science 345, 298 (2014).
- Zeng et al. (2017) Z. Zeng, H. Zheng, Y. Yu, and A. K. Asundi, Opt. Lasers Eng. 93, 47 (2017).
- Rotter and Gigan (2017) S. Rotter and S. Gigan, Rev. Mod. Phys. 89, 015005 (2017).
- Busch et al. (2014) S. F. Busch, M. Weidenbach, M. Fey, F. Schäfer, T. Probst, and M. Koch, J. Infr. Millim. Waves 35, 993 (2014).
- Squires et al. (2015) A. D. Squires, E. Constable, and R. A. Lewis, J. Infrared Millim. Terahertz Waves 36, 72 (2015).
- Gerchberg and Saxton (1972) R. W. Gerchberg and W. O. Saxton, Optik 35, 237 (1972).
- Born et al. (1999) M. Born, E. Wolf, A. B. Bhatia, P. C. Clemmow, D. Gabor, A. R. Stokes, A. M. Taylor, P. A. Wayman, and W. L. Wilcock, Principles of Optics: Electromagnetic Theory of Propagation, Interference and Diffraction of Light, 7th ed. (Cambridge University Press, 1999).
- Nuss and Orenstein (1998) M. Nuss and J. Orenstein, in Millimeter And Submillimeter Wave Spectroscopy Of Solids, Topics in Applied Physics, Vol. 74, edited by G. Gruner (Springer, 1998) pp. 7–50.
- Slinger et al. (2005) C. Slinger, C. Cameron, and M. Stanley, Computer 38, 46 (2005).