eurm10 \checkfontmsam10
On the role of secondary motions in turbulent square duct flow
Abstract
We use a direct numerical simulations (DNS) database for turbulent flow in a square duct up to bulk Reynolds number , to quantitatively analyze the role of secondary motions on the mean flow structure. For that purpose we derive a generalized form of the identity of Fukagata, Iwamoto and Kasagi (FIK), which allows to quantify the effect of cross-stream convection on the mean streamwise velocity, wall shear stress and bulk friction coefficient. Secondary motions are found to contribute for about of total friction, and to act as a self-regulating mechanism of turbulence whereby wall shear stress nonuniformities induced by corners are equalized, and universality of the wall-normal velocity profiles is established. We also carry out numerical experiments whereby the secondary motions are artificially suppressed, in which case their equalizing role is partially taken by the turbulent stresses.
1 Introduction
Flows within ducts with square cross section are the simplest prototype of internal flows with two-dimensional mean flow statistics, and they are common in many engineering applications, such as heat exchangers, turbomachinery, nuclear reactors and water draining and ventilation systems. These flows are characterized by the appearance of secondary motions, first advocated by Prandtl (1926) and Nikuradse (1930) to explain bulging of the streamwise velocity isolines towards the duct corners. Secondary motions in square duct flow consist of an array of eight counter-rotating vortices, bringing high-momentum fluid from the core towards the corners. Early quantitative measurements (Brundrett & Baines, 1964; Gessner & Jones, 1965) showed that the intensity of the secondary eddies is about 1-2% of the bulk velocity, as also confirmed in much later numerical studies (Gavrilakis, 1992; Pinelli et al., 2010; Vinuesa et al., 2014). Although their origin is not fully understood, theoretical analysis made it clear that they are associated with gradients of the secondary turbulent stresses, absent in canonical pipe flow (Speziale, 1982). A simple model for the structure of the secondary eddies has been recently proposed by the present authors (Pirozzoli et al., 2018), supported by DNS data at computationally high Reynolds number.
In most studies it is stated that, despite their weakness, secondary motions significantly affect the structure of the mean velocity field, and hence have important influence on the distribution of wall friction and on particle dispersion. However, to the best of our knowledge, this effect has never been quantified, mainly because of difficulties in isolating the effect of mean cross-stream convection from turbulence. This is the goal of the present paper, in which we attempt to quantify the role of secondary motions in the redistribution of momentum based on DNS data. For that purpose we derive a generalized form of the FIK identity (Fukagata et al., 2002) which allows to separate the effect of mean convection on both local and mean friction. We also carry out numerical experiments whereby the mean cross-stream flow is artificially suppressed to further clarify its effect on the mean flow statistics.
2 Methodology
| Case | |||||||||||
|---|---|---|---|---|---|---|---|---|---|---|---|
| A | 0 | ||||||||||
| B | 0 | ||||||||||
| C | 0 | ||||||||||
| D | 0 | ||||||||||
| A0 | 5.4 | ||||||||||
| B0 | 2.7 | ||||||||||
| C0 | -3.1 | ||||||||||
| D0 | -3.2 |
This study mainly relies on the DNS database developed by Pirozzoli et al. (2018). The compressible Navier-Stokes equations are solved using a fourth-order co-located finite difference solver (Modesti & Pirozzoli, 2018), and integrated over very long time intervals to guarantee statistical convergence. Four simulations have been carried out at low bulk Mach number, , in the range of bulk Reynolds number (, where is the duct half side length, the bulk velocity and the fluid kinematic viscosity), and labeled as A-D in table 1. A thorough validation was carried out by Pirozzoli et al. (2018), showing good agreement between the new dataset and previous DNS studies (Pinelli et al., 2010; Vinuesa et al., 2014). For the sake of clarity, the velocity components in the streamwise and wall-normal directions are denoted as , and , respectively, and the overline symbol is used to indicate statistical averages in the streamwise direction and in time. In the following both local wall units (based on the local friction velocity, , with the local wall shear stress) and global wall units (based on the mean shear stress) are used and are denoted with and , respectively.
Additional numerical experiments have been carried out here at the same bulk Reynolds numbers as the baseline cases (and denoted with the 0 suffix in table 1), by artificially suppressing the secondary motions. For that purpose we force the streamwise-averaged cross-stream velocity components to have zero mean by setting
| (1a) | ||||
| (1b) | ||||
at each Runge-Kutta sub-step, where denotes the streamwise averaging operator. Note that this procedure is independent from the streamwise length of the computational domain or the Reynolds number, as by definition the modified velocities have zero mean, hence the secondary motions are suppressed to machine accuracy. Although the modified velocity field does not strictly satisfy the Navier-Stokes equations, the resulting statistics may be instructive to understand the role of the secondary motions. Previous studies (Pinelli et al., 2010; Vinuesa et al., 2014) highlighted the need for very long averaging time, thus we have collected flow statistics for equivalent times , which are considerably longer than in classical plane channel flow. On the other hand, we have found that numerical experiments carried out without secondary motions require much shorter time averaging interval as a results of the suppression of the slow dynamics associated with the secondary currents.
3 The role of secondary motions
In order to quantify the effect of secondary motions on momentum redistribution, we derive a generalized version of the FIK identity (Fukagata et al., 2002) for ducts with arbitrary shape. For that purpose we consider the mean streamwise momentum balance equation, namely
| (2) |
where is the mean streamwise velocity, is associated with mean cross-stream convection (hence, with the secondary motions), is associated with turbulence convection, is the cross-stream velocity vector, is the driving pressure gradient, and and are the duct cross-sectional area and perimeter, respectively. Equation (2) may be interpreted as a Poisson equation for the mean streamwise velocity, with source terms , and obtained from the DNS dataset. Hence, the solution of equation (2) may be cast as the superposition of three parts, namely , with
| (3) |
with homogeneous boundary conditions, where , , and denote the viscous, turbulent, and convective contributions to the mean streamwise velocity field. The bulk velocity in the duct may accordingly be evaluated as
| (4) |
where we have introduced the unitary velocity field defined as solution of , which by construction is only a function of the duct geometry, and whereby the viscous velocity field may be expressed as . Inserting the friction coefficient (where is the duct hydraulic diameter) into equation (4) one obtains
| (5) |
where is the bulk Reynolds number based on the duct perimeter. Equation (5) clearly shows that the friction coefficient may be regarded as the sum of the contributions of viscosity, turbulence, and convection (labeled as ). We note that this formalism has additional generality than the classical FIK identity and its extensions (Peet & Sagaut, 2009; Jelly et al., 2014), and it further allows to isolate the effects of mean convection, turbulent and viscous terms to the wall shear stress distributions along the duct perimeter, resulting from
| (6) |
where is the wall-normal direction. Regarding equation (6) it is important to note that only has non-zero mean, whereas integration of equation (3) for and readily shows that their integrated contributions vanish as , are both zero at walls.
| Case | ||||||
|---|---|---|---|---|---|---|
| A | ||||||
| B | ||||||
| C | ||||||
| D | ||||||
| A0 | ||||||
| B0 | ||||||
| C0 | ||||||
| D0 |
The contributions to the mean friction coefficients are given in table 2, both in absolute terms and as a fraction of the total. Consistent with physical expectations, the viscous contribution is observed to decline at increasing Reynolds number with respect to the turbulent term. The contribution of cross-stream convection is found to be roughly constant across the explored Reynolds number range, however remaining much less than the turbulence contribution. Extrapolating the DNS data, we expect the convective contribution to exceed the viscous one at high enough Reynolds number.
(a)
 (b)
(b)
 (c)
(c)
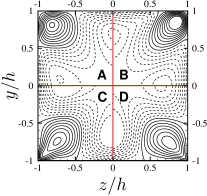
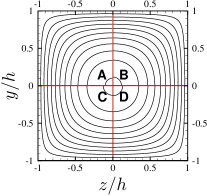
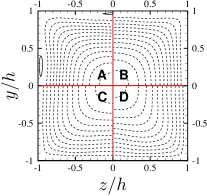
Figure 1 shows the streamwise velocity fields associated with viscous, turbulent and convective terms. For the sake of clarity, each contribution is normalized with the corresponding bulk value, , where and are both negative, hence providing an additive effect to the duct friction (see equation (5)). The viscous-associated velocity field arises from the solution of a Poisson equation with uniform right-hand-side (the pressure gradient), hence its shape is identical to the case of laminar flow (Shah & London, 2014), only depending on the duct cross-sectional geometry. The turbulence-associated velocity field , shown in figure 1(b), is everywhere negative and topologically similar to the viscous-associated field, highlighting a retarding effect of turbulence on the bulk flow, with incurred increase of the friction coefficient. The velocity field induced by mean convection, shown in figure 1(c), has a more complex organization. Positive values are found near the duct corners, whereas negative values are found near the duct bisectors, the zero crossings being located half-way in between. This finding is consistent with the intuitive expectation that secondary motions tend to equalize momentum across the duct cross-section, thus quantitatively corroborating claims made by early investigators (Prandtl, 1926). Notably, all the distributions shown in figure 1 are not qualitatively affected by Reynolds number variation when scaled with respect to their mean integral value, thus showing that changing the Reynolds number only changes the relative importance of the three terms, as quantified in table 2.
A
 B
B
C
 D
D
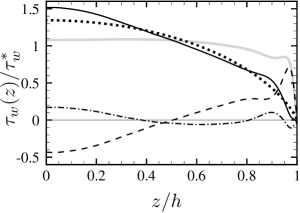
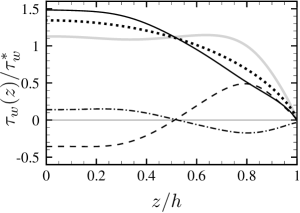
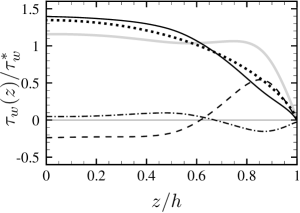
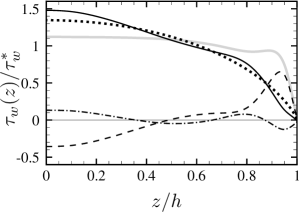
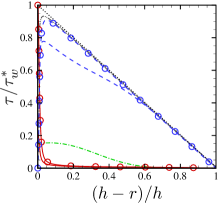
The observations made regarding the organization of the streamwise velocity field have direct impact on the distribution of the local wall shear stress, shown in figure 2. The wall shear stress distribution induced by viscous terms (dots) is the same for all cases, and nearly parabolic in shape. The turbulence terms (dash-dotted lines) have a complex behavior, exhibiting multiple peaks which change with the Reynolds number. In general, they yield friction increase toward the duct bisectors, and slight attenuation at the corners (compare the solid with the dotted lines), thus making the wall friction distributions more nonuniform. Mean convection (dashed lines) yields large positive peaks in the corner vicinity, whose distance from the neighboring walls scales in inner units (Pirozzoli et al., 2018), and negative values around the duct bisector. As a result, the distributions of the wall shear stress (thick gray lines) tend to be rather flat, especially at high enough Reynolds number. This behavior is consistent with recent theoretical analysis based on inner-outer layer matching arguments (Spalart et al., 2018), which suggest that only uniform wall shear stress along the duct perimeter is compatible with the formation of logarithmic layers of the mean streamwise velocity in the asymptotic high-Re regime.
A
 D
D
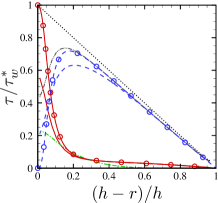
The role of the secondary motions is further analyzed using the mean momentum balance equation (2), averaged over circular shells. Let , be polar coordinates about the duct center, it is a simple matter to show that integrating (2) along the radial direction yields the counterpart of the law of linear variation of the total stress with the wall distance in canonical flows, namely
| (7) |
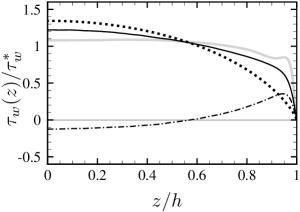
where is the radial distance from the duct center, the local stresses are defined in equation (2), and denotes the averaging operator in the azimuthal direction. Equation (7) holds for , the upper limit corresponding to the condition of tangency of circular shells with the duct walls. The terms represent the viscous, turbulent, and convective stresses averaged in the azimuthal direction, and according to equation (7) their sum is supposed to vary linearly with the radial coordinate. Figure 3 shows the distributions of the averaged stresses as a function of nearest wall distance, . Mean momentum balance is satisfied with very good accuracy, as the distributions of the total stress (dotted lines) is very nearly linear. Interestingly, the distributions of the total stress components are very similar to those observed in pipe flow, also shown for reference. Specifically, the viscous stress (solid lines) increases towards the wall, however its value is much less than , because averaging in the direction also collects points far from walls where the viscous stress is very small. The turbulent stress (dashed lines) has an opposite behavior, being dominant away from walls, and non-zero for , again on account of the averaging. The convective stress (dash-dotted lines) is far from negligible, especially near walls, and its relative importance increases with the Reynolds number. Comparing with flow statistics from pipe DNS (Wu & Moin, 2008), we find that when convective and turbulent stresses are taken together (dash-dot-dotted line), good collapse of the stresses is achieved starting from a wall distance of about . Bearing in mind that nonuniformities in the direction have been removed through the averaging procedure, this observation probably points to a universal structure of all duct flows, which corroborates the validity of Townsend’s outer layer similarity hypothesis (Townsend, 1976) also in non-canonical flows.
4 Suppression of secondary motions
(a)
 (b)
(b)
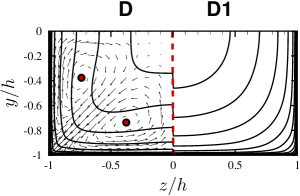
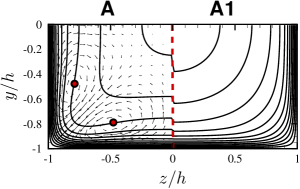
Numerical experiments with artificial suppression of the secondary motions (flow cases A0-D0), are here compared with full DNS (flow cases A-D). In figure 4 we show mean streamwise velocity contours in cross-stream planes. Upon suppression of the secondary motions, the flow does no longer exhibit the typical bulging of the velocity isolines, because momentum transfer from the duct core towards the corners is inhibited. In practical terms, this qualitative change is not accompanied by substantial variation of drag, and indeed table 1 shows modest drag increase for flow cases A0-B0, and modest drag decrease for flow cases C0-D0. We argue that this non-monotonic behavior is due to the displacement of the centroids of the secondary eddies in the low-Reynolds-number post-transitional regime (see Pirozzoli et al. (2018, figure 18)).
The analysis of the contributions to the total friction carried out in Section 3 has been repeated for the flow cases without secondary motions, and the results are reported in table 2 for flow cases A0-D0. It appears that the viscous contribution is very nearly the same as in the baseline cases, and the absence of convection is almost entirely compensated by increase of the turbulent contribution, in such a way that the overall variation of friction is quite small.
A0
 B0
B0

C0
 D0
D0
The distributions of the wall shear stress for flow cases A0-D0 are shown in figure 5. Overall, the wall shear stress (solid lines) is less flat than in flow cases A-D (gray lines), and it does no longer exhibit the typical near-wall peaks caused by mean convection. Comparing with figure 2 shows that the viscous contribution obviously retains the same shape, whereas the turbulence contribution is qualitatively modified by suppression of the secondary motions. In particular, (dash-dotted lines) has reversed sign, becoming positive towards the corners and negative at the duct mid-side. This observation is consistent with the fact that the associated velocity field (not shown) has a structure similar to the convection term in figure 1(c), thus bringing high-momentum fluid towards the corners.
D
 D0
D0
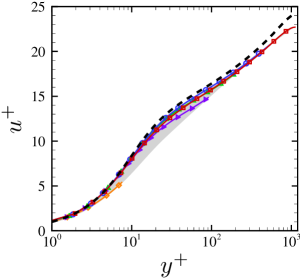
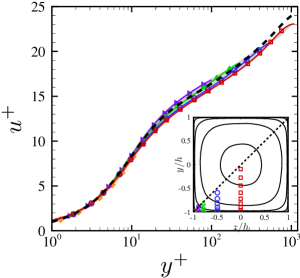
The inner-scaled wall-normal mean velocity profiles are shown in figure 6 for the highest Reynolds number cases. For the sake of clarity, the profiles are scaled in local wall units at each location along the bottom wall, and shown up to the corner bisector (see inset in the left panel), where velocity has local maxima. The mean velocity profiles for circular pipe flow (Wu & Moin, 2008) are also included for comparison. As pointed out by Pirozzoli et al. (2018), local wall scaling yields excellent collapse of the velocity distributions up to the corner bisector, thus supporting the robustness of the law-of-the-wall in wall-bounded turbulence. However, removing the secondary motions (right panel) yields greater data scatter in the buffer layer, and deviations from the pipe velocity profile are consequently larger also in the outer layer. In this respect we again recall that the analysis of Spalart et al. (2018) shows that a log law can only be achieved in ducts with complex cross section if the wall shear is uniform. Hence, the observed greater universality of the inner-scaled velocity profiles in the presence of secondary motions is likely to be the side result of greater uniformity in the wall shear stress distributions. In this sense, we may further state that secondary motions contribute to establishing universality of the flow statistics.
5 Conclusions
Based on the results of this study, we are in a position to judge about the actual effect of secondary motions on the flow statistics, thus providing quantitative answers to a frequently debated subject. As regards the bulk flow properties, we find that secondary motions contribute by as much as to the mean duct friction coefficient, hence their suppression may in principle yield some relief in terms of reduced pressure drop. This expectation is not realized in practice, and we find that artificially suppressing the secondary motions changes the structure of the turbulence terms in a partially compensating fashion. Hence, drag increase is found at low Reynolds number, and drag reduction of no more than , at sufficiently high Reynolds number. Notably, this drag reduction is comparable to that obtained with a change of duct shape from square to circular. Indeed, assuming that friction is controlled by the Reynolds number based on the hydraulic diameter, and considering for simplicity Blasius friction law, namely , it is easily found that the ratio of the friction coefficient in a square duct as compared with a circular pipe with the same area is .
As regards the general flow organization, we are able to quantitatively confirm that the main role of the secondary motions is to bring high-momentum fluid from the side bisectors towards the corners, hence tending to compensate the momentum defect at the duct corners and to make for a fuller mean velocity profile, thus counteracting nonuniformities induced by the viscous and turbulence terms. As a result, the distributions of the wall shear stress also tends to be more uniform than would be obtained if only the viscous and turbulence terms are retained. Artificial suppression of the secondary motions changes the qualitative structure of the turbulence terms, which then assume a uniforming role similar to mean convection. However, the wall shear stress distributions are less flat than in the case of the full DNS. As a result, DNS including the secondary motions tend to have greater universality of the wall-normal mean velocity profiles, which follow with good fidelity the canonical log law.
A further outcome of the present analysis is that the azimuthally-averaged mean momentum budget terms reveals a structure similar to that found in circular pipe flow, thus supporting extended validity of Townsend’s similarity hypothesis also for flows in ducts with complex shape. In the presence of secondary motions, mean convection provides a contribution comparable to the turbulent stresses, especially near the walls, which however adds to the turbulent contribution yielding an effective averaged stress distribution which is very similar to pipe flow.
Acknowledgements.
We acknowledge support from J. Jimenez for hosting us during the Third Madrid Turbulence Workshop, funded by the COTURB ERC project. We further acknowledge that the data reported in this paper have been computed using the PRACE Research Infrastructure resource MARCONI based at CINECA, Casalecchio di Reno, Italy.References
- Brundrett & Baines (1964) Brundrett, E. & Baines, W.D. 1964 The production and diffusion of vorticity in duct flow. J. Fluid Mech. 19, 375–394.
- Fukagata et al. (2002) Fukagata, K., Iwamoto, K. & Kasagi, N. 2002 Contribution of Reynolds stress distribution to the skin friction in wall-bounded flows. Phys. Fluids 14, L73–L76.
- Gavrilakis (1992) Gavrilakis, S. 1992 Numerical simulation of low-Reynolds-number turbulent flow through a straight square duct. J. Fluid Mech. 244, 101–129.
- Gessner & Jones (1965) Gessner, F.B. & Jones, J.B. 1965 On some aspects of fully-developed turbulent flow in rectangular channels. J. Fluid Mech. 23, 689–713.
- Jelly et al. (2014) Jelly, T.O., Jung, S.Y. & Zaki, T.A. 2014 Turbulence and skin friction modification in channel flow with streamwise-aligned superhydrophobic surface texture. Phys. Fluids 26, 095102.
- Modesti & Pirozzoli (2018) Modesti, D. & Pirozzoli, S. 2018 An efficient semi-implicit solver for direct numerical simulation of compressible flows at all speeds. J. Sci. Comput. 75, 308–331.
- Nikuradse (1930) Nikuradse, J. 1930 Untersuchungen über turbulente Strömung in nicht kreisförmigen Rohren. Ing. Arch. 1, 306–332.
- Peet & Sagaut (2009) Peet, Y. & Sagaut, P. 2009 Theoretical prediction of turbulent skin friction on geometrically complex surfaces. Phys. Fluids 21, 105105.
- Pinelli et al. (2010) Pinelli, A., Uhlmann, M., Sekimoto, A. & Kawahara, G. 2010 Reynolds number dependence of mean flow structure in square duct turbulence. J. Fluid Mech. 644, 107–122.
- Pirozzoli et al. (2018) Pirozzoli, S., Modesti, D., Orlandi, P. & Grasso, F. 2018 Turbulence and secondary motions in square duct flow. J. Fluid Mech. 840, 631–655.
- Prandtl (1926) Prandtl, L. 1926 Über die ausgebildete Turbulenz. In Int. Congress for Applied Mechanics. Also ”Turbulent Flow”, NACA-TM 435, 1927.
- Shah & London (2014) Shah, R.k. & London, A.L. 2014 Laminar flow forced convection in ducts: a source book for compact heat exchanger analytical data. Academic Press.
- Spalart et al. (2018) Spalart, P.R., Garbaruk, A. & Stabnikov, A. 2018 On the skin friction due to turbulence in ducts of various shapes. J. Fluid Mech. 838, 369–378.
- Speziale (1982) Speziale, C.G. 1982 On turbulent secondary flows in pipes of noncircular cross-section. Int. J. Eng. Sci. 20, 863–872.
- Townsend (1976) Townsend, A.A. 1976 The structure of turbulent shear flow. Cambridge University Press.
- Vinuesa et al. (2014) Vinuesa, R., Noorani, A., Lozano-Durán, A., El Khoury, G.K., Schlatter, P., Fischer, P.F. & Nagib, H.M. 2014 Aspect ratio effects in turbulent duct flows studied through direct numerical simulation. J. Turbulence 15, 677–706.
- Wu & Moin (2008) Wu, X. & Moin, P. 2008 A direct numerical simulation study on the mean velocity characteristics in turbulent pipe flow. J. Fluid Mech. 608, 81–112.