Optically addressing single rare-earth ions in a nanophotonic cavity
Abstract
We demonstrate optical probing of spectrally resolved single Nd3+ rare-earth ions in yttrium orthovanadate (YVO4). The ions are coupled to a photonic crystal resonator and show strong enhancement of the optical emission rate via the Purcell effect resulting in near-radiatively-limited single photon emission. The measured high coupling cooperativity between a single photon and the ion allows for the observation of coherent optical Rabi oscillations. This could enable optically controlled spin qubits, quantum logic gates, and spin-photon interfaces for future quantum networks.
pacs:
42.50.-p;42.50.Pq;37.10.Jk;42.50.MdRare-earth dopants in solids exhibit long-lived coherence in both the optical and spin degrees of freedom Thiel ; Sun . The effective shielding of 4f electrons leads to optical and radio-frequency transitions with less sensitivity to noise in their crystalline surroundings at cryogenic temperatures. Significant progress in rare-earth based quantum technologies has led to ensemble-based optical quantum memories Tittel ; Riedmatten ; Hedges ; Zhongsci and coherent transducers Williamson , with promising performance as quantum light-matter interfaces for quantum networks. On the other hand, addressing single ions has remained an outstanding challenge, with the progress hindered by the long optical lifetimes of rare-earth ions and resultant faint photoluminescence (PL). So far, only a few experiments have succeeded in isolating individual praseodymium KolesovNC ; Utikal ; Nakamura , cerium Kolesov ; Siyushev ; Xia , and erbium Yin ; Dibos ions, though the majority of them did not probe ions via their 4f-4f optical transitions. Recently, several works have demonstrated significant enhancement of spontaneous emissions of rare-earth emitters coupled to a nanophotonic cavity Zhong ; Zhongcavprot ; Zhongsci ; Dibos , among which Zhong ; Zhongsci also showed negligible detrimental effect on the coherence properties of ions in nanodevices. These results point at a viable approach to efficiently detect and coherently control individual ions in a chip-scale architecture.
Here we demonstrate a nanophotonic platform based on a yttrium orthovanadate (YVO4) photonic crystal nanobeam resonator coupled to spectrally resolved individual neodymium (Nd3+) ions. While the system acts as an ensemble quantum memory when operating at the center of the inhomogeneous line Zhongsci , it also enables direct optical addressing of single Nd3+ in the tails of the inhomogeneous distribution, which show strongly enhanced, near-radiatively-limited single photon emissions. A measured vacuum Rabi frequency of 228.5 MHz significantly exceeds the linewidth of a Nd3+ ion, allowing for coherent manipulation of spins with optical pulses. Unlike prior experiments KolesovNC ; Utikal ; Nakamura ; Kolesov ; Siyushev ; Xia , this technique does not hinge on the spectroscopic details of a specific type of ion and can be readily extended to other rare-earths or defect centers. The technique opens up new opportunities for spectroscopy on single ions that are distinct from conventional ensemble measurements, which enables probes for the local nanoscopic environment around individual ions and may lead to new quantum information processing, interconnect and sensing devices.
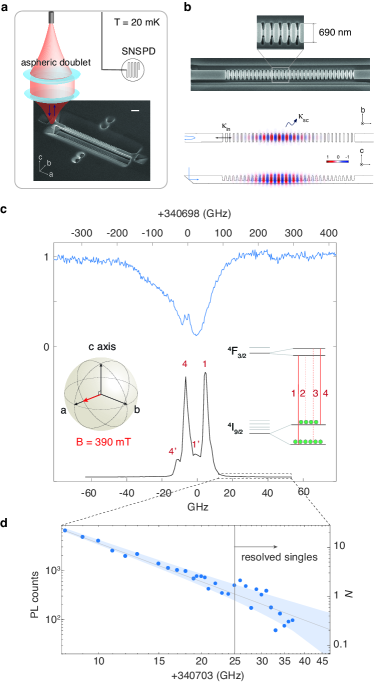
Our experiment builds upon a triangular nanobeam photonic crystal resonator Zhong ; Zhongfab that was fabricated in a nominally 50 parts per million (ppm) doped Nd3+:YVO4 crystal using focused ion beam (FIB) milling Zhongfab . The device is a one-sided cavity, as the input (left mirror in Fig.1(a,b)) has a lower reflectivity. The optical coupling in/out of the device was implemented via a 45∘-angled coupler Zhong . An aspheric doublet mode matches the single mode fiber to the nanobeam waveguide (Fig.1(a)). The coupling efficiency was optimized to 19% (from fiber to waveguide) using a 3-axis nano-positioner. The nanocavity fundamental mode volume is = 0.056 m3 (simulated) with a measured quality factor = 3,900 (energy decay rate 90 GHz). The waveguide-cavity coupling through the input mirror was 45% of . The device was cooled to 20 mK base temperature in a dilution refrigerator, though the actual ensemble temperature was estimated to be around 500 mK (by comparing the ground Zeeman level populations from the PL spectra). The elevated temperature was attributed to the very small thermal conductance in the nanobeam. This limitation has already manifested in previous sub-Kelvin bulk sample measurements Kukharchyk , and was even more demanding for measuring nanodevices in the current case. The laser for probing the ions was modulated by two double-pass acousto-optic (AOM) modulators, and delivered to the sample via a single-mode fiber. The reflected signal from the device was sent via a circulator to a superconducting nanowire single photon detector (SNSPD) that measured a 82% detection efficiency at 880 nm and 2 Hz dark counts Zhongsci . The SNSPD was mounted in the same fridge at the 100 mK stage. The overall photon detection efficiency including transmission from the cavity to the detector and the detector efficiency was 3.6% (Supplemental material SM ).
A typical cavity reflection spectrum when tuned nearly on resonance with the Nd3+ transition at 880 nm is shown in Fig.1(c). A 390 mT magnetic field was applied along the crystallographic a-axis of YVO4, giving rise to split Zeeman levels and four possible optical transitions Hastings (labelled 1-4) shown in the inset. Symmetry considerations impose that the 2, 3 cross transitions are forbidden, and the 1, 4 transitions are close to cyclic AfzeliusYVO ; Zhongsci . The PL spectrum (with a 200-ns pulsed resonant excitation) is shown in the lower part of Fig.1(c). Two weak lines labelled 1’ and 4’ were identified as emissions from Nd3+ ions in the bulk substrate, which are red-detuned from ions coupled to the cavity by 2.5 GHz. This shift is due to a static strain in the nanobeam, which makes it easier to spectrally separate the ions in the cavity from the bulk. For subsequent experiments, we focus on the shorter wavelength tail of the inhomogeneous distribution. Figure 1(d) plots the resonant PL against detuning from the peak of line 1 (340703.0 GHz). The PL and thus the atomic spectral density ( ions per excitation pulse bandwidth) fits with a power law of , where is the detuning. The 2.9 power exponent indicates an inhomogeneous broadening mechanism due to strain by dislocation according to the asymptotic form in Stoneham . Statistical fine structures (SFS) Moerner were also evident. By fitting the SFS with the projected shot noise of ( indicated as the shaded area), it is projected that discrete single ion spectra () emerge at a detuning 25 GHz.
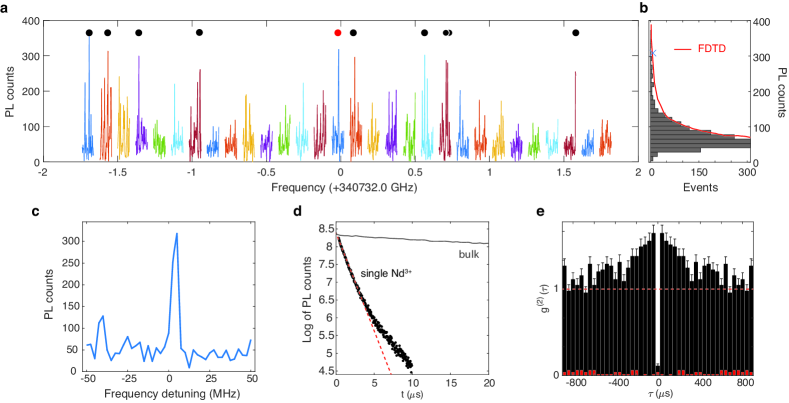
To search for singles, we scanned the frequency of a 200-ns resonant excitation pulse around 30 GHz blue detuning from the peak of line 1, and measured the PL integrated over 5 s after the excitation. The repetition rate of the excitation pulses was 25 kHz, and the integration time was 20 seconds at each frequency. The laser was frequency stabilized to a vacuum-chamber reference cavity attaining a narrowed linewidth of 5 kHz and a long-term drift 100 kHz/day. Figure 2(a) shows the measured PL over a few GHz range. A handful of peaks, such as the one with close-up in Fig.2(c), were possible single Nd3+ ions. The PL intensities were histogrammed in Fig.2(b) to reveal a distribution of ion-cavity coupling strengths, which is in good agreement with that from the finite difference time domain (FDTD) simulation (red). Thus, the PL intensity serves to correlate the coupling strength of each ion with its spatial position relative to the cavity anti-nodes: an ion located at the antinode would have the strongest coupling and show the highest PL. The linewidth of the peak in Fig.2(c) was broadened by the excitation pulse. The actual linewidth of single ions was expected to be considerably narrower. With the laser tuned on-resonance with one of the peaks (marked with a red dot in Fig.2(a)), the intensity autocorrelation measurement using a single detector yielded a g(2)(0) = 0.09 0.013 (Fig.2(e)) with 0.02 photons generated per pulse, which was normalized to g(2)() at large . The bunching behavior at 600s was expected from a multilevel emitter Kurtsiefer ; Wu . The imperfect anti-bunching was partly due to a continuum of ions that is weakly coupled to the cavity, resulting in a background in Fig.2(e). This background was measured with the excitation laser far detuned from the single ion resonance. The optical T1 of this ion was 2.10.2 s (Fig. 2(d)), which is strongly enhanced compared to the bulk T1 of 90 s. The lifetime enhancement corresponded to a Purcell factor of 111 of the probed Y1-Z1 transition considering a branching ratio of =0.38 (the ground state splits into five Kramers doublets Z1-Z5) SM . The theoretically maximum Purcell factor was 189 Purcell ; Mcauslan assuming a perfect alignment of the dipole with the cavity mode and is the local correction to the electric field since the ion is less polarizable than the bulk medium Dung , where we have used the real cavity approximation (supplemental material SM ). The discrepancy is attributed to the non-optimal position of the ion, and the actual cavity mode volume being different from simulation because of fabrication imperfections.
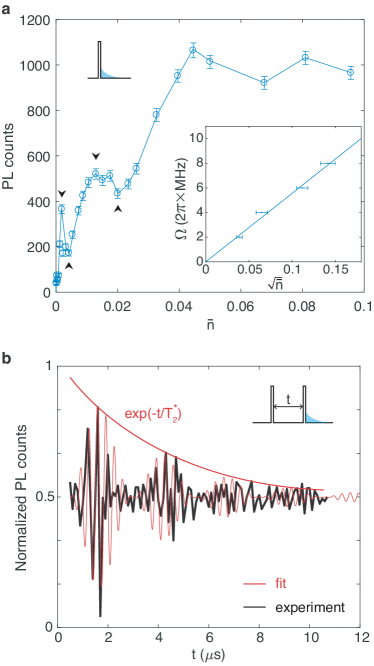
The small mode volume of the nanocavity results in a significant enhancement of the coupling strength . Focusing on the ion in Fig.2(c), Fig.3(a) plots the PL excited by a square 250-ns resonant pulse with increasing cavity mean photon number . The value of was calculated from the input pulse energy, all losses in the setup up to the device, and coupling rates of the photonic crystal mirrors (Supplemental material SM ). The PL shows Rabi oscillations similar to an optical nutation Gerhardt . The inset plots the extracted Rabi frequencies versus square root of from the peaks (corresponding to odd integer of pulse areas) and valleys (even integer of pulses) of the Rabi oscillations. The fitted slope corresponds to = 228.55.2 MHz. The theoretical maximum is 52.7 MHz Mcauslan , where =1.5910-31 Cm is the transition dipole moment (supplemental material SM ), =2.1785 is the refractive index of YVO4, is the transition frequency, and is the vacuum permittivity. The measured is orders of magnitude stronger than the linewidth of the emitter, which makes possible the use of hard optical pulses Pryde to coherently control each single ion. Next, we applied two pulses to measure the Ramsey interference as shown in Fig.3(b). The normalized Ramsey fringes (subtracting a T1 decay background) reveal a clear beating, which most likely corresponds to the superhyperfine interactions between Nd electronic spins and the nuclear spins of yttrium in YVO4 SM . The measured superhyperfine beating, confirmed by the two-pulse photon echo measurement (Supplemental material SM ), was 740 kHz, which is consistent with the calculations based on the gyromagnetic ratio of yttrium (Y) nuclear spins of 2.1 MHz/T Car ; SM . At a relatively strong field of 390 mT, the Nd-Y superhyperfine structure is dominated by the yttrium nuclear magnetic moment (Supplemental material SM ), as also observed in Nd3+:Y2SiO5 Usmani . The decay of the Ramsey fringe envelope can be fitted empirically to extract a T = 4.00.2 s. From that, the spectral indistinguishability is calculated as =0.952, indicating that the linewidth of this ion approaches the radiatively-limited regime.
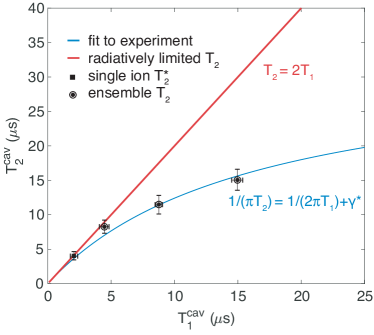
The use of single rare-earth ions as spin-photon interfaces to entangle remote quantum nodes requires each emitter’s linewidth to be radiatively limited. To further characterize the coherence of the ions coupled to the cavity, we performed additional ensemble two-pulse photon echo measurements when the emitters have different detunings from cavity resonance. The ensemble T2 times are plotted against optical T1 in Fig.4, including the single ion T data denoted by a square. The experimental data were fitted with the relationship , where is the pure dephasing rate. The fit (blue curve) gives a =9.70.6 kHz. While slow, this dephasing rate was attributed to the superhyperfine interactions since it closely matches the superhyperfine-limited T2 in Nd3+:YVO4 Sun . The contribution from Nd3+ spin flip-flops are expected to be small, because the measured T2 in an nominally undoped YVO4 crystal (residue doping estimated at 0.2 parts per million) was comparable to that measured in the current device (Supplemental material SM ).
The full radiatively limited T2=2T1 is plotted in red. With weak enhancement when the ions are detuned from the cavity, the ions exhibit poor indistinguishabilities as indicated by the sizeable gap between the red and blue curves. Only when the ions are coupled to the cavity resonantly, do they become radiatively limited. A similar approach has been used to improve the single photon indistinguishabilities of quantum dots Grange . To increase the indistinguishability, improving the cavity quality factor to further reduce T1 would be a straightforward step, which would also allow the device to operate at higher temperatures with stronger dephasing while still achieving radiatively limited emissions. The current linewidth of the single emitter was based on T values measured over a few s (Fig.3(b)). For longer time scales (100 s to ms), reducing the slow optical spectral diffusion could help to maintain a high indistinguishability, as desired by quantum memories for long-distance quantum network. In that regard, using rare-earth emitters in hosts with weaker nuclear spin baths or non-Kramers ions with weaker superhyperfine couplings and operating at a zero-first-order-Zeeman (ZEFOZ) point Fraval04 may offer some advantages.
In conclusion, we have optically detected single Nd3+ ions coupled to a nanophotonic cavity, which enhanced the emitter spontaneous emission rate to the extent that the linewidth of the emitter became radiatively-limited. Optical Rabi oscillations of the single Nd3+ yielded a =228.5 MHz, and a linewidth of 12.5 kHz (=1/(T2), where T2=25.4 s is the emitter homogeneous linewidth without cavity enhancement (Supplemental material SM )). Given the cavity decay of =290 GHz, the single ion cooperativity is =2.9. This value could be improved significantly by using cavities with higher Q (10 higher Q devices already demonstrated in Zhongfab would attain an indistinguishability 99.5% and C30), thus making feasible the implementation of high-fidelity non-destructive detection of optical photons with a single rare-earth ion Brien16 . Nevertheless, questions remain regarding the spin coherence and the qubit storage time of single ions Wolfowicz , and spectral diffusion occurring at longer time scales. When two spectrally resolved ions are nearby, their dipole-dipole interaction can also be probed Longdell . Single rare-earth ions could be used to probe the field and temperature of its nanoscopic surroundings. Finally, the large inhomogeneous linewidth of the emitters may facilitate spectral multiplexing of individual quantum emitters for expanded bandwidth of quantum communication networks.
Acknowledgements.
This work was funded by a National Science Foundation (NSF) Faculty Early Career Development Program (CAREER) award (1454607), the AFOSR Quantum Transduction Multidisciplinary University Research Initiative (FA9550-15-1-002), and the Defense Advanced Research Projects Agency Quiness program (W31P4Q-15-1- 0012). Equipment funding was also provided by the Institute of Quantum Information and Matter, an NSF Physics Frontiers Center with support from the Moore Foundation. The device nanofabrication was performed in the Kavli Nanoscience Institute at the California Institute of Technology. Part of the research was carried out at the Jet Propulsion Laboratory, California Institute of Technology, under a contract with the National Aeronautics and Space Administration. The authors would like to acknowledge Neil Sinclair, Ruffin Evans, Alp Sipahigil, Charles W. Thiel, Jeffrey Thompson for useful discussions.References
- (1) C. W. Thiel, T. Böttger, and R. L. Cone, J. Luminesc. 131, 353-361(2011).
- (2) Y. Sun, C. W. Thiel, R. L. Cone, R. W. Equall, and R. L. Hutcheson, J. Lumin. 98, 281-287 (2002).
- (3) W. Tittel, M. Afzelius, T. Chaneliére, R. L. Cone, S. Kröll, S. A. Moiseev, and M. Sellars, Laser & Photon. Rev. 4, 244-267 (2010).
- (4) H. de Riedmatten, M. Afzelius, M. U. Staudt, C. Simon, and N. Gisin, Nature 456, 773-777 (2008).
- (5) M. P. Hedges, J. J. Longdell, Y. Li, and M. J. Sellars, Nature 465, 1052-1056 (2010).
- (6) T. Zhong, et al. Science 357, 1392-1395 (2016).
- (7) L. A. Williamson, Y. -H. Chen, and J. J. Longdell, Phys. Rev. Lett. 113, 203601 (2014).
- (8) R. Kolesov et al. Nat. Commun. 3, 1029 (2012).
- (9) T. Utikal, et al. Nat. Commun. 5, 3627 (2014).
- (10) I. Nakamura, T. Yoshihiro, H. Inagawa, S. Fujiyoshi, and M. Matsushita, Sci. Rep. 4, 7364 (2014).
- (11) R. Kolesov, et al. Phys. Rev. Lett. 111, 120502 (2013).
- (12) P. Siyushev, et al. Nat. Commun. 5, 3895 (2014).
- (13) K. Xia, et al. Phys. Rev. Lett. 115, 093602 (2015).
- (14) C. Yin, M. Rancic, G. G. de Boo, N. Stavrias, J. C. McCallum, M. J. Sellars, and S. Rogge, Nature 497, 91-95 (2013).
- (15) A. M. Dibos, M. Raha, C. M. Phenicie, and J. D. Thompson, Phys. Rev. Lett. 120, 243601 (2018).
- (16) T. Zhong, J. M. Kindem, E. Miyazono, and A. Faraon, Nat. Commun. 6, 8206 (2015).
- (17) T. Zhong, J. M. Kindem, J. Rochman, and A. Faraon, Nat. Commun. 8, 14107 (2017).
- (18) T. Zhong, J. Rochman, J. M. Kindem, E. Miyazono, and A. Faraon, Opt. Express 24, 536-544 (2016).
- (19) N. Kukharchyk, D. Sholokhov, O. Morozov, S. L. Korableva, A. A. Kalachev and P. Bushev, New J. Phys. 20, 023044 (2018).
- (20) See Supplemental Material, which includes Refs. [21-36].
- (21) T. G. Tiecke, K. P. Nayak, J. D. Thompson, T. Peyronel, N. P. de Leon, V. Vuletić, and M. D. Lukin, Optica 2, 70-75 (2015).
- (22) B. Di Bartolo, Optical interactions in solids (Wiley, New York, 1968).
- (23) B. Henderson and G. Imbush, Optical spectroscopy of inorganic solids (Oxford University Press, 2006).
- (24) K. Dolgaleva, and R. W. Boyd, Adv. Opt. Photon. 4, 1-77 (2012).
- (25) H. T. Dung, S. Y. Buhmann, and D.-G. Welsch, Phys. Rev. A 74, 023803 (2006).
- (26) D. L. McAuslan, J. J. Longdell, and M. J. Sellars, Phys. Rev. A 80, 6 062307 (2009).
- (27) M. F. Reid, in Spectroscopic Properties of Rare Earths in Optical Materials, edited by G. Liu and B. Jacquier (Springer Berlin Heidelberg, 2005).
- (28) P. de Vries, and A. Lagendijk, Phys. Rev. Lett., 81, 7, 1381-1384 (1998).
- (29) I. Usmani, M. Afzelius, H. de Riedmatten and N. Gisin, Nature Commun. 1, 12 (2010).
- (30) B. Car, L. Veissier, A. Louchet-Chauvet, J.-L. Le Gouët and T. Chanelière, Phys. Rev. Lett. 120, 197401 (2018).
- (31) W. B. Mims, Phys. Rev. B 5, 2409 (1972).
- (32) H. de Riedmatten, M. Afzelius, M. U. Staudt, C. Simon and N Gisin, Nature 456, 773-777 (2008).
- (33) T. Böttger, C. W. Thiel, Y. Sun, and R. L. Cone, Phys. Rev. B 73, 075101 (2006)
- (34) S. R. Hasting-Simon, et al. Phys. Rev. B 77, 125111 (2008).
- (35) M. Afzelius, et al. J. Luminescence 130, 1566-1571 (2010).
- (36) T. Böttger, C. W. Thiel, R. L. Cone, and Y. Sun, Phys. Rev. B 79, 115104 (2009)
- (37) A. M. Stoneham, Rev. Mod. Phys. 41, 82-108 (1969).
- (38) W. E. Moerner and T. P. Carter, Phys. Rev. Lett. 59, 2705 (1987).
- (39) C. Kurtsiefer, S. Mayer, P. Zarda and H. Weinfurter, Phys Rev. Lett. 85, 290 (2000).
- (40) E. Wu, V. Jacques, H. Zeng, P. Grangier, F. Treussart and J.-F. Roch, Opt. Express 14, 1296 (2006).
- (41) E. M. Purcell, Phys. Rev. 69, 681 (1946).
- (42) I. Gerhardt, G. Wrigge, G. Zumofen, J. Hwang, A. Renn, and V. Sandoghdar, Phys. Rev. A 79, 011402(R) (2009).
- (43) G. J. Pryde, M. J. Sellars, and N. B. Manson, Phys. Rev. Lett. 84, 1152 (2000).
- (44) T. Grange, et al. Phys. Rev. Lett. 118, 253602 (2017).
- (45) E. Fraval, M. J. Sellars, and J. J. Longdell, Phys. Rev. Lett. 92, 077601 (2004).
- (46) C. O’Brien, T. Zhong, A. Faraon, and C. Simon, Phys. Rev. A 94, 043807 (2016).
- (47) G. Wolfowicz, et al. Phys. Rev. Lett. 114, 170503 (2015).
- (48) J. J. Longdell and M. J. Sellars, Phys. Rev. A 69, 032307 (2004).
I Supplementary material for optically addressing single rare-earth ions in a nanophotonic cavity
II Details on the experimental setup
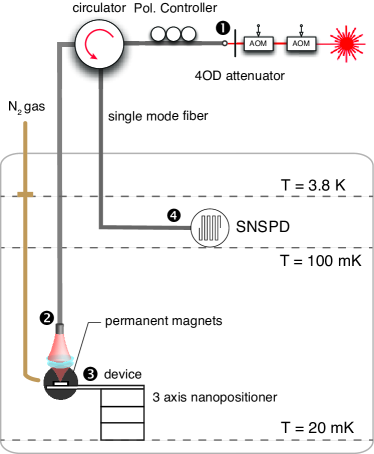
Figure S1 illustrates the experimental setup with more details. The Nd3+:YVO4 sample crystal was soldered with indium onto a copper plate that was mounted on top of a 3-axis nanopositioner, and was thermally connected to the 20 mK base plate of the dilution refrigerator. Cavity tuning was realized by gas condensation using N2 gas. The gas tube (brown line in Fig. S1) was thermally anchored to the 3.8 K stage. When performing gas tuning, a heater on the gas tube heats it up to 30 K to allow gas to flow through. The heater was turned off after tuning. This configuration was used to minimize the heat load generated by the tube, allowing the lowest possible temperature at the sample.
Fiber-waveguide coupling efficiency The coupling to the waveguide was realized by a 45∘-angled cut into the YVO4 substrate Zhongsci . This angled cut allows the vertically focused beam (from a fiber) to be total internally reflected into the nanobeam waveguide. The aspherical doublet has an effective focal length of 10.5 mm on the fiber side and 2.9 mm on the sample side (Fig.S1). The coupling was optimized by fine scanning the focal spot on the sample surface using the nanopositioner and looking for the cavity resonance on a spectrometer. The overall fiber-waveguide coupling efficiency was characterized by measuring the reflection of a pulse far off resonance with the cavity (i.e. in the photonic bandgap). The pulse propagated from point 1 (marked in Fig.S1) to 2, 3, and was reflected back to 2, then 4. The transmission efficiency from 1 to 2 (64.1%), and from 2-4 (51.7%) were directly measured. The only unknown was the coupling efficiency from 2 to 3. This coupling efficiency could be uniquely determined from the total pulse reflection, and was found to be 19%.
Photon collection efficiency For each photon emitted by an ion into the cavity, the probability of that photon to be transmitted to the coupling waveguide was =45%. The photon then propagated from 3 to 2 (19% waveguide-fiber coupling), and from 2 to 4 (79.9% transmission through all fiber slices/connectors and 64.7% transmission through the optical circulator), and was finally detected by the 82%-efficient superconducting nanowire detector. Thus, the overall collection efficiency for a cavity photon was 0.450.190.800.650.82 = 3.6%. To improve this efficiency, further refinement in fabrication is needed to achieve a highly over-coupled cavity with 80%, which should be within reach since we have achieved symmetric two-sided cavities of Q as high as 20,000 Zhongfab . Furthermore, the use of tapered fiber-waveguide coupling could improve the fiber-to-device coupling to 97% Tiecke . These combined with lower loss fiber components could increase the overall efficiency to 70%.
Cavity mean photon number To obtain the cavity mean photon number in Fig.3, we first calculate the peak power of the excitation pulse in the waveguide i.e. Pin with knowledge of the transmission from 1 to 2 and the coupling efficiency from 2 to 3. The cavity mean photon number was , where 40 GHz was the cavity in-coupling rate, 90 GHz was the total cavity decay rate, and is the photon frequency.
II.1 Optical properties of Nd3+ in YVO4 and Purcell factor
The absorption area for the 4IZFY optical transition in a 10 ppm Nd3+:YVO4 sample was measured in zero magnetic field with E c by Sun et al. Sun to be 3.4 cm-1 cm GHz cm-1. Because the electric dipole transition is heavily -polarized, we can calculate the transition oscillator strength from the absorption area using DiBartolo1968 ; Henderson2006
| (1) |
where is the vacuum permittivity, is the mass of the electron, is the charge on the electron, is the speed of light, is the number density, is the local field correction, is the refractive index, and is the absorption coefficient as a function of frequency .
For the 10 ppm Nd3+:YVO4 crystal measured by Sun et al. Sun , and for light polarized along the -axis of the crystal. The local field correction factor usually takes one of two forms in the literature, depending on whether the virtual cavity or real cavity model is used Reid2005 ; McAuslan2009 ; Dung2006 ; Dolgaleva2012 :
| (2) |
is the virtual cavity model, and
| (3) |
is the real cavity model correction.
Both the virtual and real cavity models are approximations to the full local field correction in that they assume that the field due to the polarization of atoms nearby in the lattice is zero Reid2005 . The real cavity model has been shown to be suitable for substitutional ions Vries1998 including rare-earth ions in crystalline hosts Dolgaleva2012 . In this work, the predictions based on the real cavity model are more consistent with our current knowledge of material and experimental results.
We note that there is inconsistency in the literature regarding oscillator strengths and dipole moments of 4f - 4f transitions for rare-earth ions in crystals because values and expressions are not always explicit as to which local field correction, if any, is assumed. Here we detail our derivations to make it clear the assumptions we have made and how that impacts the theoretical predictions.
When assuming the real cavity model for the local field correction, from Eq. 1 we calculate an oscillator strength . For the applied field of 390 mT along the a-axis we expect optical transitions 2 and 3 to be forbidden. In this case, transitions 1 and 4 each have an oscillator strength .
The radiative lifetime is related to the oscillator strength by DiBartolo1968 ; Henderson2006
| (4) |
which gives a value of s. Given the lifetime of the 4FY state measured by fluorescence was s, the branching ratio of emission to the 4IZ state is .
The transition dipole moment is related to the oscillator strength by DiBartolo1968 ; Henderson2006
| (5) |
where is the frequency 4IZFY optical transition. Equation 5 differs from the expressions relating to in Reid2005 . This is because in Reid2005 no field corrections are assumed in relating to . Using Equation 5, we calculate a dipole moment Cm.
Given and the cavity energy decay rate GHz, the lifetime of the Nd3+ ion in the cavity is given by
| (6) |
Therefore, the predicted s. The Purcell enhancement factor of the resonant transition is derived to be .
III Photon echo measurements
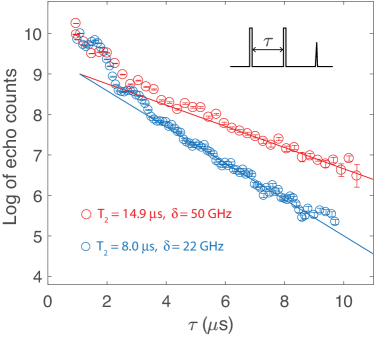
Two pulse photon echo measurements were performed on an ensemble of ions in the cavity near the center of inhomogneous distribution (e.g. line 1). The cavity resonance was tuned to different frequencies using a gas condensation technique to obtain homogeneous linewidths of ions at varying Purcell enhancement conditions. Fig.S2 plots the photon echo decays at ensemble-cavity detuning of 22 and 50 GHz. Oscillations in the echo intensities correspond to syperhyperfine interactions between Nd spins and Y nuclear spins Usmani at 740 kHz, which agree with the beat frequency observed in the Ramsey interference fringes. Note that the period of the oscillations appears to be twice long in the Ramsey fringes than in the echo decays, because the photon echo is emitted after twice the delay between two pulses. The T2 were fitted from the linear section of the decay, which started after approximately 4 s.
IV Modelling superhyperfine couplings
The superhyperfine interaction is between an electronic spin (Nd in this case) and a neighbouring ligand nuclear spin (yttrium or vanadium). This interaction has been studied in the literature and was typically orders of magnitude weaker than the rare-earth electronic Zeeman interactions (the gyromagnetic ratio of Nd3+ is 3.9-33 GHz/T). As a result, the associated Hamiltonian can be treated as a perturbation to the electronic Zeeman coupling of Nd3+ under external applied magnetic field Car .
| (7) |
where is the Y3+ nuclear spin magnetic moment, the externally applied magnetic field, the Nd3+ electronic spin and the vector connecting two spins. The superhyperfine coupling at zero field - the terms in Eq. (7) that are not dependent on - causes each of the Zeeman levels (both ground and excited) to split into a nuclear doublet. Such splitting can be readily calculated from the electronic magnetic dipole moment from the known anisotropic g-factors of Nd. As the applied field increases, eventually the term dominates over other terms and the splitting becomes approximately linear with . Thus, in high fields, the superhyperfine splitting strongly depends on the gyromagnetic ratios of specific ligand nuclear spins. For yttrium it is 2.1 MHz/T. For vanadium it is 11.2 MHz/T. At B = 390 mT along a-axis, the expected superhyperfine splitting of each of the Zeeman branches can be estimated based on atomic coordinates of the yttrium or vanadium ions surrounding the Nd center.
For Nd-Y coupling, there are 4 nearest neighbour Y ions at equal distance of 3.9 from each Nd ion. The zero-field superhyperfine splitting is calculated to be 80 kHz and 30 kHz for the optical ground and excited levels, respectively. With an applied field of 390 mT along a-axis, the total splitting from Eq. (7) gives 740 kHz and 790 kHz for ground and excited levels.
For Nd-V coupling, the nearest distance between them is 3.14 . Since vanadium has 7/2 spins, there are a total of 8 superhyperfine sublevels. The splittings between those levels at 390 mT field ranges from 4 -30 MHz. Given that the optical excitation pulse only has a bandwidth of 2 MHz, it is unlikely that multiple Nd-V superhyperfine sublevels were excited.
The envelope modulation in Fig. 3(b) can be modelled after derivations in Mims , which include beatings at frequencies , , () and (), with their relative strengths dependent on the degree of spin mixing. Due to limited sampling and likely over-simplification of the model, the experimental data (black) in Fig. 3(b) cannot be fitted well with a known analytical form. Instead, an empirical fit (red) was used to identify the dominant beat frequency. The best fit gives 740 kHz, which is in general agreement with the , calculated above. We therefore infer that the observed beating was likely originated from the Nd-Y superhyperfine interaction but unlikely from Nd-V couplings. The latter is expected to give a splitting 4 MHz. The Nd-V superhyperfine coupling was indeed reported in deRiedmatten in the same Nd3+:YVO4 material to be about 5 MHz at 0.3 T field.
IV.1 OPTICAL DEPHASING IN Nd3+:YVO4
Possible contributions to the optical dephasing =9.7 kHz include superhyperfine coupling between Nd spins and yttrium/vanadium nuclear spins, the Nd spin flip-flops, direct phonon couplings, and other higher order processes. Here we discuss contributions from two potentially dominant mechanisms.
Superhyperfine interaction The experimental condition in the current work closely reassembles that in Sun in which optical T2 for a 10 ppm doped Nd3+:YVO4 sample was measured at varying magnetic field applied along the a-axis of the crystal. It was found in Sun that with a field greater than 1.5 T, the T2 of 27 s became limited by the Nd-Vanadium superhyperfine interaction. The corresponding dephasing rate could be calculated from 1/(T2) - 1/(2T1) = 10.0 kHz, which was very close to the dephasing rate measured here. We thus expect that the superhyperfine interactions contribute substantially to the measured . Based on the spin interaction models in Bottger06 , we could numerically estimate the broadenings due to Nd-Y and Nd-V interactions to be 34 and 14 kHz, respectively; these values are in order-of-magnitude agreement with the measurement.
Nd spin flip-flops Dephasing due to the Nd spin flip-flops is a function of the Nd doping concentration and temperature. To better understand this process, we measured optical T2 times in both the 50 ppm doped (the same crystal on which the devices were fabricated) and a nominally undoped YVO4 crystal. From the absorption spectroscopy and secondary ion mass spectroscopy (SIMS), we estimated the doping concentration of Nd to be 0.2 ppm in the undoped YVO4. Therefore, the dephasing owing to spin flip-flops is expected to be relatively small in that sample. Both crystals were soldered to a common sample holder. With the same magnetic field configuration as in the main text, the ground level splitting was =12.88 GHz where =2.36 is the ground state g-factor Hastings ; AfzeliusYVO , and = 0.39 T. We then used the ratio between the absorptions of two Zeeman transitions to calibrate the crystal temperature. When both crystals were at 500 mK, we measured a T = 25.4 s and T = 27.0 s in 50 ppm doped and undoped YVO4 crystals, respectively. The difference in linewidths, which amounts to 1 kHz, serves as an upper bound on dephasing due to Nd spin flip-flops at 500 mK.
Using the models put forth by Bottger06 ; Bottger09 , the optical dephasing due to Nd-Nd spin flip-flops can be estimated from a Lorentzian spectral diffusion model as Bottger09 where
| (8) |
where is the Nd magnetic dipolar interaction,
| (9) |
and . Using m-3 as the Nd concentration at 50 ppm doping, and Nd spin T=98 ms measured from spectral holeburning at 500 mK, we predict a corresponding optical dephasing to be 30 Hz Bottger09 . This implies that our measurement is dominated by other interactions, such as the superhyperfine interaction.
References
- (1) T. Zhong, et al. Science 357, 1392-1395 (2017).
- (2) T. Zhong, J. Rochman, J. M. Kindem, E. Miyazono, and A. Faraon, Opt. Express 24, 536-544 (2016).
- (3) T. G. Tiecke, K. P. Nayak, J. D. Thompson, T. Peyronel, N. P. de Leon, V. Vuletić, and M. D. Lukin, Optica 2, 70-75 (2015).
- (4) Y. Sun, C. W. Thiel, R. L. Cone, R. W. Equall, and R. L. Hutcheson, J. Lumin. 98, 281-287 (2002).
- (5) B. Di Bartolo, Optical interactions in solids (Wiley, New York, 1968).
- (6) B. Henderson and G. Imbush, Optical spectroscopy of inorganic solids (Oxford University Press, 2006).
- (7) K. Dolgaleva, and R. W. Boyd, Adv. Opt. Photon. 4, 1-77 (2012).
- (8) H. T. Dung, S. Y. Buhmann, and D.-G. Welsch, Phys. Rev. A 74, 023803 (2006).
- (9) D. L. McAuslan, J. J. Longdell, and M. J. Sellars, Phys. Rev. A 80, 6 062307 (2009).
- (10) M. F. Reid, in Spectroscopic Properties of Rare Earths in Optical Materials, edited by G. Liu and B. Jacquier (Springer Berlin Heidelberg, 2005).
- (11) P. de Vries, and A. Lagendijk, Phys. Rev. Lett., 81, 7, 1381-1384 (1998).
- (12) I. Usmani, M. Afzelius, H. de Riedmatten and N. Gisin, Nature Commun. 1, 12 (2010).
- (13) B. Car, L. Veissier, A. Louchet-Chauvet, J.-L. Le Gouët and T. Chanelière, Phys. Rev. Lett. 120, 197401 (2018).
- (14) W. B. Mims, Phys. Rev. B 5, 2409 (1972).
- (15) H. de Riedmatten, M. Afzelius, M. U. Staudt, C. Simon and N Gisin, Nature 456, 773-777 (2008).
- (16) T. Böttger, C. W. Thiel, Y. Sun, and R. L. Cone, Phys. Rev. B 73, 075101 (2006)
- (17) S. R. Hasting-Simon, et al. Phys. Rev. B 77, 125111 (2008).
- (18) M. Afzelius, et al. J. Luminescence 130, 1566-1571 (2010).
- (19) T. Böttger, C. W. Thiel, R. L. Cone, and Y. Sun, Phys. Rev. B 79, 115104 (2009)