First determination of -delayed multiple neutron emission beyond through direct neutron measurement: The P2n value of 136Sb.
Abstract
Background: -delayed multiple neutron emission has been observed for some nuclei with A100, being the 100Rb the heaviest 2n emitter measured to date. So far, only 25 P2n values have been determined for the 300 nuclei that may decay in this way. Accordingly, it is of interest to measure P2n values for the other possible multiple neutron emitters throughout the chart of the nuclides. It is of particular interest to make such measurement for nuclei with A100 to test the predictions of theoretical models and simulation tools for the decays of heavy nuclei in the region of very neutron-rich nuclei. In addition, the decay properties of these nuclei are fundamental for the understanding of astrophysical nucleosynthesis processes such as the -process, and safety inputs for nuclear reactors.
Purpose: To determine for the first time the two neutron branching ratio, P2n value, for 136Sb through a direct neutron measurement, and to provide precise P1n values for 136Sb and 136Te.
Method: A pure beam of each isotope of interest was provided by the JYFLTRAP Penning trap at the Ion Guide Isotope Separator On-Line (IGISOL) facility of the University of Jyväskylä, Finland. The purified ions were implanted into a moving tape at the end of the beam line. The detection setup consisted of a plastic scintillator placed right behind the implantation point after the tape to register the -decays, and the BELEN detector, based on neutron counters embedded in a polyethylene matrix. The analysis was based on the study of the - and neutron- growth-and-decay curves and the -one-neutron and -two-neutron time correlations, which allowed us the determination of the neutron-branching ratios.
Results: The P2n value of 136Sb was found to be 0.14(3)% and the measured P1n values for 136Sb and 136Te were found to be 32.2(15)% and 1.47(6)%, respectively.
Conclusions: The measured P2n value is a factor 44 smaller than predicted by the finite-range droplet model plus the quasiparticle random-phase approximation (FRDM+QRPA) model used for -process calculations.
pacs:
27.80.+w, 23.40.−s, 26.30.-k,21.10.-kI Introduction
The decay Q value (Qβ value) increases when going towards neutron-rich nuclei in the chart of nuclides. This makes decay the dominant decay mode for this region. In very neutron-rich nuclei, the emission of one or more neutrons may also occur after a -decay. This process of -delayed neutron () emission was discovered in 1939 by Roberts et al. Roberts et al. (1939) and is energetically allowed when the Qβn value is positive, i.e. the Qβ value of the decay exceeds the neutron separation energy (Sn) of the daughter nucleus. This phenomenon becomes dominant when the populated state in the daughter nucleus, following the -decay, is higher in excitation energy than Sn, which gets lower going towards neutron-rich nuclei in the chart of nuclides. When the populated states lie even higher than the two-neutron separation energy, S2n, i.e. Q, two neutron emission may also occur. This phenomenon was predicted in 1960 by Goldansky Goldansky (1960). The first studies of multiple-neutron emission were carried out in the 1980s in which detection of two-neutron emission was observed for nuclei up to mass A=33 and predictions for the emission of three neutrons were made for masses around A=100 Lyutostansky et al. (1985). The -delayed two-neutron () emission probability, P2n value, has only been experimentally determined for 25 isotopes (two of them only approximations) Audi et al. (2017) of out of 300 potential multiple neutron emitter candidates Wang et al. (2017). The importance of providing more precise data for neutron emitting isotopes has been highlighted by the IAEA Coordinated Research Projects in Refs. Dillmann et al. (2017) and on -delayed neutron emission evaluation Abriola et al. (2011). The latter emphasizes the importance of these data for safety improvement purposes for emerging nuclear power reactors, as well as for astrophysical studies. Indeed, these experimental data, involving isotopes in the neutron-rich region, are needed to achieve a better knowledge of the “freeze-out” of the rapid neutron capture (-process) Burbidge et al. (1957) when theoretical calculations of nucleosynthesis Arcones and Martínez-Pinedo (2011); Mumpower et al. (2016a); Surman et al. (2014) are applied. The delayed neutron emission is an important input for these models as it shifts the final isobaric solar system abundances of some species to lower masses, and introduces neutrons in the stellar environment that can be re-captured by other nuclei at later stages. This is of special interest in the regions of the -abundance peaks such as A130 near the doubly-magic 132Sn isotope (N=82 and Z=50). Up to now, the Pn data available for the heavy mass region is scarce, especially above Caballero-Folch et al. (2016), and non-existent for multiple neutron emitters above .
This paper presents a measurement of the P2n neutron branching ratio for 136Sb. With a Qβ2n window of 1884(6) keV Wang et al. (2017), 136Sb has been suggested to be a multiple-neutron emitter in several theoretical models Möller et al. (2003); Borzov (2016); Mumpower et al. (2016b) and by some experiments: these include estimates based on the Finite Fermi-system theory Lyutostansky and Panov (1983) and more recently an experiment involving several isotopes of mass in which the isobars could not be separated well enough to determine their neutron branching ratios precisely Testov et al. (2011). In order to get a successful measurement of multiple -delayed neutron emission, we used a high efficiency neutron detector and a beam free from contamination of other isotopes. The pure 136Sb beam was obtained with the Penning trap mass spectrometer, JYFLTRAP, at the Ion Guide Isotope Separator On-Line (IGISOL) facility Äystö (2001); Hakala et al. (2012), located in the Accelerator Laboratory of the University of Jyväskylä, Finland (JYFL). This contribution describes the experimental setup in Section II, the details of the data analysis following the methodology reported in Agramunt et al. (2016) and the results in Sec. III. A summary and discussion are presented in Sec. IV, and the conclusions are given in Sec. V.
II Experimental setup
The experiment presented in this paper was carried out at the IGISOL facility of JYFL. The isotopes of interest were produced in nuclear fission induced with a 25 MeV proton beam, with an intensity of around 7-10 , impinging on a natural uranium target. The fission fragments produced were extracted from the helium gas cell using a sextupole ion guide (SPIG) Karvonen et al. (2008) and differential pumping, accelerated to 30 keV and mass-separated with a dipole magnet. The continuous beam was cooled and bunched using an RFQ cooler-buncher device Nieminen et al. (2001) before injecting the ions into the JYFLTRAP double Penning trap. The purification took place in the first trap, where a mass-selective buffer gas cooling technique Savard et al. (1991) was employed to resolve different isobars based on their cyclotron resonance frequencies , where q and m are the charge and the mass of the ion of interest and B is the magnetic field strength inside the trap. The description and the principles of the JYFLTRAP at IGISOL are reported in Ref. Eronen et al. (2012), and Figs. 1 and 2 of Ref. Kolhinen et al. (2013) detail the layout of the IGISOL facility.
In this experiment, pure ion beams of 95Rb, 137I, 136Te and 136Sb were extracted from the trap without isobaric contaminants and transported to the implantation system. 95Rb and 137I were used for calibration purposes, as their P1n values are well known from previous experiments Rudstam et al. (1993); Pfeiffer et al. (2002); Liang et al. (2018). The implantation system consisted of a moving magnetic tape placed inside an aluminum tube, with a thickness of 1 mm and diameter of 46 mm, under vacuum. This tube linked JYFLTRAP and the end of the beamline, shown in Fig. 1.
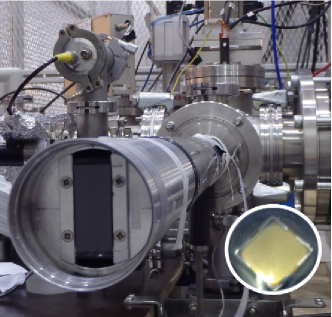
The moving tape system allowed control of the ion-implantation (beam on) and decay (beam off) times according to the half-life of the isotope measured, in order to be able to reproduce the growth-and-decay curves in the analysis (see Section III). The detection system in this experiment consisted of a 3 mm-thick plastic scintillator counter, shown in Fig. 1 (bottom-right), placed at the end of the vacuum tube, surrounded by the Beta dELayEd Neutron (BELEN) detector Torner et al. (2014); Gómez-Hornillos et al. (2011, 2014). The latter consisted of 48 3He counter tubes of 2.54 cm diameter manufactured by LND Inc. LND , distributed in three concentric rings, and embedded in a high-density polyethylene (HDPE) matrix to moderate the neutrons, see Fig. 2. BELEN was surrounded by 20 cm of HDPE shielding in order to moderate and absorb neutrons scattered from the surroundings (see also Fig. 2).

Table 1 summarizes its characteristics.
| Central | Ring | |||
|---|---|---|---|---|
| hole | Inner | Middle | Outer | |
| Position (diameter) | 60 | 120 | 230 | 340 |
| Number of counters (10 atm) | 0 | 8 | 0 | |
| Number of counters (8 atm) | 6 | 10 | 24 | |
The version of the BELEN detector used in this experiment was specifically designed and optimized by means of Monte Carlo MCNPX Pelowitz et al. (2005); Fishman (1996); Rubinstein and Kroese (1981); Riego (2016) and Geant4 Agostinelli et al. (2003); Tarifeño-Saldivia, A. (2017) simulations in order to achieve a high and flat efficiency detection in the range from 0.12 MeV (see Fig. 3).

The most important constraint was in terms of efficiency: for the detection of two correlated neutrons, the efficiency, , is roughly proportional to the square of the detection efficiency for a single neutron, :
| (1) |
To avoid a low detection probability the central hole of BELEN was kept at 6 cm diameter, restricted to the diameter size of the vacuum tube of the implantation system. With this geometry, BELEN reached a one-neutron efficiency of 60%, and 36% for a two-neutron event, in the Qβn energy range of the isotopes of interest. The disadvantatge of this optimization compared to other designs was the impossibility of placing a high-purity germanium (HPGe) detector right behind the implantation point to verify the identity of the isotope implanted by -ray detection. This latter technique was used in the prior experiment during the same experimental campaign with another version of the BELEN detector, measuring isotopes in the same region of the nuclear chart Agramunt et al. (2017). The one-neutron efficiency for that version of BELEN detector was 40% in the same energy range (0.12 MeV) due to a different geometry, while using the same number of 3He neutron counters. For the present work, the efficiency obtained in the simulations, shown in Fig. 3, was experimentally validated at En=2.13 MeV using a 252Cf source, and with beams of isotopes with well-known P1n values, such as 95Rb and 137I, as reported in Section III.
Previous experiments using the BELEN detector demonstrated that it works well with the self-triggered data acquisition system specifically implemented for BELEN, named GASIFIC Agramunt et al. (2016); Caballero-Folch et al. (2017). This system integrates all signals from the - and the 3He neutron counters recording their energy, and a time-stamp with a clock of 10 ns resolution to be able to build the -neutron time-correlations over a certain time-window. In this experimental campaign, differential to single-ended converter modules, designed at JYFL, were added in the electronic chain. This made possible to link the output signals from the MPR-16-HV Mesytec preamplifiers, directly connected to the 3He tubes, to the SIS3316 Str sampling ADC modules in the data acquisition system Agramunt et al. (2017). This improvement enabled the recording of the data without requiring the signal shapers used in previous experiments.
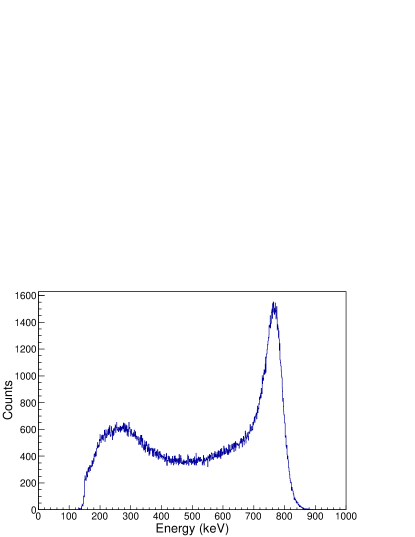
Regarding the response of the neutron detection system, the energy spectrum obtained for the neutron events comprises the range from a low-energy threshold at 191 keV up to the 764 keV peak. This energy is attributed to the kinetic energy released in the reaction:
| (2) |
The 764 keV peak corresponds to the sum of the collection of the total energy released by the two reaction products, a triton and a proton. The lower energy detection threshold is related to the partial collection of the energy and the wall effect Ravazzani et al. (2006). Gain-matching with a calibrated 252Cf source was carried out for all 48 3He counters before the experiment. The stability of the overall detector response was checked regularly during the experiment. The accumulated spectrum for all 48 tubes during the 136Sb measurement is shown Fig. 4. The latter includes the uncorrelated neutron events, which were removed in the data analysis process together with other light particles and the noise at lower energies.
III Determination of the neutron branching ratios
The equation that describes the total -delayed neutron branching probability, Pn, of a nucleus is defined as the sum of all, single and multiple, neutron emission contributions present in the decay:
| (3) |
For nuclei with only one-neutron emission energetically allowed, i.e. Q0 and Q0, the Pn value is equal to P1n. This is the case for the 95Rb, 137I, and 136Te isotopes measured in this experiment. In order to determine their P1n values, we followed the methodology successfully implemented in a previous experiment with a similar setup at the IGISOL facility Agramunt et al. (2016) in which the P1n values were deduced as:
| (4) |
where Nβ1n is the number of the net and neutron time-correlated events, Nβ the number of decays registered, is the mean efficiency, the averaged efficiency above the Sn weighted according to the Qbn and the neutron energy spectrum range (see Fig. 5), and the neutron efficiency (see Fig. 3).

The analysis of the acquired data directly provides three parameters that are needed to evaluate and determine the neutron branching ratios. These are the number of particles and the number of neutrons detected, together with the time-correlation events. Figure 6 shows the analysis to determine the and neutron integrals for each measured isotope, 95Rb, 137I, 136Te, and 136Sb, from the growth-and-decay curves, using the Bateman equations Bateman (1910).
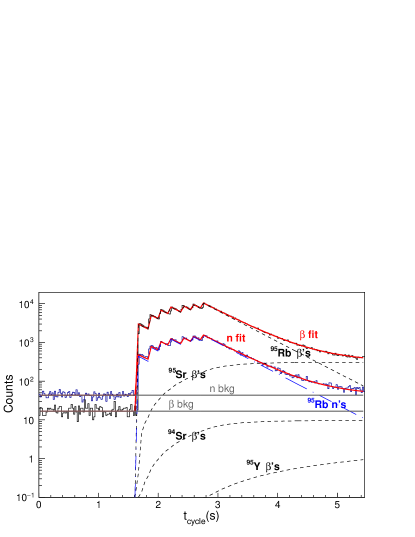

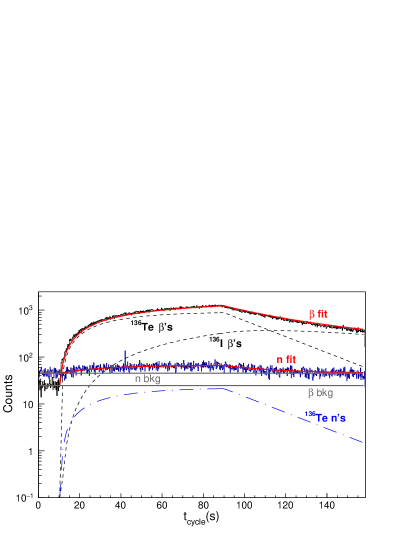

The particular growth (implantation) and decay times in the curves were precisely set according to the half-lives, taken form the literature nnd , of the isotopes present in the decay chain. The flat area at the beginning of the timing cycle (see fig. 6) corresponds to the characterization of the and neutron background. Table 2 provides the Qβ values of interest together with half-lives and the details of their implantation and decay cycle times. The numerical results from Fig. 6 for the precursor isotopes are shown in later tables.
| Nuclei | 95Rb | 137I | 136Te | 136Sb |
|---|---|---|---|---|
| t1/2(s) | 0.3777(8) | 24.5(2) | 17.63(8) | 0.923(14) |
| Q(keV) | 9228(20) | 6027(8) | 5120(14) | 9916(7) |
| Qβn(keV) | 4881(20) | 2002(8) | 1292(6) | 5147(7) |
| Qβ2n(keV) | 1951(20) | 6082(8) | 6509(15) | 1884(6) |
| Impl. time (s) | 1.27 | 81.3 | 79.5 | 3.80 |
| Decay time (s) | 2.54 | 171.5 | 68.5 | 3.71 |
In the present work 137I and 95Rb beams were used as calibration isotopes because of their well-known P1n values Rudstam et al. (1993); Pfeiffer et al. (2002); Liang et al. (2018). In addition, these two isotopes have very different neutron energy spectra (see Fig. 3). In the case of 95Rb, its neutron energy spectrum is mainly centered at lower energies, with a large Qβn value of 4.8 MeV. This indicates that the lower detection probability at lower energies (see Fig. 5) does not miss correlated events in the analysis. Therefore, assuming in Eq. 4, it is possible to determine its P1n value to a first approximation with the equation:
| (5) |
The resulting P1n value for 95Rb, considering a constant value of 62.98%, taken from the simulation and weighted with the neutron spectrum, is 8.6(4)%, in agreement with the literature value of 8.94(37)% Liang et al. (2018). On the other hand, 137I has a neutron spectrum spread over the whole energy range up to its endpoint at 2 MeV (see Fig. 3). In this case its analysis is affected due to the non-constant efficiency at low energies (see Fig 5), and the simplified expression detailed in Eq. 5 is not accurate enough. Thus, we defined an expression to avoid the and dependence in Eq. 4 as in Ref. Agramunt et al. (2016), using the total number of detected neutrons, Nn, independently of the coincidence or not with the :
| (6) |
from which, it is then possible to determine the ratio with the well-known values of the 95Rb and 137I calibration isotopes. The ratio obtained can be used to determine the remaining P1n values in this experiment. Table 3 summarizes the integral values of the correlated events, the number of events, Nβ, and the number of neutrons, Nn, for the 95Rb and 137I measurements, together with the calculated / ratio.
| Nuclei | P1n(%) | Nβn | Nβ | Nn | / |
|---|---|---|---|---|---|
| 95Rb | 8.94(37) Liang et al. (2018) | 33011 | 610229 | 90445 | 1.66(7) |
| 137I | 7.66(14) Liang et al. (2018) | 21888111Biased value due to the lower at lower energies. | 592009 | 72031 | 1.59(3) |
The average of the / ratio, calculated from 95Rb and 137I measurements in Table 3, is 1.62(7). As these two isotopes have large Qβ values this ratio value is expected to be alike. Thus, we assume that this value also applies for all the other isotopes measured in this experiment.
III.1 The P1n value of 136Te
With a Qβn value of 1292(6) keV, 136Te has an energy window that allows -delayed one-neutron emission. In this case the expected energy spectrum of the emitted neutrons is also affected by the non-constant at low energies described above for 137I. Thus, the equation to determine its neutron branching ratio can be defined by Eq. 6, using the / ratio determined with the calibration isotopes. With the integral values obtained in the analysis of the growth-and-decay curves in Fig. 6, the analysis yields a P1n of 1.47(6)%. This value is slightly higher but in fair agreement with those reported in the literature and the IAEA evaluation: 1.31(5)% Rudstam et al. (1993); Liang et al. (2018) and 1.26(20)% Pfeiffer et al. (2002). Using the simplified Eq. 5, with the correlated detected events derived from the analysis of Fig. 7,

the P1n value would be 0.90(5)%. Comparing this value with the one obtained using the efficiency ratio correction we observe an increase of about 63%. This gives an idea of the fraction of correlated events missed because of the lower at low energies when measuring an isotope with a neutron energy spectrum such as 136Te (see Fig. 5). The acquired data for this isotope in this measurement were recorded for 165 cycles which included a background measurement of 10 s, an implantation time of 79.5 s, and a decay time of 68.5 s for each one, giving 158.5 s per cycle (see Fig. 6 and Table 2), i.e. 7.3 h of beamtime. A total of 2082 net correlated events were registered for this isotope. The values of this analysis are reported in Table 4.
| Nuclei | Nβ1n | Nβ2n | Nβ | Nn | P1n(%) | P2n(%) |
|---|---|---|---|---|---|---|
| 136Te | 2082 | - | 360655 | 8645 | 1.47(6) | - |
| 136Sb | 9328 | 21.8 | 57590 | 30455222Includes the 1n and 2n events from 136Sb, and 1n events from 136Te. | 32.2(15) | 0.14(3) |
III.2 P1n and P2n values of 136Sb
As described in Section I, when the state populated after the decay is higher than the two-neutron separation energy, S2n, in the daughter nucleus (Q), double neutron emissions are allowed. This is the case for 136Sb with Qβ2n=1884(6) keV. Its measurement in this experiment comprised 26465 recorded implantation-and-decay cycles of 9.51 seconds (3 days). As can be observed in Fig. 6, in each cycle the first 2 s were used to characterize the and neutron background. Table 2 details the implantation-and-decay cycle times. The neutron branching ratios of this isotope have two contributions to the Pn (Eq. 3): the P1n and the P2n values.
In order to determine its neutron branching ratios, several steps are necessary. Eq. 7 describes the total number of neutrons, Nn, after background subtraction:
| (7) |
As can be seen the total number of neutrons has contributions from the one- and two-neutron emission branching ratios of 136Sb plus a small contribution from its daughter 136Te. The latter is present in the decay chain and the relevant number of neutrons can be determined with the information extracted from the 136Sb -decay analysis (Fig. 6) and its P1n value. In order to calculate the contributions of one-neutron and two-neutron events from the 136Sb decay in Eq. 7, we define the following expressions:
| (8) |
and
| (9) |
These expressions relate the number of events, Nβ, and neutron events, Nxn, and their detection efficiency, to the unknown P1n and P2n values. However, from the available information, the analysis only provides the net number of Nβ events for each one of the species in the decay chain, and the net number of the total neutron events, Nn, after background subtraction. Firstly, we attempted to determine the net number of two-neutron correlations, N2n, from the decay of 136Sb subtracting the two-neutron correlations determined in a background run. As shown in Fig. 8, this method is not useful because of the large uncertainty in the background subtraction.

The large background can be associated with different kinds of interactions between particles, either cosmic rays or reactions of the beam with materials, and the BELEN detector.
Therefore, the strategy to determine the neutron branching ratios was based on the evaluation of the direct and correlation events recorded in the data analysis. Figures 9 and 10 show, respectively, the and time-correlation events registered within a neutron moderation time-window of 500 .


In the analysis of the correlation were registered 55 forward events, , and 6 backward events, , corresponding to the number of two accidental neutrons in the neutron moderation time-window. In order to evaluate the total background contributions present in the 55 detected events, we assume that the neutron rates are the same within the neutron moderation time-window, before and after a decay. For the case of two neutrons accidentally correlated per detected , we define the parameter as the number of backward time-correlations, , and the total number of -decays, , obtained from Fig. 6 and reported in Table 4:
| (10) |
The amount of events contributing due to this rate includes all decays except those coming from the and events, i.e. . However, according to the measured values, we can assume that , and the background from this - channel is approximately of . Another relevant background contribution comes from the detection of one accidental neutron inside the same correlation time-window of a truly correlated neutron. In this case we define the parameter as the backward time-correlations, , as obtained in the analysis presented in Fig. 10, and the total number of -decays from Fig. 6:
| (11) |
In addition, this - background channel has also contributions from those neutrons in the - channel in which one of the neutrons has not been detected. This can be estimated with the neutron efficiency factor defined as:
| (12) |
being the total contribution of the one neutron channel as . To summarize, Eqs. 13 and 14 describe the system that relates the number of measured and (forward) events, and , with the true events, and , and background contributions, assuming :
| (13) |
| (14) |
where is the sum of all accidental neutrons per detected , , which are added on each particular background channel in the latter equations. In this measurement, this sum was simplified considering that , and only the first two contributions were taken into account. Solving the system presented in Eqs. 13 and 14, the resulting values for the and , in the 136Sb measurement, are 21.8 and 9328 respectively. The method described above is presented in detail in Ref. Tolosa-Delgado et al. (2018) within the BRIKEN Project Dillmann and Tarifeño-Saldivia (2018).
If we were to assume that the mean energy of the neutron spectrum is not affected by the lower at low energies, the P2n value could be calculated with a simplified expression such as Eq. 15, analogously to Eq. 5 used for the case of 95Rb for its P1n value:
| (15) |
With this assumption, the P2n value would be 0.10(2)%. However, due to the expected low in the energy region of interest for the two-neutron energy spectrum (Qβ2n value 1884(6) keV, see Fig. 5), it is necessary to apply the correction based on the (Eq. 16) in the same way as Eq. 4 for the case of one-neutron emission (see Section III):
| (16) |
The unknown neutron energy spectrum for the 136Sb two-neutron emission suggests the use of the calculated value for 137I, as its Qβn value, 2002 keV, is very close to the 136Sb Qβ2n value. So, using the / coefficient, 1.62(7), previously determined, the P2n value is calculated to be 0.14(3)%. Having obtained the P2n, the P1n value, has been determined to be 32.2(15)%.
IV Summary and discussion
The P1n and P2n values obtained in this work are summarized in Table 5 together with the previously available experimental values and theoretical predictions from several models, including the finite-range droplet model plus the quasiparticle random-phase approximation (FRDM+QRPA) Möller et al. (2003), the density functional theory plus continuum QRPA plus relativistic QRPA(DF3+cQRPA+RQRPA) Borzov (2006, 2013), the Koura-Tachibana-Uno-Yamada (KTUY) Koura et al. (2005), the relativistic Hartree-Bogoliubov plus RQRPA (RHB+RQRPA) Marketin et al. (2016), the QRPA plus Hartree-Fock (QRPA-HF) Möller et al. (2018), and the semi-empirical effective density model Miernik (2014).
| Isotope | t1/2 (s) nnd | P1n(%) | P | Technique | Date and | t1/2(s) | P1n(%) | P2n(%) | Model | Ref. | ||
| (Experimental) | Ref. | (Theory) | ||||||||||
| Te84 | 17.63(8) | 1.47(6) | - | ,n | (This work) | 10.166 | 2.43 | 0.0 | FRDM+QRPA | Möller et al. (2003) | ||
| 1.26(20) | - | ,n | (2002) Pfeiffer et al. (2002) | 21.189 | 1.80 | - | DF3+cQRPA+RQRPA | Borzov (2013) | ||||
| 1.31(5) | - | ,n | (1993) Rudstam et al. (1993) | 0.600 | 0.41 | - | KTUY | Koura et al. (2005) | ||||
| 1.7(8)333Updated values from the evaluation performed in Ref. Rudstam et al. (1993). | - | Fission,,n | (1978) Crancon et al. (1978) | 0.548 | 0.4 | 0.1 | RHB+RQRPA | Marketin et al. (2016) | ||||
| 0.7(4) | - | Fission,n | (1977) Rudolph et al. (1977) | - | 2 | 0 | QRPA-HF | Möller et al. (2018) | ||||
| 1.31(5) | - | Evaluation | (2018) Liang et al. (2018) | - | 2.8 | 0.0 | Semi-empirical | Miernik (2014) | ||||
| Sb85 | 0.923(14) | 32.2(15) | 0.14(3) | ,n | (This work) | 1.998 | 33.5 | 6.19 | FRDM+QRPA | Möller et al. (2003) | ||
| - | 1.4(2)444Measurement with isobaric contamination. | ,n | (2011) Testov et al. (2011) | 0.8 | 10.5(51) | 4.15(1.05) | DF3+cQRPA+RQRPA | Borzov (2016) | ||||
| 19.5(18) | - | recoil | (2015) Caldwell (2015) | 0.760 | 33.20 | 0.0 | KTUY | Koura et al. (2005) | ||||
| 23.2(68) | - | ,n | (2002) Pfeiffer et al. (2002) | 0.175 | 3.8 | 0.2 | RHB+RQRPA | Marketin et al. (2016) | ||||
| 16.3(32) | - | ,n | (1993) Rudstam et al. (1993) | - | 30.0 | 0 | QRPA-HF | Möller et al. (2018) | ||||
| 33(40)3 | - | Fission,,n | (1978) Crancon et al. (1978) | - | 37.3 | 0.0 | Semi-empirical | Miernik (2014) | ||||
| 44(57)3 | - | Fission,n | (1977) Rudolph et al. (1977) | 0.46 | 17.1 | 0.28 | Microscopic Finite | Lyutostansky and Panov (1983) | ||||
| 18.7(18) | 1555Based on preliminary results of this study. | Evaluation | (2018) Liang et al. (2018) | Fermi-system theory | ||||||||
The P1n value obtained for 136Te, 1.47(6)%, is higher but in fair agreement with those reported in Refs. Rudstam et al. (1993); Pfeiffer et al. (2002) and Liang et al. (2018). Concerning 136Sb, the analysis yields a P1n value of 32.2(15)%. This is higher than previous experimental results also taken from Refs. Rudstam et al. (1993); Pfeiffer et al. (2002) and Liang et al. (2018). In the case of the P2n we have obtained a value of 0.14(3)%. This is one order of magnitude lower than the 1.4% estimated in a measurement with isobaric contamination Testov et al. (2011), and the predictions of the FRDM+QRPA and the DF3+cQRPA+RQRPA models.
As shown in Table 5, the values of most of the theoretical predictions are far from the experimental values. Some of them are compatible for 136Sb but not for 136Te, and vice versa. With the current results it is not easy to decide which of the models reproduces better the experimental results. The DF3+cQRPA Borzov (2013, 2016) approaches better the magnitudes of the P1n and half-life for 136Te, but in the case of 136Sb, although the predicted half-life is close to the experimental value, it underestimates P1n value and overestimates the P2n value. The model which better reproduces the 136Sb data is the KTUY Koura et al. (2005) but the half-life predicted for 136Te remains far from the experimental value. Regarding the QRPA-HF Möller et al. (2018) model, it is the one which better reproduces the P1n and P2n values for both isotopes according the obtained experimental results.
To date, several calculations and estimates for multiple-neutron emission beyond A=100 have also been reported. Table 5 reports the available ones for the isotopes measured in this study. Some of them follow the main theoretical models describing the strength functions and some others are estimates and extrapolations like Miernik (2014). Concerning experimental measurements, there is a recent P2n value reported for 140Sb Moon et al. (2017). This value was determined through an indirect measurement based on relative intensities of -rays observed from transitions that were identified as belonging to 138Te. The value reported is “about” 8% and no uncertainty was given. This suggests again the need for direct neutron measurements in order to obtain more precise data on neutron emission branching ratios.
V Conclusions and outlook
We have determined the neutron branching ratios for 136Te and 136Sb through a direct neutron measurement. This represents the first experimental multiple-neutron emission value above A=100 and an improvement for the values available so far for these isotopes. As discussed above, some of the theoretical predictions agree well with the values obtained, but none shows agreement for all of the parameters present in the decay. This, together with the discrepancies with the experimental data available, indicates that more measurements with pure beams and direct neutron detection are needed in order to provide further input for the models in this region, and to study the nuclear properties above the neutron separation energies. Consequently, this experimental campaign in which six more isotopes included in the IAEA priority list for reactor physics Dillmann et al. (2014) were also measured Agramunt et al. (2017), and present and future campaigns like BRIKEN Dillmann and Tarifeño-Saldivia (2018) are an opportunity to increase the amount of data available in this field.
It is also of interest to determine whether the two neutrons are emitted simultaneously or sequentially in the -delayed two neutron-emission process. In the first case an angular correlation between both neutrons and the -ray emitted by the final nucleus would be expected. In the second case it would be necessary to correlate these events with very narrow time-windows to be able to confirm the phenomenon. In this work we were not able to address this question because of the moderation of the neutrons in the polyethylene matrix and the statistics available.
Acknowledgements.
This work was supported by the National Research Council of Canada (NSERC) Discovery Grants SAPIN-2014-00028 and RGPAS 462257-2014 at TRIUMF, and by the Spanish Ministerio de Economia y Competitividad under grants: FPA2010-17142, AIC-D-2011-0705, FPA2011-28770-C03-03, FPA2011-24553, FPA2014-52823-C2-1-P, FPA2014-52823-C2-2-P and the program Severo Ochoa (SEV-2014-0398). It is also supported by the European Commission under the FP7/EURATOM contract 605203 and by the Academy of Finland under the Finnish Centre of Excellence Programme 2012–2017 (Project No. 213503, Nuclear and Accelerator-Based Physics Research at JYFL). A.K. also acknowledges the Academy of Finland grants No. 275389 and 284516. I.D. and M.M. acknowledge the support of the German Helmholtz Association via the Young Investigators Grant No. VH-NG 627 (LISA- Lifetime Spectroscopy for Astrophysics). W.G. acknowledges the support of the UK Science & Technology Faculties Council (STFC) under grant No. ST/F012012/1 and the University of Valencia.References
- Roberts et al. (1939) R. Roberts, R. Meyer, and P. Wang, Physical Review 55, 510 (1939).
- Goldansky (1960) V. Goldansky, Nuclear Physics 19, 482 (1960).
- Lyutostansky et al. (1985) Y. S. Lyutostansky, V. Sirotkin, and I. Panov, Physics Letters B 161, 9 (1985).
- Audi et al. (2017) G. Audi, F. Kondev, M. Wang, W. Huang, and S. Naimi, Chinese physics C 41, 030001 (2017).
- Wang et al. (2017) M. Wang, G. Audi, F. Kondev, W. Huang, S. Naimi, and X. Xu, Chinese physics C 41, 030003 (2017).
- Dillmann et al. (2017) I. Dillmann, P. Dimitriou, and B. Singh, Development of a Reference Database for Beta-Delayed Neutron Emission, Tech. Rep. (INDC(NDS)-0735 - IAEA, 2017).
- Abriola et al. (2011) D. Abriola, B. Singh, and I. Dillmann, Beta-Delayed Neutron Emission Evaluation, Tech. Rep. (INDC(NDS)-0599 - IAEA, 2011).
- Burbidge et al. (1957) E. Burbidge, G. Burbidge, W. Fowler, and F. Hoyle, Rev. Mod. Phys 29, 547 (1957).
- Arcones and Martínez-Pinedo (2011) A. Arcones and G. Martínez-Pinedo, Physical Review C 83, 045809 (2011).
- Mumpower et al. (2016a) M. Mumpower, R. Surman, G. McLaughlin, and A. Aprahamian, Progress in Particle and Nuclear Physics 86, 86 (2016a).
- Surman et al. (2014) R. Surman, M. Mumpower, J. Cass, I. Bentley, A. Aprahamian, and G. C. McLaughlin, in EPJ Web of Conferences, Vol. 66 (EDP Sciences, 2014) p. 07024.
- Caballero-Folch et al. (2016) R. Caballero-Folch et al., Physical Review Letters 117, 012501 (2016).
- Möller et al. (2003) P. Möller, B. Pfeiffer, and K.-L. Kratz, Physical Review C 67, 055802 (2003).
- Borzov (2016) I. Borzov, Physics of Atomic Nuclei 79, 910 (2016).
- Mumpower et al. (2016b) M. Mumpower, T. Kawano, and P. Möller, Physical Review C 94, 064317 (2016b).
- Lyutostansky and Panov (1983) Y. S. Lyutostansky and I. Panov, Zeitschrift für Physik A Hadrons and Nuclei 313, 235 (1983).
- Testov et al. (2011) D. Testov et al., “Esp-rus congress,” (2011), http://icc.ub.edu/congress/ESP-RUS2011/ Talks_Presentations/Parallel_Sessions/Seminar_S214/09-11-11/Testov.pdf.
- Äystö (2001) J. Äystö, Nuclear Physics A 693, 477 (2001).
- Hakala et al. (2012) J. Hakala et al., Physical Review Letters 109, 032501 (2012).
- Agramunt et al. (2016) J. Agramunt et al., Nuclear Instruments and Methods in Physics Research Section A: Accelerators, Spectrometers, Detectors and Associated Equipment 807, 69 (2016).
- Karvonen et al. (2008) P. Karvonen, I. Moore, T. Sonoda, T. Kessler, H. Penttilä, K. Peräjärvi, P. Ronkanen, and J. Äystö, Nuclear Instruments and Methods in Physics Research Section B: Beam Interactions with Materials and Atoms 266, 4794 (2008).
- Nieminen et al. (2001) A. Nieminen, J. Huikari, A. Jokinen, J. Äystö, E. Collaboration, et al., in Atomic Physics at Accelerators: Mass Spectrometry (Springer, 2001) pp. 527–530.
- Savard et al. (1991) G. Savard, G. Bollen, H.-J. Kluge, R. Moore, T. Otto, L. Schweikhard, H. Stolzenberg, U. Wiess, et al., Physics Letters A 158, 247 (1991).
- Eronen et al. (2012) T. Eronen et al., in Three decades of research using IGISOL technique at the University of Jyväskylä (Springer, 2012) pp. 61–81.
- Kolhinen et al. (2013) V. Kolhinen et al., Nuclear Instruments and Methods in Physics Research Section B: Beam Interactions with Materials and Atoms 317, 506 (2013).
- Rudstam et al. (1993) G. Rudstam, K. Aleklett, and L. Sihver, Atomic Data and Nuclear Data Tables 53, 1 (1993).
- Pfeiffer et al. (2002) B. Pfeiffer, K.-L. Kratz, and P. Möller, Progress in Nuclear Energy 41, 39 (2002).
- Liang et al. (2018) J. Liang et al., Submitted to Nuclear Data Sheets (2018), Evaluation of Beta-Delayed Neutron Emission Probabilities and Half-Lives for Z 28.
- Torner et al. (2014) A. Torner, J. Agramunt, A. Algora, L. Batet, R. Caballero-Folch, F. Calviño, D. Cano-Ott, A. García, G. Cortés, I. Dillmann, C. Domingo-Pardo, M. Gómez-Hornillos, V. Gorlychev, M. Marta, T. Martínez, A. Poch, C. Pretel, A. Riego, and J. Taín, Technical Design Report of the Beta-Delayed Neutron Detector (BELEN) for NUSTAR (DESPEC), Tech. Rep. (Universitat Politècnica de Catalunya, Barcelona (Spain)., 2014).
- Gómez-Hornillos et al. (2011) M. Gómez-Hornillos et al., Journal of Physics: Conference Series 312, 052008 (2011).
- Gómez-Hornillos et al. (2014) M. Gómez-Hornillos et al., Hyperfine Interactions 223, 185 (2014).
- (32) LND Inc, http://www.lndinc.com.
- Pelowitz et al. (2005) D. B. Pelowitz et al., MCNPX user’s manual version 2.5.0, Tech. Rep. (Los Alamos National Laboratory, 2005).
- Fishman (1996) G. Fishman, Monte-Carlo concepts, Algorithms and Applications (1996).
- Rubinstein and Kroese (1981) R. Y. Rubinstein and D. P. Kroese, Simulation and the Monte Carlo Method (1981).
- Riego (2016) A. Riego, Design of the BELEN detector for wide energy range with flat and high detection efficiency, Ph.D. thesis, Universitat Politècnica de Catalunya, Barcelona (Spain). (2016).
- Agostinelli et al. (2003) S. Agostinelli et al., Nuclear instruments and methods in physics research section A: Accelerators, Spectrometers, Detectors and Associated Equipment 506, 250 (2003).
- Tarifeño-Saldivia, A. (2017) Tarifeño-Saldivia, A., (2017), (private communication).
- (39) Evaluated Nuclear Structure Data File ENSDF. http://www.nndc.bnl.gov, http://www.nndc.bnl.gov/nudat2/indx_dec.jsp, http://www.nndc.bnl.gov/sigma/index.jsp.
- Agramunt et al. (2017) J. Agramunt et al., in EPJ Web of Conferences, Vol. 146 (EDP Sciences, 2017) p. 01004.
- Caballero-Folch et al. (2017) R. Caballero-Folch et al., Phys. Rev. C 95, 064322 (2017).
- (42) Struck Innovative Systems, http://www.struck.de.
- Ravazzani et al. (2006) A. Ravazzani, A. F. Para, R. Jaime, M. Looman, M. M. Ferrer, P. Peerani, and P. Schillebeeckx, Radiation measurements 41, 582 (2006).
- Bateman (1910) H. Bateman, Proc. Camb. Philos. Soc. 15, 423 (1910).
- Tolosa-Delgado et al. (2018) A. Tolosa-Delgado et al., To be published - Private Communication (2018).
- Dillmann and Tarifeño-Saldivia (2018) I. Dillmann and A. Tarifeño-Saldivia, Nuclear Physics News 28, 28 (2018).
- Borzov (2006) I. Borzov, Nuclear Physics A 777, 645 (2006).
- Borzov (2013) I. Borzov, “-decay and delayed neutron emission of very neutron-rich nuclei,” in Fission and Properties of Neutron-Rich Nuclei (World scientific, 5thInternational Conference on Fission and properties of neutron-rich nuclei(ICFN5), 2012, 2013) pp. 530–537, + (private communication).
- Koura et al. (2005) H. Koura, T. Tachibana, M. Uno, and M. Yamada, Progress of theoretical physics 113, 305 (2005).
- Marketin et al. (2016) T. Marketin, L. Huther, and G. Martínez-Pinedo, Physical Review C 93, 025805 (2016).
- Möller et al. (2018) P. Möller, M. Mumpower, T. Kawano, and W. Myers, Atomic Data and Nuclear Data Tables (2018), https://doi.org/10.1016/j.adt.2018.03.003.
- Miernik (2014) K. Miernik, Physical Review C 90, 054306 (2014).
- Crancon et al. (1978) J. Crancon, C. Ristori, H. Ohm, W. Rudolph, K.-L. Kratz, and M. Asghar, Zeitschrift für Physik A Hadrons and Nuclei 287, 45 (1978).
- Rudolph et al. (1977) W. Rudolph, K.-L. Kratz, and G. Herrmann, Journal of Inorganic and Nuclear Chemistry 39, 753 (1977).
- Caldwell (2015) S. Caldwell, A trapped-ion technique for beta-delayed neutron studies., Ph.D. thesis, University of Chicago (2015).
- Moon et al. (2017) B. Moon et al., Physical Review C 95, 044322 (2017).
- Dillmann et al. (2014) I. Dillmann, P. Dimitriou, and B. Singh, Development of a Reference Database for Beta-delayed Neutron Emission Evaluation, Tech. Rep. (INDC(NDS)-0643 - IAEA, 2014).