Tunka-Rex Collaboration
Reconstruction of cosmic ray air showers with Tunka-Rex data using template fitting of radio pulses
Abstract
We present an improved method for the precise reconstruction of cosmic-ray air showers above eV with sparse radio arrays. The method is based on the comparison of measured pulses to predictions for radio pulse shapes by CoREAS simulations. We applied our method to the data of Tunka-Rex, a 1 km2 radio array in Siberia operating in the frequency band of 30-80 MHz. Tunka-Rex is triggered by the air-Cherenkov detector Tunka-133 and by scintillators (Tunka-Grande). The instrument collects air-shower data since 2012. The present paper describes an updated data analysis of Tunka-Rex and details of the new method applied. After quality cuts, when Tunka-Rex reaches its full efficiency, the energy resolution of about 10% given by the new method has reached the limit of systematic uncertainties due to the calibration uncertainty and shower-to-shower fluctuations. At the same time the shower maximum reconstruction has improved compared to the previous method based on the slope of the lateral distribution and reaches a precision of better than 35 g/cm2. We also define conditions of the measurements at which the shower maximum resolution of Tunka-Rex reaches a value of 25 g/cm2 and becomes competitive to optical detectors. To check and validate our reconstruction and efficiency cuts we compare individual events to the reconstruction of Tunka-133. Furthermore, we compare the mean of the shower maximum as a function of primary energy to the measurements of other experiments.
pacs:
96.50.sd, 95.55.Jz, 07.50.Qx,I Introduction
The energy spectrum and the mass composition of ultrahigh energy cosmic rays (with primary energies above 100 PeV) is of special interest since it sheds light on the transition from galactic to extragalactic accelerators. There are many methodological approaches of decoding energy and composition spectra using particle and optical detectors D. Ivanov for the Pierre Auger Collaboration and the Telescope Array collaboration (2017); V. De Souza for the Pierre Auger Collaboration and the Telescope Array collaboration (2017). Meanwhile, radio detectors have shown their ability of precise reconstruction of air showers produced by ultra-high energy cosmic rays Huege (2016); F. G. Schröder (2017). Tunka-Rex was the first large-scale, sparse radio array which has shown that it is possible to reconstruct the primary energy with a resolution of about 15% and shower maximum with a competitive resolution of about 40 g/cm2, even having only a few antennas involved per event P.A. Bezyazeekov, et al. - Tunka-Rex Coll. (2016). LOFAR with its very dense layout (hundreds antenna stations per event) achieved a shower maximum resolution comparable with optical detectors Buitink et al. (2014), however it will be very difficult (due to costs) to build large-scale detectors focused on energies higher than eV with this density. To complement studies performed in this energy range by optical detectors, radio detectors should feature the same energy and shower maximum resolution (10% and 20 g/cm2 respectively). This is crucial for the next-generation radio detectors focused on detection of gamma ray photons Balagopal V. et al. (2018) and neutrino Martineau-Huynh et al. (2017) .
A step toward high precision is completed in the present approach: we try to exploit as much information as possible from the radio pulse to perform a precise reconstruction of the primary energy and the depth of the shower maximum. The existing standard reconstruction by Tunka-Rex uses only the pulse maxima P.A. Bezyazeekov, et al. - Tunka-Rex Coll. (2016), and the new method additionally makes use of the pulse shape. Based on the standard procedure the reconstructed events are reproduced with CoREAS Huege et al. (2013) simulations for different primary particles. Then the pulse shapes of simulated radio pulses are fitted to the measured ones.
In this work, we discuss requirements and advantages of the proposed method, describe the details of the updated Tunka-Rex reconstruction, and present a cross-check of the Tunka-Rex results with Tunka-133 Prosin et al. (2016). As a result the mean of the shower maximum as a function of primary energy is reconstructed from Tunka-Rex events (triggered by Tunka-133) acquired from 2012.
II Detector description and calibration
The Tunka Radio Extension (Tunka-Rex) is a radio array for the detection of cosmic rays in the energy range of to eV. It is located at the Tunka Advanced Instrument for cosmic rays and Gamma Astronomy (TAIGA) Budnev et al. (2017) near Lake Baikal, Siberia. The radio array is equipped with 63 antenna stations measuring radio emission in the frequency band of 30-80 MHz, distributed on 1 km2. Each antenna station consists of two short aperiodic loaded loop antennas (SALLA) Abreu et al. (2012), aligned perpendicularly to each other in the horizontal plane. The signal at the antennas is amplified and digitalized with a sampling rate of 200 MS/s, and recorded in traces with 1024 samples each. The basic description of Tunka-Rex is given in Ref. P.A. Bezyazeekov, et al. - Tunka-Rex Coll. (2015) and the details of upgrade and latest results are given in Ref. Kostunin et al. (2017a).
To reconstruct the electric field at the antenna it is necessary to know the hardware response of the antenna station, namely antenna pattern, and the gain and phase responses of the electronics. The signal circuit of Tunka-Rex was calibrated under laboratory conditions. The antenna pattern and phase response were calculated with the simulation code NEC2 Burke and Poggio (1977), then a calibration of the absolute gain was performed P.A. Bezyazeekov, et al. - Tunka-Rex Coll. (2015). The absolute amplitude calibration of the Tunka-Rex antenna station was performed with the same reference source as for LOPES Apel et al. (2016a) which enabled us to perform a cross-check between KASCADE-Grande and Tunka-133 energy scales Apel et al. (2016b).
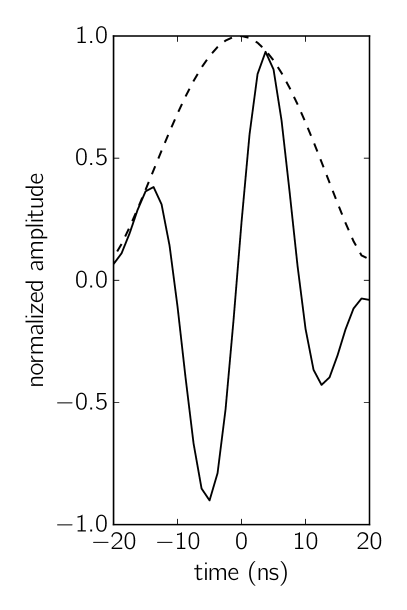
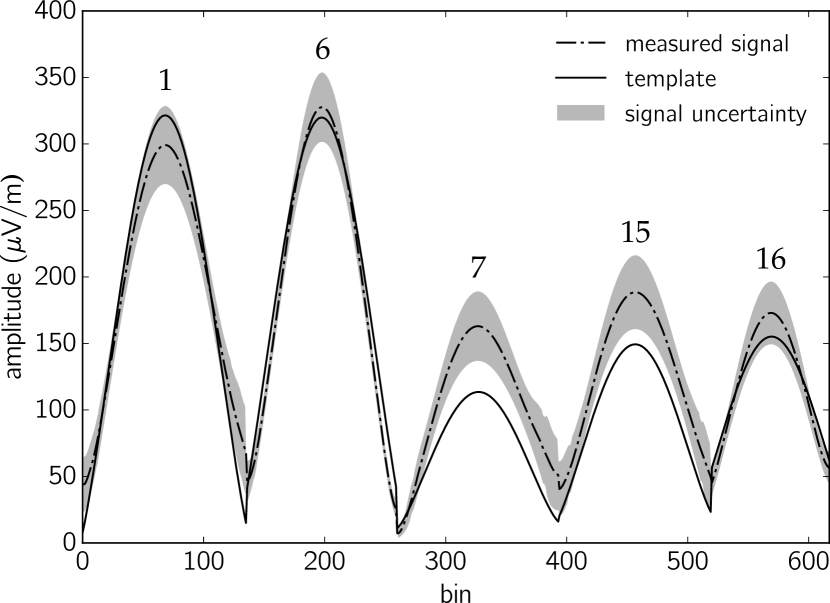
In Ref. D. Kostunin et al. (2017) (Tunka-Rex Collaboration) we suggested an approach for reconstruction which uses the full information of the radio measurements, i.e. uses measured electric fields at the antennas (instead of only the maximum of signal amplitudes or signal powers). Upon closer inspection, we have found that our phase calibration does not provide sufficient accuracy for application of this approach. One can see the difference between simulated and reconstructed pulses in Fig. 1, which would introduce a significant systematic uncertainty in the analysis. Nevertheless, the envelopes (i.e. instantaneous amplitudes) of the signals are still in very good agreement and used in the analysis described in the present paper. This means that in contrast to the frequency-dependent phase response, the frequency-dependent gain of all instrumental components is understood sufficiently well. Using the full shape of the envelope the information content of each measurement is increased by several times compared to prior methods which use single observables per antenna station, such as the maximum amplitude or pulse integral.
III Signal reconstruction
The envelope of the signal is defined as the absolute value of the analytic signal , where denotes the Hilbert transformation. Since we measure two polarization directions of the air-shower signal, the resulting envelope is calculated as follows:
| (1) |
where and are components of the electric fields measured in the shower plane Kostunin et al. (2016), the third component perpendicular to them contributes only to less than 2% Apel et al. (2014) and is neglected 111This component can be included in the analysis of very-high SNR events, however the expected improvement in the resolution of the shower maximum is estimated to less than 1 g/cm2.
Compared to our previous analysis we optimized the estimation of the signal-to-noise ratio (SNR) and the signal selection. Since we occasionally have RFI in the signal and noise windows, especially after upgrades at the TAIGA facility, the following improvements were introduced:
-
•
The full width of a pulse is limited to 50 ns. Hereafter we define the pulse width as the distance between the two minima of the envelope closest to the peak (in Fig. 1 the peak of the amplitude is at 0 ns, and the closest minima are at and ns, i.e. the full width of the pulse is ns). To prevent low-frequency RFI passing through the signal window all “broad” pulses (with a width of more than 50 ns) are omitted from the analysis. The 50 ns window is determined from simulations, which showed that the width of air-shower signals is approximately 40-45 ns for the conditions of Tunka-Rex.
-
•
Sliding noise window. As experience has shown the SNR estimation using a fixed noise window (slightly before the signal window in case of Tunka-Rex) is affected by occasional RFI in the noise window. To improve this estimation we use a sliding window of 500 ns and define the noise level as the smallest RMS in the entire trace within the noise window. Since this value is systematically smaller than the average noise level, the threshold SNR was increased from to the value of .
-
•
Neighborhood SNR. Since the approach described above is useful for treating RFI out of the signal window, the following cut is used in cases when RFI passes the signal window and/or overlaps with signal. In this case the power of the signal peak is divided by the RMS of amplitudes surrounding the signal (i.e. ns around the pulse). Since we do not have the full description of all possible RFI, in this case, the conservative cut of is set for data analysis.
-
•
Manual RFI rejection. As mentioned before, after the Tunka-Rex upgrade, due to intensive developments in the valley many transient broadband peaks appeared in the Tunka-Rex traces. The antenna stations spoiled with this noise were rejected manually. In future we plan to train an artificial neural network for automatically tagging antennas contaminated by such RFI.
Since the true signal is heavily impacted by the noise at low SNRs it is necessary to take this into account. First, SNR determines the uncertainty of the reconstructed signal. Secondly, the noise contamination changes the total power of the signal: on the one hand the total power is increased on average, on the other hand it is decreased after applying a median filter, used to remove narrow-band RFI. Therefore the signal is corrected using a function derived from simulations with measured background: . Details can be found in Refs. Allan et al. (1970); Schröder et al. (2012). The novelty of our approach is the additional functional dependence on the time in the trace relative to a peak of the signal ( at the peak). Thus the full pulse shape of the envelope is corrected for a bias due to noise (see Appendix A for details).
IV Event reconstruction
The improved reconstruction of Tunka-Rex consists of the following basic steps:
-
1.
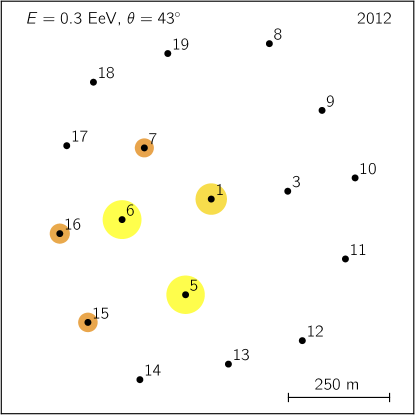
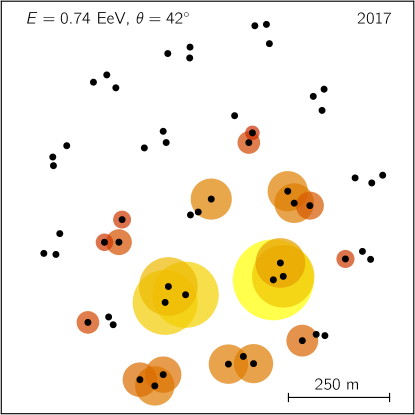
Pre-reconstruction using the standard Tunka-Rex analysis pipeline with the improvements described above. This reconstruction provides the shower axis and core position from Tunka-133 and the energy reconstructed by Tunka-Rex. Let us note that since 2012 (generation 1) the density of the Tunka-Rex antenna array was increased threefold (starting from 2016, generation 3), yet the hardware and reconstruction pipeline are almost the same for all three generations (except for updates in calibration, data format, etc.). The footprints of reconstructed example events from 2012 and 2017, respectively, are given in Fig. 2.
-
2.
Creating a library with CoREAS simulations for each event obtained in the previous step with the goal to cover all possible depths of shower maxima possible for the particular event. The reconstructed energy and geometry were used as input for the simulations with different primaries: hydrogen (proton), helium, nitrogen and iron nuclei 222The simulations and corresponding documentation will be published at tunka.astroparticle.online in the frame of Russian-German Data Life Cycle Initiative. We use CORSIKA v75600 Heck et al. (1998) with QGSJet-II.04 Ostapchenko (2011). The selection of the hadronic model does not play a significant role in this analysis, for details see Appendix B.
-
3.
Chi-square fit of the simulated envelopes against reconstructed ones. The shower maximum and primary energy are reconstructed from the fits.
In the present method the envelope of the electrical field at the antenna station is used instead of the amplitude or power of the signal. The measured amplitudes are prepared as follows: each signal is bounded within the signal window ns (the width is flexible and optimized to have only one peak per envelope), and all of them are concatenated to a single time series with length of , where is the number of antenna stations, is the size of bin:
| (2) |
where is the index within trace at -th antenna station, and is the position of the peak at this antenna station. denotes the rectangular window function, where . The concatenated uncertainties of the measured signal (see Appendix A) and template from the simulation are defined the same way. It is worth to note, that for a more precise fit it is necessary to upsample the traces with resolutions ns. The technique of concatenation enables us to perform the following chi-square fit in a more elegant way. Equivalently, the algorithm could iterate over all antenna stations with signal.
After concatenation of the traces the simulated electrical field is fitted to a measured one using one free parameter , namely the normalization factor, using chi-square criteria:
| (3) |
The proper normalization of chi-square is defined by the upsampling factor and our estimation is valid only for ( in our case). The shower maximum is defined as minimum of the parabola with the confidence interval defined by the standard procedure ().
It is worth noticing that all chi-square distributions obtained in the present analysis are lying on the parabolic curves while in Ref. Buitink et al. (2014) only the points around minima are described by the parabola. In the original paper Buitink et al. (2014) this behavior is described as “jitter” introduced by shower-to-shower fluctuations which is also present in our analysis. However our chi-square distributions still conserve the parabolic shape even far from the minimum which points to a different explanation of the “jitter” behavior obtained by LOFAR.
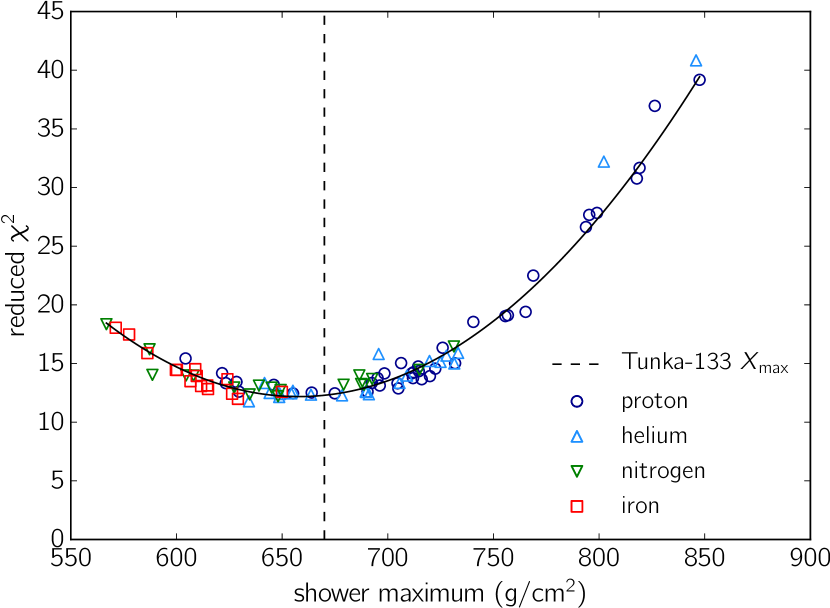
An example of a single fit is given in Fig. 3, and the distribution for this event is shown in Fig. 4.
V Event selection and efficiency cuts
To reconstruct the flux and mean depth of shower maximum of primary cosmic rays one has to take into account the efficiency of detection. There are different ways to estimate this, for example based on simulations as used by LOFAR Buitink et al. (2016). We developed our own, simple model based on Monte-Carlo simulations of air-shower footprints, a detailed description of which is given in Ref. O. Fedorov et al. (2017) (Tunka-Rex Collaboration). The idea behind this model is to estimate the probability of detection of an air shower with particular energy and direction (this way we do not neglect the azimuth of arrival since it impacts the geomagnetic and charge-excess effects) with a random shower core location inside the effective detection area. The efficiency is calculated as the fraction of showers detected inside the detector area, a circle with radius around the center of the array. The detection criterium selected for this work is to have a footprint covering at least four clusters of Tunka-Rex. This criterium guarantees the detection of the air showers with different depths, i.e. minimizes the bias due to nondetection of deep proton showers, for example. We use the following cut: 90% efficiency of detection of air-showers which produce footprints with size of m (depending on shower inclination; footprints have the shape either of a circle or of an ellipse. In case of an ellipse, corresponds to the minor axis) within the area of m around the center of the antenna array.
To validate this model we performed the following: for each generation of the Tunka-Rex array we predict the expected number of detected events with 90% efficiency using the information (energy, arrival direction and core position) from Tunka-133 (assuming that Tunka-133 features full efficiency, which is valid at these energies) and compared these numbers with events detected and reconstructed by Tunka-Rex. The comparison is given in Table 1. From this table, one can see that the number of detected events are in agreement with the number of predicted ones within the pre-defined efficiency of detection. Since the number of missed events is small all of them were revised manually and it was found that the core positions of these events are located within the 10% of “blind” parts of the detector, as predicted by the efficiency model. This is especially true for the generation 1a of the array, where the structure is more irregular due to absence of antennas in two clusters (see Fig. 2, left). The efficiency of 94% determined by the cross-check is consistent with the cut condition of %.
| Gen. | Years | Number of | Expected | Detected | Efficiency |
|---|---|---|---|---|---|
| antennas | events | events | |||
| 1a | 2012/13 | 18 | 23 | 20 | |
| 1b | 2013/14 | 25 | 28 | 27 | |
| 2 | 2015/16 | 44 | 14 | 14 | |
| 3 | 2016/17 | 63 | 17 | 16 | |
| Total | 82 | 77 |
VI Quality of reconstruction
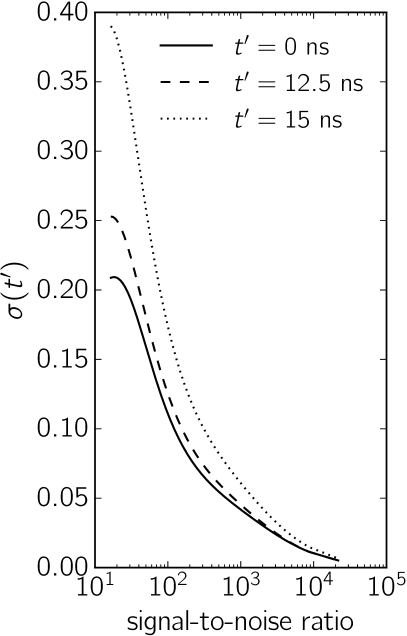
To derive the quality and precision of the Tunka-Rex reconstruction we cross-check it with the Tunka-133 reconstruction. Estimating the Tunka-133 resolution for the energy and shower maximum as approximately 10% and 25 g/cm2, respectively, one can estimate the resolution of Tunka-Rex by analyzing the deviation between the values estimated by the two detectors. For the events presented in Table 1, the average energy resolution of Tunka-Rex is about 10% (here it is worth noting that since both detectors reconstruct the energy via the electromagnetic component, an additional uncertainty caused by mass composition is compensated). As was shown before Kostunin et al. (2017b) the sensitivity to the shower maximum increases with the size of the radio footprint of the air-shower. With the increased number of antenna stations and sufficient number of events we studied the dependency of the resolution on the primary energy (which impacts the number of antennas per events and size of the air-shower footprint), and found that we can achieve a resolution similar to the resolution of Tunka-133 (and other optical detectors), for energies above eV. At these energies the air-shower footprint of the typical event has a radius of about 450 m in our zenith angle range . Referring to LOFAR results, one can state that the number of antenna stations is the more important factor than the size of the footprint. In the present work it is hard to judge whether the increased density of Tunka-Rex antenna stations significantly improves the reconstruction, since the array with tripled density has not acquired sufficient data yet and only Tunka-133 triggered events are fully analyzed. In Table 2 one can see the comparison of shower maximum resolutions of Tunka-Rex achieved at different energy cuts. These values are in agreement with a mean uncertainty of g/cm2 given by the chi-square fit.
It is important to note that after the commissioning of new gamma instruments in the Tunka Valley, the maintenance and upgrades of Tunka-133 were less regular, and the present data analysis finishes in 2016. The analysis of the latest data is not included in the Tunka-133 spectra and mass composition, i.e. the energy and values provided for the Tunka-Rex cross-check are preliminary and might change in the future. Although the reconstruction of Tunka-Rex is valid for 2016/17 and later, the cross-calibration of this season against Tunka-133 is not performed in this paper.
| (eV) | (m) | /event | (g/cm2) |
|---|---|---|---|
| 5 | |||
| – | 6 | ||
| 7 |
VII Discussion and conclusion
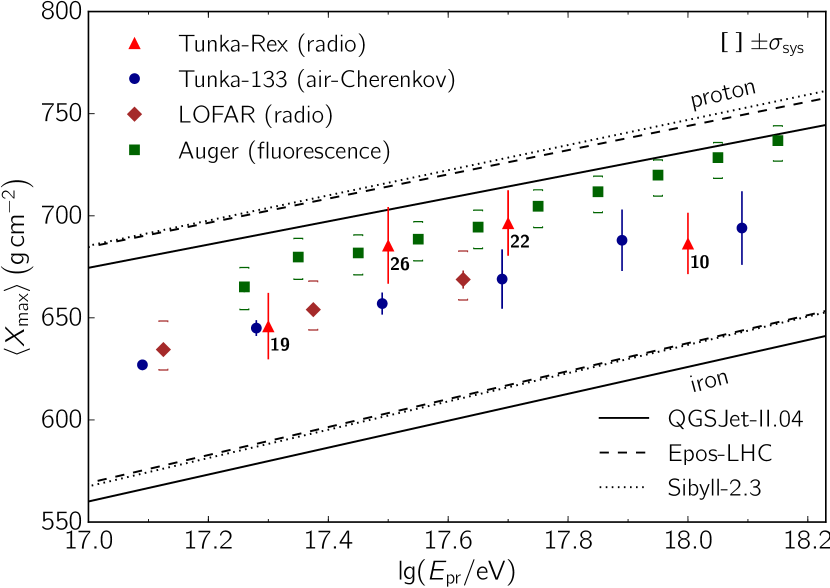
As another check of the air-shower reconstruction in combination with the efficiency model we produced the distribution of the mean depth of the reconstructed shower maxima as a function of the primary energy. The results are presented in Fig. 5. One can see that the Tunka-Rex results are in agreement with other experiments. The points presented in this plot are obtained with three different techniques: air-Cherenkov, fluorescence and radio. The good agreement between the three techniques shows the progress in the understanding of air-shower phenomena and systematics of experiments exploiting these techniques.
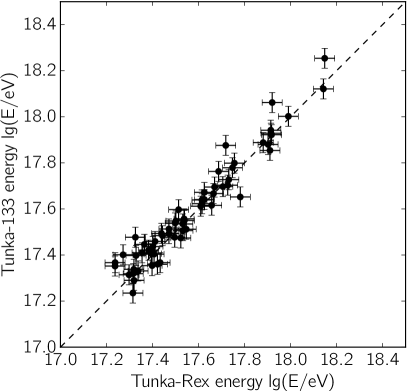
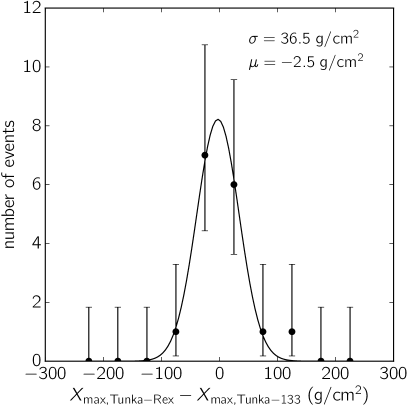
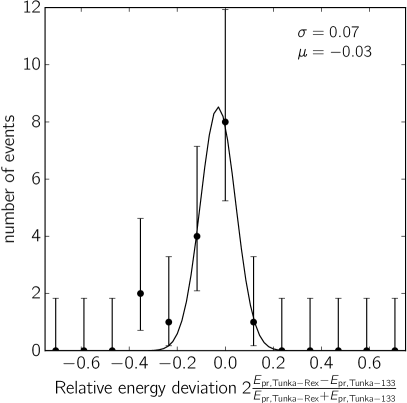
We made a more detailed comparison with the Tunka-133 reconstruction on a large data set from 2012-2015 and found that Tunka-Rex shows mean shifts against Tunka-133 of % and g/cm2 for energy and shower maximum (depending on energy, see Fig. 11). This can be explained by unaccounted systematics due to degradation of the Tunka-133 optical system and different methods of reconstruction (earlier Tunka-Rex used an LDF method Kostunin et al. (2016); P.A. Bezyazeekov, et al. - Tunka-Rex Coll. (2016) which is very similar to the one used by Tunka-133).
An unaccounted systematic uncertainty is given by the variation of the refractive index of air. It was shown that the atmosphere can introduce a bias up to 11 g/cm2 for MHz radio emission Corstanje et al. (2017). Probably this effect is mostly compensated for the relative comparison of Tunka-Rex and Tunka-133, but can impact the absolute value of the shower maximum. Since the software used in Ref. Corstanje et al. (2017) was implemented in the CORSIKA/CoREAS packages after we performed our analysis we provide only a rough estimation of systematic uncertainty introduced by the refractivity of the atmosphere in the present paper. Using GDAS (Global Data Assimilation System) 333National Oceanic and Atmospheric Administration, https://www.ncdc.noaa.gov/data-access/model-data/model-datasets/global-data-assimilation-system-gdas profiles for each detected event and formulas from Ref. Corstanje et al. (2017) the expected uncertainty is about 3 g/cm2 (event-to-event fluctuation of the refractivity is about 2%) with a possible shift up to 5 g/cm2 towards deeper shower maxima (on average GDAS refractivity is 5% higher than CORSIKA standard one). These small-scale deviations are determined by the operation conditions of the Tunka-133 detector: dry and cold atmosphere with almost constant temperature.
The main results of this work can be summarized as follows:
-
•
The simple efficiency model developed for Tunka-Rex shows good agreement with measurements.
-
•
Using a simulation-based approach and pulse shape information the resolution of the Tunka-Rex reconstruction was significantly increased for both the energy and shower maximum.
-
•
With the improved analysis method the radio measurements reach a resolution comparable to optical detectors; where radio has the intrinsic advantage of a higher duty cycle.
There are still a number of improvements which can be implemented. First, reducing the systematic uncertainty by taking realistic atmospheric conditions into account. Second, improving the understanding of the phase response in order to use the shape of the signal itself and not just the envelope. There is an order of magnitude larger amount of data acquired jointly with Tunka-Grande during daytime measurements. On the one hand, analysis of these data requires a slightly different approach, on the other the data also contain information regarding the muonic component of air-showers which can dramatically improve the reconstruction of the primary mass. This amount of data would be sufficient for a precise reconstruction of the flux of ultra-high energy cosmic rays, i.e. the energy spectrum.
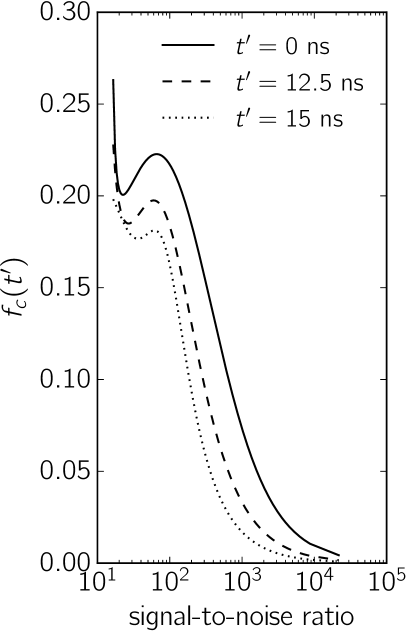
Appendix A Signal uncertainty due to noise and its adjustment
As one can see from Fig. 1 the signal envelopes can be considered symmetric, i.e. we assume . For simplicity both the signal uncertainty and the correction term are parametrized as a sum of two Lorentzian-like functions:
| (4) | |||
| (5) |
The parameters , , are obtained from the simulations after adding the measured noise samples from the Tunka-Rex noise library. The behavior of the and functions is depicted in Fig 6.
Appendix B Comparison of handronic models
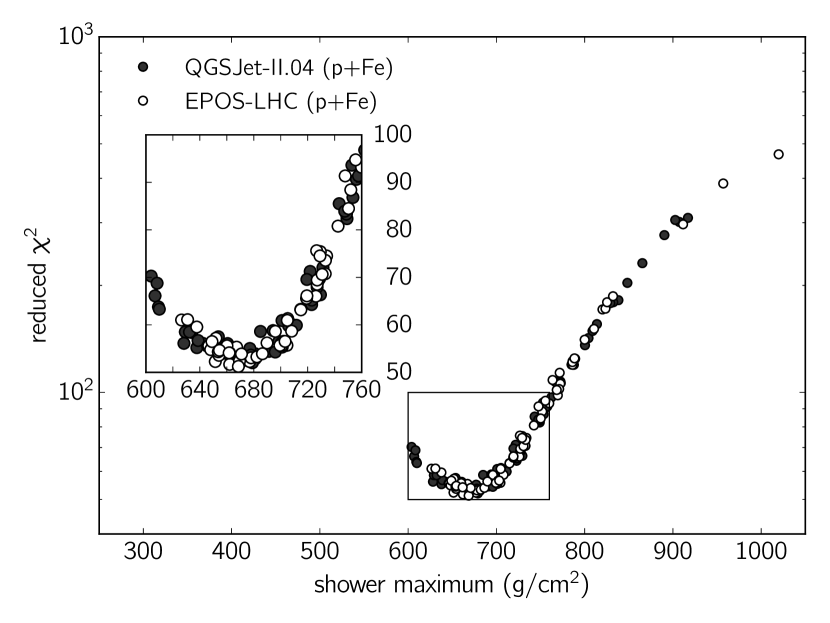
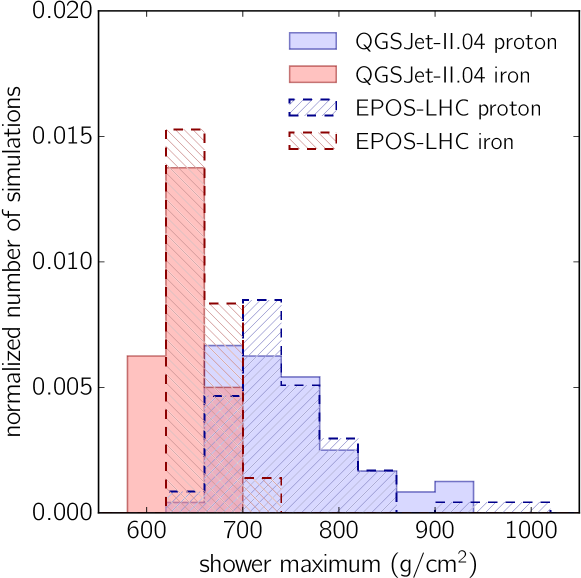
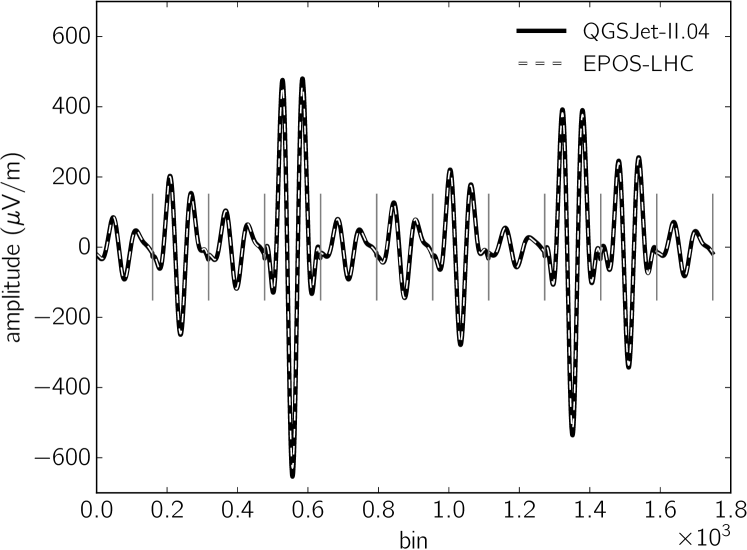
The selection of the hadronic model does not play a significant role in our analysis. The physical explanation of this is the manner of generation of the electromagnetic component of the air shower. The primary contribution comes from the production and immediate decay (due to short mean life) of neutral pions, which is calculated similarly by all models (the difference in pion production important for the muon number does not significantly impact radio emission, since fraction of muons in the total number of charged particles less than percent). To explicitly show this in the frame of our reconstruction we give an example of the chi-square distribution for an example event reconstructed by QGSJet-II.04 Ostapchenko (2011) and EPOS-LHC models Pierog and Werner (2008). One can see in Figs. 7 and 8 that although both models provide different distributions of shower maxima the chi-square distributions fitted to them are lying in the same parabola. In Fig. 9 one can see that electric fields produced by QGSJet-II.04 and EPOS-LHC for similar events (same primary particle, energy and similar shower maxima) are in very good agreement.
As has already been shown in Ref. Buitink et al. (2014), the difference in reconstruction of shower maxima obtained by different hadronic models is negligible. Here we add that this difference might appear due to statistical fluctuations which are reflected in the chi-square fit, and might vanish with a sufficient number of simulations.
Appendix C Cross-check with Tunka-133
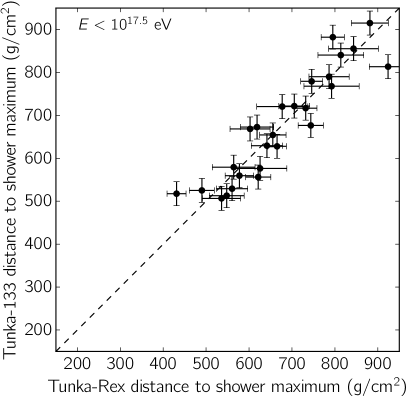
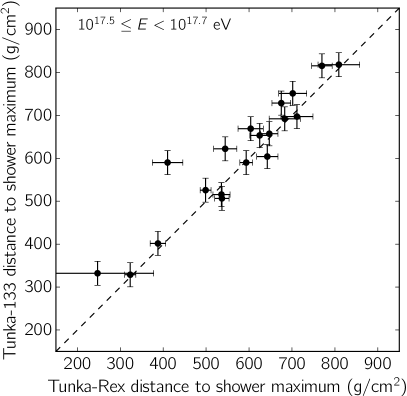
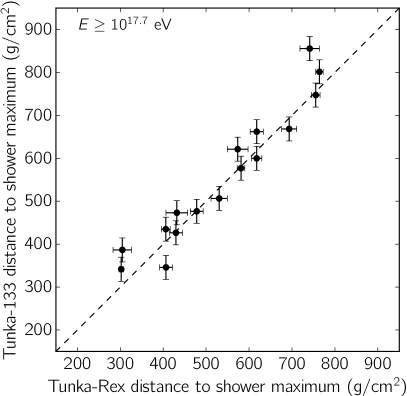
Here we provide plots (Figs. 10, 11) showing the comparison between Tunka-133 and Tunka-Rex as a function of energy. We divided all data sets into three energy bins (as in Table 2) with approximately equal numbers of events (about 20) in each bin. The last season (2016/17) has been omitted from the cross-check due to the lack of calibration of Tunka-133.
eV
eV
eV
Appendix D Distribution of selected events
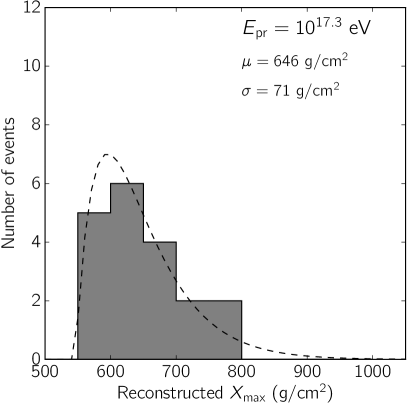
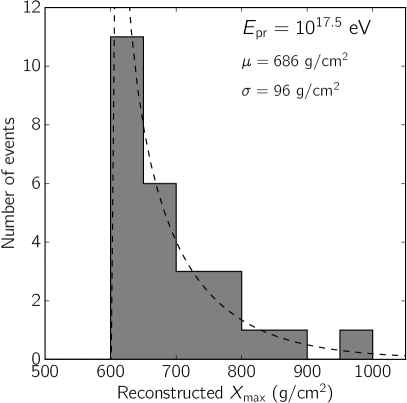
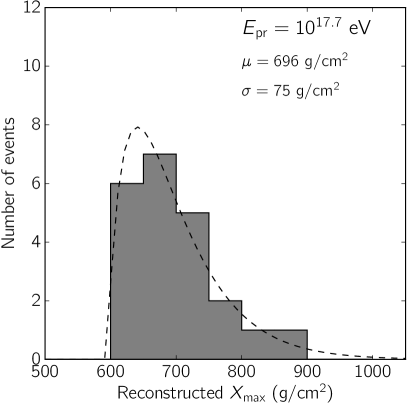
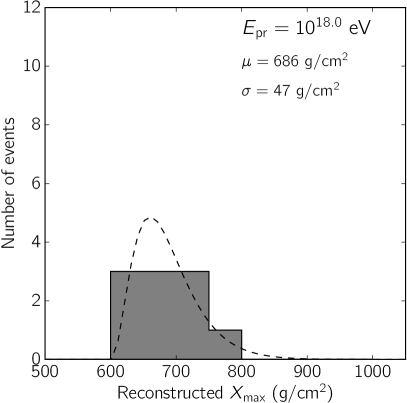
Here we provide the detailed distributions of presented in Fig. 5. Since these distributions can be described as convolutions similar to a gamma distribution Belov (2006), we fit experimental points with a gamma distribution and derive the mean and standard deviation from the fit. These values converge to the arithmetic mean and standard deviation (used by other experiments) for large numbers. The distribution of events as a function of primary energy is given in Fig. 12. The values and uncertainties of the Tunka-Rex points are given in Table. 3.
| # of events | ||
|---|---|---|
| 17.3 | 19 | |
| 17.5 | 26 | |
| 17.7 | 22 | |
| 18.0 | 10 |
Acknowledgements.
The construction of Tunka-Rex was funded by the German Helmholtz association and the Russian Foundation for Basic Research (Grant No. HRJRG-303). This work has been supported by the Helmholtz Alliance for Astroparticle Physics (HAP), the Deutsche Forschungsgemeinschaft (DFG Grant No. SCHR 1480/1-1), the Russian Federation Ministry of Education and Science (Tunka shared core facilities, unique identifier RFMEFI59317X0005, 3.9678.2017/8.9, 3.904.2017/4.6, 3.6787.2017/7.8, 3.6790.2017/7.8), the Russian Foundation for Basic Research (Grants No. 16-02-00738, No. 17-02-00905) and the Grant No. 15-12-20022 of the Russian Science Foundation (sections III and V). In preparation of this work we used calculations performed on the HPC-cluster “Academician V.M. Matrosov” Irkutsk Supercomputer Center of SB RAS and on the computational resource ForHLR II funded by the Ministry of Science, Research and the Arts Baden-Württemberg and DFG (“Deutsche Forschungsgemeinschaft”). A part of the data analysis was performed using the radio extension of the Offline framework developed by the Pierre Auger Collaboration Abreu et al. (2011). We thank David Butler for the proofreading of the present paper.References
- D. Ivanov for the Pierre Auger Collaboration and the Telescope Array collaboration (2017) D. Ivanov for the Pierre Auger Collaboration and the Telescope Array collaboration, ICRC2017 proceedings , PoS (ICRC 2017) 498 (2017).
- V. De Souza for the Pierre Auger Collaboration and the Telescope Array collaboration (2017) V. De Souza for the Pierre Auger Collaboration and the Telescope Array collaboration, ICRC2017 proceedings , PoS (ICRC 2017) 522 (2017).
- Huege (2016) T. Huege, Phys. Rept. 620, 1 (2016), arXiv:1601.07426 [astro-ph.IM] .
- F. G. Schröder (2017) F. G. Schröder, Prog. Part. Nucl. Phys. 93, 1 (2017), arXiv:1607.08781 [astro-ph.IM] .
- P.A. Bezyazeekov, et al. - Tunka-Rex Coll. (2016) P.A. Bezyazeekov, et al. - Tunka-Rex Coll., JCAP 01, 052 (2016).
- Buitink et al. (2014) S. Buitink et al., Phys. Rev. D90, 082003 (2014).
- Balagopal V. et al. (2018) A. Balagopal V., A. Haungs, T. Huege, and F. G. Schröder, Eur. Phys. J. C78, 111 (2018), arXiv:1712.09042 [astro-ph.IM] .
- Martineau-Huynh et al. (2017) O. Martineau-Huynh et al., Proceedings, 7th international workshop on Acoustic and Radio EeV Neutrino Detection Activities (ARENA 2016): Groningen, The Netherlands, June 7-10, 2016, EPJ Web Conf. 135, 02001 (2017), arXiv:1702.01395 [astro-ph.IM] .
- Huege et al. (2013) T. Huege, M. Ludwig, and C. James, AIP Conf.Proc. 1535, 128 (2013), arXiv:1301.2132 [astro-ph.HE] .
- Prosin et al. (2016) V. V. Prosin et al., Proceedings, 14th International Conference on Topics in Astroparticle and Underground Physics (TAUP 2015): Torino, Italy, September 7-11, 2015, J. Phys. Conf. Ser. 718, 052031 (2016).
- Budnev et al. (2017) N. Budnev et al., Proceedings, International Conference on Instrumentation for Colliding Beam Physics (INSTR17): Novosibirsk, Russia, JINST 12, C08018 (2017).
- Abreu et al. (2012) P. Abreu et al. (Pierre Auger), JINST 7, P10011 (2012), arXiv:1209.3840 [astro-ph.IM] .
- P.A. Bezyazeekov, et al. - Tunka-Rex Coll. (2015) P.A. Bezyazeekov, et al. - Tunka-Rex Coll., Nucl. Inst. Meth. A 802, 89 (2015).
- Kostunin et al. (2017a) D. Kostunin et al. (Tunka-Rex), in Proceedings, 19th International Symposium on Very High Energy Cosmic Ray Interactions (ISVHECRI 2016): Moscow, Russia, August 22-27, 2016, Vol. 145 (2017) p. 11001, arXiv:1701.07165 [astro-ph.IM] .
- Burke and Poggio (1977) G. Burke and A. Poggio, NEC - NUMERICAL ELECTROMAGNETICS CODE FOR ANTENNAS AND SCATTERING, Tech. Rep. (Lawrence Livermore National Laboratory, Livermore U.S.A., 1977).
- Apel et al. (2016a) W. D. Apel et al. (LOPES), Astropart. Phys. 75, 72 (2016a), arXiv:1507.07389 [astro-ph.HE] .
- Apel et al. (2016b) W. D. Apel et al. (Tunka-Rex, LOPES), Phys. Lett. B763, 179 (2016b).
- D. Kostunin et al. (2017) (Tunka-Rex Collaboration) D. Kostunin et al. (Tunka-Rex Collaboration), in ICRC2017 proceedings (2017) p. PoS (ICRC 2017) 400.
- Kostunin et al. (2016) D. Kostunin et al., Astropart. Phys. 74, 79 (2016).
- Apel et al. (2014) W. Apel et al. (LOPES), JCAP 1409, 025 (2014), arXiv:1404.3283 [hep-ex] .
- Note (1) This component can be included in the analysis of very-high SNR events, however the expected improvement in the resolution of the shower maximum is estimated to less than 1 g/cm2.
- Allan et al. (1970) H. R. Allan, R. W. Clay, and J. K. Jones, Nature 225, 253 (1970).
- Schröder et al. (2012) F. Schröder et al. (LOPES), NIM A 662, Supplement 1, S238 (2012), proc. of ARENA 2012.
- Note (2) The simulations and corresponding documentation will be published at tunka.astroparticle.online in the frame of Russian-German Data Life Cycle Initiative.
- Heck et al. (1998) D. Heck et al., CORSIKA: A Monte Carlo Code to Simulate Extensive Air Showers, FZKA Report 6019 (Forschungszentrum Karlsruhe, 1998).
- Ostapchenko (2011) S. Ostapchenko, Phys.Rev. D83, 014018 (2011), arXiv:1010.1869 [hep-ph] .
- Buitink et al. (2016) S. Buitink et al. (LOFAR), Nature 531, 70 (2016), arXiv:1603.01594 [astro-ph.HE] .
- O. Fedorov et al. (2017) (Tunka-Rex Collaboration) O. Fedorov et al. (Tunka-Rex Collaboration), in ICRC2017 proceedings, Vol. ICRC2017 (2017) p. PoS (ICRC 2017) 387, 1712.00974 .
- Kostunin et al. (2017b) D. Kostunin et al. (Tunka-Rex), Proceedings, 7th international workshop on Acoustic and Radio EeV Neutrino Detection Activities (ARENA 2016): Groningen, The Netherlands, June 7-10, 2016, EPJ Web Conf. 135, 01005 (2017b), arXiv:1611.09127 [astro-ph.IM] .
- Corstanje et al. (2017) A. Corstanje et al. (LOFAR), Astropart. Phys. 89, 23 (2017), arXiv:1701.07338 [astro-ph.HE] .
- Note (3) National Oceanic and Atmospheric Administration, https://www.ncdc.noaa.gov/data-access/model-data/model-datasets/global-data-assimilation-system-gdas.
- Bellido (2017) J. Bellido (Pierre Auger), in The Pierre Auger Observatory: Contributions to the 35th International Cosmic Ray Conference (ICRC 2017) (2017) pp. 40–47, poS (2017) 506.
- Pierog and Werner (2008) T. Pierog and K. Werner, Phys. Rev. Lett. 101, 171101 (2008), arXiv:astro-ph/0611311 [astro-ph] .
- Riehn et al. (2016) F. Riehn, R. Engel, A. Fedynitch, T. K. Gaisser, and T. Stanev, Proceedings, 34th International Cosmic Ray Conference (ICRC 2015): The Hague, The Netherlands, July 30-August 6, 2015, PoS ICRC2015, 558 (2016), arXiv:1510.00568 [hep-ph] .
- Belov (2006) K. Belov (HiRes), Proceedings, 13th International Symposium on Very High-Energy Cosmic Ray Interactions (ISVHECRI 2004): Pylos, Greece, September 6-12, 2004, Nucl. Phys. Proc. Suppl. 151, 197 (2006).
- (36) Irkutsk Supercomputer Center of SB RAS, http://hpc.icc.ru .
- Abreu et al. (2011) P. Abreu et al. (Pierre Auger), Nucl.Instrum.Meth. A635, 92 (2011), arXiv:1101.4473 [astro-ph.IM] .