A turnover in the radio light curve of GW170817
Abstract
We present 2–9 GHz radio observations of GW170817 (catalog ) covering the period 125–200 days post-merger, taken with the Australia Telescope Compact Array and the Karl G. Jansky Very Large Array. Our observations demonstrate that the radio afterglow peaked at days post-merger and is now declining in flux density. We see no evidence for evolution in the radio-only spectral index, which remains consistent with optically-thin synchrotron emission connecting the radio, optical, and X-ray regimes. The peak implies a total energy in the synchrotron-emitting component of a erg. The temporal decay rate is most consistent with mildly- or non-relativistic material and we do not see evidence for a very energetic off-axis jet, but we cannot distinguish between a lower-energy jet and more isotropic emission.
1 Introduction
The neutron star merger GW170817 (catalog ) was detected via the concurrent observation of gravitational waves (Abbott et al., 2017a) and a -ray burst (GRB; Abbott et al., 2017b; Goldstein et al., 2017). The merger was localized to its host galaxy, NGC 4993 (catalog ), by the detection of an optical transient (Arcavi et al., 2017; Abbott et al., 2017c; Coulter et al., 2017; Lipunov et al., 2017; Soares-Santos et al., 2017; Tanvir et al., 2017; Valenti et al., 2017) and subsequent ultraviolet, optical and infrared observations found evidence of kilonova emission from the source (Arcavi et al., 2017; Cowperthwaite et al., 2017; Drout et al., 2017; Evans et al., 2017; Kasliwal et al., 2017). X-ray observations found no evidence of emission until nine days post-merger (Haggard et al., 2017; Evans et al., 2017; Margutti et al., 2017; Troja et al., 2017), suggesting that this event differs significantly from previously-observed GRBs.
Radio emission from GW170817 (catalog ) was first detected 16 days post-merger (Hallinan et al., 2017). Follow-up observations over the next 100 days (Alexander et al., 2017; Margutti et al., 2018; Mooley et al., 2018; Troja et al., 2018) revealed a gradually rising light curve. The observed radio emission follows a power-law with temporal index and spectral index , where (Mooley et al., 2018). The observed radio spectral energy distribution agrees with the spectral index connecting contemporaneous radio, optical, and X-ray measurements, implying a common source for the observed synchrotron emission (Levan et al., 2017; Mooley et al., 2017; Margutti et al., 2018; Mooley et al., 2018; Troja & Piro, 2018).
The late turn-on of the X-ray and radio emission from GW170817 (catalog ) is not consistent with emission produced via an on-axis relativistic jet (Alexander et al., 2017; Haggard et al., 2017; Hallinan et al., 2017; Margutti et al., 2017; Troja et al., 2017). Moreover, the gradual rise of the radio light curve rules out prompt -ray emission originating from a jet with a “top-hat” azimuthal density profile observed off-axis, which would have produced a much steeper peak and decline than observed (Granot et al., 2002; Nakar et al., 2002). Instead, the light curve is consistent with mildly relativistic quasi-spherical outflow called a “cocoon” (Hallinan et al., 2017; Gottlieb et al., 2018; Mooley et al., 2018; Nakar & Piran, 2018) which may have some contribution from an embedded relativistic jet observed off-axis (some versions of which are also referred to as a “structured jet”; Lazzati et al., 2017; D’Avanzo et al., 2018; Margutti et al., 2018; Resmi et al., 2018).
Based on the data available in the literature to date, it is not possible to establish whether or not a successful jet is present within the cocoon, as these scenarios exhibit similar behavior in the early stages of the afterglow evolution; or to determine the energy of the cocoon itself (see Figure 5 of Margutti et al., 2018). The timescale of the peak flux density and the rate of decline afterwards can constrain the total energy of the outflow and the properties of a successful jet (if present). If the jet did not successfully break out of the cocoon (referred to as a “choked” jet) the observed emission is dominated by the quasi-spherical outflow (cocoon or dynamical ejecta; Gottlieb et al., 2018) and the light curve will continue to rise; if the jet is successful (structured jet; Margutti et al., 2018; Nakar & Piran, 2018) the light curve peaks sooner and declines more rapidly. In either case identifying when and how the light curve peaks also allows calorimetry of the cocoon emission (much as was done by Frail et al. 2000; Berger et al. 2004 for long GRBs).
To date, X-ray observations provide conflicting evidence as to whether the afterglow has peaked. XMM-Newton observations 135 days post-merger suggest the afterglow may have flattened (D’Avanzo et al., 2018), but Chandra observations show a continued rise or slow turnover at about 150 days post-merger (Haggard et al., 2018; Troja & Piro, 2018; Margutti et al., 2018). A decreasing X-ray brightness would imply that either the synchrotron cooling frequency has shifted below the X-ray band (expected on timescales of 100–1000 days post-merger) and the spectrum of the source has evolved, or the light curve of the source from the radio to X-rays has peaked, but current data are not definitive that any change in the X-ray light curve has occurred.
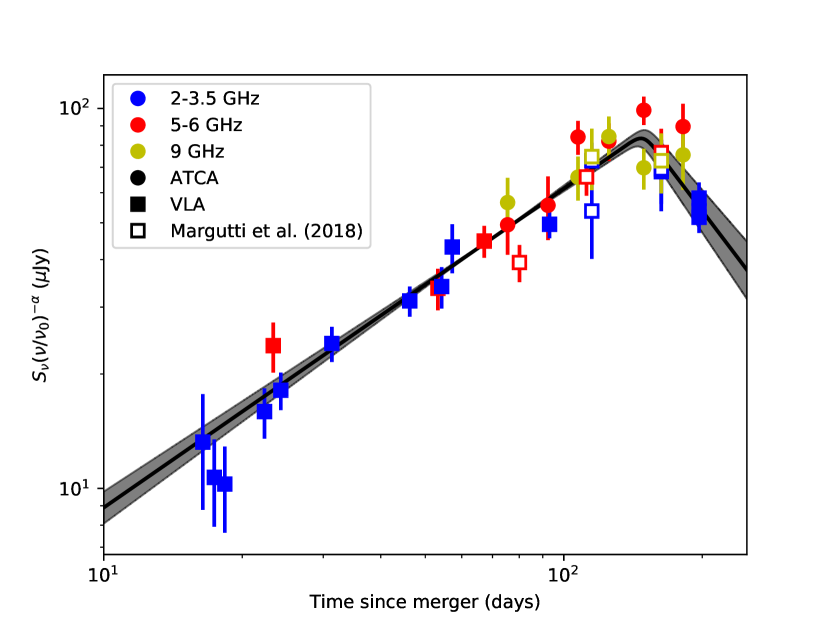
We present further radio observations of GW170817 (catalog ) using the the Australia Telescope Compact Array (ATCA) and the Karl G. Jansky Very Large Array (VLA), covering the period 125–200 days post-merger. These observations demonstrate (Figure 1) that the radio afterglow has peaked at days post-merger and is now declining in flux density.
2 Observations and Data reduction
| UT date | T | Telescope | Bandwidth | Beam Size | ||
|---|---|---|---|---|---|---|
| (d) | (GHz) | (GHz) | (arcsec) | (Jy) | ||
| 2017 Dec 20.83 | 125.30 | ATCAaaWith the 6C configuration (maximum baselines of 6 km) and program CX391 (PI: T. Murphy). | 5.5 | 2.048 | 5.81.5 | 82.0 9.3 |
| 9.0 | 2.048 | 3.61.0 | 63.7 8.2 | |||
| 2018 Jan 13.79 | 149.26 | ATCAaaWith the 6C configuration (maximum baselines of 6 km) and program CX391 (PI: T. Murphy). | 5.5 | 2.048 | 5.41.5 | 98.9 8.5 |
| 9.0 | 2.048 | 3.31.0 | 52.7 6.5 | |||
| 2018 Feb 01.74 | 168.21 | ATCAbbWith the 750A configuration (maximum baseline of 3.75 km) and program CX394 (PI: E. Troja). | 5.5 | 2.048 | ccInsufficient data quality | |
| 9.0 | 2.048 | ccInsufficient data quality | ||||
| 2018 Feb 15.17 | 181.64 | ATCAddWith the 750B configuration (maximum baseline of 4.5 km) and program CX394 (PI: E. Troja). | 5.5 | 2.048 | 4.41.1 | 89.6 13.3 |
| 9.0 | 2.048 | 2.60.7 | 57.0 10.9 | |||
| 2018 Mar 02.32 | 196.79 | VLAeeWith the A configuration (maximum baseline of 27 km) under a Director Discretionary Time program (VLA/17B-397; PI: K. Mooley). | 2.5 | 1 | 1.30.5 | 91.0 9.1 |
| 3.5 | 1 | 1.30.5 | 66.9 6.1 |
2.1 ATCA
We observed GW170817 (catalog ) on 2017 December 20 and 2018 January 13 UT with the ATCA (PI: Murphy). Further observations of GW170817 (catalog ) with the ATCA were obtained on 2018 February 01 and 15 UT (PI: Troja); see Table 1 for details. The February 01 observation only had 4 out of 6 antennas available and after removing short baselines due to the compact configuration, the data quality was insufficient to make a meaningful measurement and the observation was discarded. We determined the flux scale and bandpass response for all epochs using the ATCA primary calibrator PKS B1934638 (catalog PKS B1934-638). Observations of PKS B1245197 (catalog PKS B1245-197) were used to calibrate the complex gains during the December and January observing epochs, while PKS B1244255 (catalog PKS B1244-255) was used in the February observation. All observations used two bands of 2048 MHz centered at 5.5 and 9.0 GHz.
We reduced the visibility data using standard MIRIAD (Sault et al., 1995) routines. The calibrated visibility data were split into the 5.5 and 9.0 GHz bands, averaged to 32 MHz channels, and imported into DIFMAP (Shepherd, 1997). Bright field sources were modeled separately for each band using the visibility data and a combination of point-source and Gaussian components with power-law spectra. After subtracting the modeled field sources from the visibility data, GW170817 (catalog ) dominates the residual image. Restored naturally-weighted images for each band were generated by convolving the restoring beam and modeled components, adding the residual map and averaging to form a wide-band image. Image-based Gaussian fitting with unconstrained flux density and source position was performed in the region near GW170817 (catalog ). The resulting source position agrees with the position of GW170817 (catalog ) observed by the Hubble Space Telescope (HST, Adams et al., 2017).
To examine the stability of the absolute flux calibration from epoch to epoch we measured the flux density of the phase calibrator (PKS B1245197) and a compact reference source in the GW170817 (catalog ) field (RA, Dec, from GW170817 (catalog )) in each epoch and frequency band of the ATCA data. We do not use the host galaxy NGC 4993 (catalog ) as it is extended. We find that the mean and standard deviation of the phase calibrator flux density is Jy and Jy at 5.5 GHz and 9 GHz, respectively. This compares to within with the values reported by the ATNF Calibrator Database111http://www.narrabri.atnf.csiro.au/calibrators/. The reference source is three orders of magnitude fainter than the phase calibrator but is a factor of at least three brighter than GW170817 (catalog ) and is within the same field, so it should provide an accurate indication of the flux density scale within the target field itself. The source is also visible regardless of which phase calibrator is used and so provides an independent test of flux scale stability. Across all epochs, we find that the mean flux density and standard deviation of the reference source flux density is Jy and Jy at 5.5 GHz, and 9.0 GHz, respectively. This suggests that our field flux density measurements are stable to within and at 5.5 GHz and 9.0 GHz, respectively, where those additional uncertainties when added in quadrature to the measurement uncertainties give reduced for the reference source. For GW170817 (catalog ) itself we measured the noise in the vicinity of the source to account for additional contributions from unmodeled sidelobes from the host galaxy NGC 4993 (catalog NGC 4993) and included the additional uncertainties discussed above.
2.2 VLA
VLA observations of the GW170817 (catalog ) field were carried out on 2018 March 02 (Table 1). The Wideband Interferometric Digital Architecture (WIDAR) correlator was used at S band (2–4 GHz) to maximize sensitivity. We used J1248-1959 (catalog ) as the phase calibrator and 3C286 (catalog ) as the flux density and bandpass calibrator. The data were calibrated and flagged for RFI using the NRAO CASA (McMullin et al., 2007) pipeline. We then split and imaged the target data using the CASA tasks split and clean. We made final images by splitting the bandpass into 2 subbands of 1 GHz each.
3 Results and Discussion
3.1 Spectral analysis
We first re-visit the spectral behavior of the radio emission. As in Mooley et al. (2018) we fit a power-law of the form to the first 120 days of the radio light curve (before any sign of a turnover) and find a spectral index and temporal index . This is consistent with Mooley et al. (2018) and with Margutti et al. (2018), who find a joint radio-to-X-ray spectral index at 110 days and at 160 days post-merger.
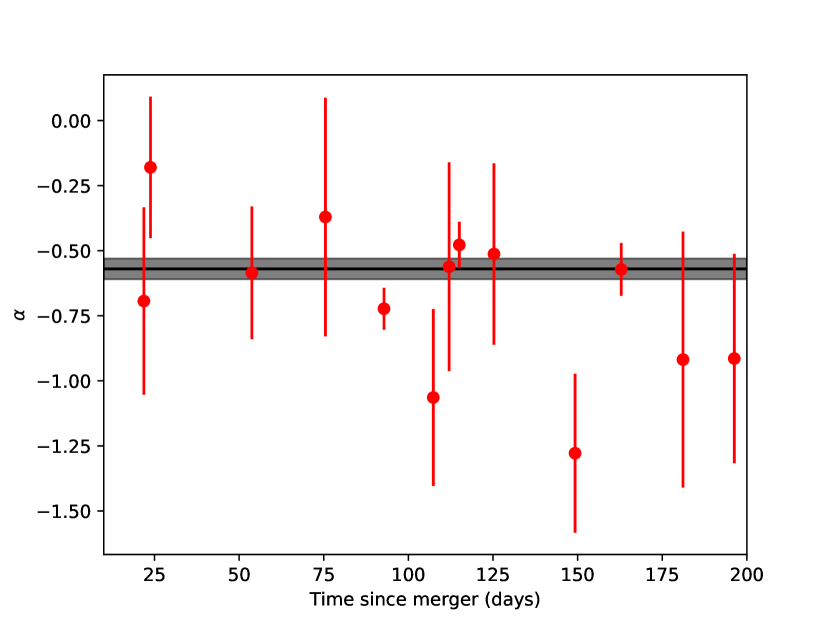
We examined the variability of the spectral behavior using all quasi-simultaneous radio observations. We identified data-sets with more than one observation within day and fit for a spectral index. These values are shown in Figure 2. We find the data largely consistent with a constant spectral index, with for 12 degrees-of-freedom. There appears to be no evidence for significant change in the spectrum of the source, consistent with previous radio, X-ray and HST observations (D’Avanzo et al., 2018; Lyman et al., 2018; Mooley et al., 2018; Margutti et al., 2018; Resmi et al., 2018).
3.2 Light curve analysis
Figure 1 shows the light curve of GW170817 (catalog ) over the 2–9 GHz frequency range from the observations in Table 1 and the literature (Hallinan et al., 2017; Mooley et al., 2018; Margutti et al., 2018), scaling the flux density for each observation to 5.5 GHz based on the spectral index of calculated above. Assuming the light curve initially rises with a temporal index of , peaks days post-merger, and fades with a temporal index of , we fit a smoothed broken power law222http://docs.astropy.org/en/stable/api/astropy.modeling.powerlaws.SmoothlyBrokenPowerLaw1D.html using the Astropy modeling package (The Astropy Collaboration et al., 2018) that behaves as for and for with a smooth transition around . We do not expect to see any variability due to interstellar scintillation, due to the source size (Hallinan et al., 2017).
We have fit the lightcurve allowing the smoothing factor to freely vary and find a minor preference for small smoothing factors down to 0.001, corresponding to a transition of 0.3 days either side of the break. To approximate our observing cadence near the peak of the lightcurve we use a smoothing factor of 0.02 (corresponding to a day transition) which produces no significant changes in fit parameters.
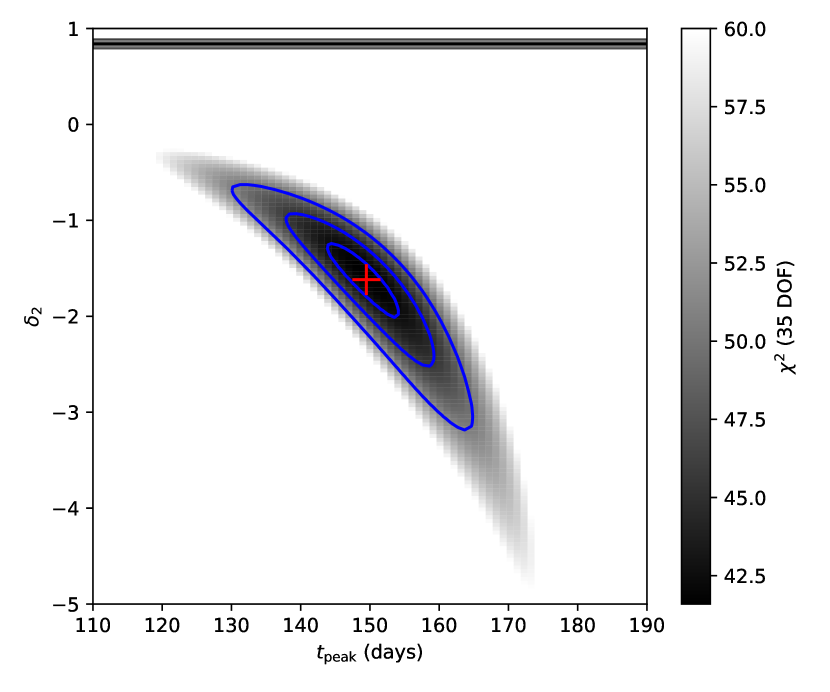
Figure 3 shows the two dimensional joint confidence region as a function of and , where we indicate the best-fit values, and days, and the 90% confidence region. The best fit has for 35 degrees-of-freedom. For a radio light curve that is continuing to rise, the temporal index would remain the same, , which we indicate with the dashed line in Figure 3. Comparing the to the minimum for , we find a change of 380 for one additional parameter and can exclude a light curve that continues to rise at greater than 5 significance using an F-test. We further find a change of of 35 from to the best-fit value , leading to a declining light curve. Preliminary reduction of further observations confirms the observed trend.
3.3 Interpreting the radio light curve
The observed light curve turns over and declines with no evidence for a steep rise coming with an energetically-dominant off-axis jet (Nakar & Piran, 2018), but a weaker jet may still be present. The relatively sharp peak in the radio light curve implies that the energy injection has reduced substantially (or stopped), or that the ejecta has collected mass comparable to its own. The former scenario would be relevant for a successful jet (e.g., Kasliwal et al., 2017; Lazzati et al., 2017; Mooley et al., 2018; Margutti et al., 2018; Troja et al., 2018; D’Avanzo et al., 2018) or a low energy choked-jet cocoon (e.g., Kasliwal et al., 2017; Gottlieb et al., 2017; Piro & Kollmeier, 2018; Mooley et al., 2018), while the latter would be relevant in the case of an isotropic fireball (i.e., dynamical ejecta; Nakar & Piran, 2011; Mooley et al., 2018; D’Avanzo et al., 2018; Hotokezaka et al., 2018).
While no substantial degree of linear polarization would be expected from isotropic dynamical ejecta, in the successful jet model the required asymmetry is built into the jet structure (the energy and speed of the various ejecta components are both functions of the angle from the jet axis; see e.g. Lazzati et al., 2017). Thus, the relevant emitting surface is never completely symmetric for misaligned observers, resulting in an appreciable degree of linear polarization (; Rossi et al., 2004). A detection of significant linear polarization would thus point to a successful jet rather than isotropic dynamical ejecta (also see Gill & Granot, 2018).
The radio light curve can give the energy profile of the ejecta, but it is not sufficient for distinguishing between the contributions from radial and angular structures within the ejecta. Very Long Baseline Interferometry (VLBI) can, however, provide images at sub-milliarcsecond angular resolution, and thus constrain the geometry of the outflow. Distinguishing between the successful-jet, choked-jet cocoon and dynamical ejecta models is thus possible using VLBI observations.
The time of the radio peak is near the observed plateau on the X-ray light curve (Margutti et al., 2018; Troja et al., 2018; Ruan et al., 2018; D’Avanzo et al., 2018), and suggests that the X-rays peaked at the same time as the radio light curve. The turnover in the X-ray (and radio) light curve is therefore dynamical or geometric in origin, and the cooling break has (likely) not entered the X-ray band yet. This is consistent with the interpretation of D’Avanzo et al. (2018) and Margutti et al. (2018) who find that the radio, optical and X-rays lie on the same power-law until day 150 post-merger.
The light curve of a relativistic jet afterglow will decay as , while in the non-relativistic regime the decline will be proportional to , with the exponent on the distribution of electron energies, (Granot et al., 2002; Nakar & Piran, 2011). In the case of GW170817 (catalog ), (e.g. Margutti et al., 2018; Mooley et al., 2018), so the expected decay slopes are and . Our radio data are consistent with expectations for the mildly- or non-relativistic regimes. Based on the time and the flux density at the peak of the radio light curve, we can further calculate the isotropic equivalent energy (Nakar & Piran, 2018) as a few erg for the cocoon scenario (also see Resmi et al. 2018) and a few erg for the dynamical ejecta scenario. Both of those are lower than the isotropic-equivalent kinetic energies found for short GRBs (Fong et al., 2015).
If the peak of the light curve was dominated by an off-axis jet, then (Nakar & Piran, 2018, where the bulk Lorentz factor of the jet is , the off-axis angle of the observer is , and the opening angle of the jet is ) implies that , assuming that material with dominated the on-axis emission at peak. Therefore we can constrain using the viewing angle constraint from LIGO/Virgo (; Abbott et al., 2017a).
Continued radio monitoring will be essential for constraining the decay index. A steep decline in the radio light curve would favor the scenario in which a successful jet broke out of the dynamical ejecta. Transition of the ejecta from the mildly-relativistic to the Newtonian regime would be characterized by deviation from a power-law decay and a change in spectral index, which could be detected with sensitive follow up observations. It is even possible for the ejecta to have angular structures that could cause the light curve to rise again: the early-time kilonova signal in the optical suggested the presence of 0.05 M⊙ material traveling at speeds of 0.1c to 0.3c which should give rise to a radio peak on timescales of a few years (Alexander et al., 2017; Nakar & Piran, 2011, 2018). Finally, the full radio light curve of GW170817 (catalog ) will be crucial for calorimetry, since it will capture all of the energy in the ejecta. The total energy will further shed light into whether GW170817 (catalog ) is a standard short GRB viewed off-axis or it represents a distinct phenomenon.
4 Conclusion
We have presented new ATCA and VLA observations of GW170817 (catalog ) covering the period 125–200 days post-merger. Combined with previous radio observations these data show no evidence for spectral evolution, but they conclusively show that the radio counterpart has peaked in brightness at days post-merger and is currently declining. We use this to rule out emission being caused by highly energetic, quasi-isotropic outflow or highly energetic, highly-relativistic outflow but are not able to uniquely determine the geometry and structure of the actual outflow material. Continued radio monitoring will allow the temporal decay index to be accurately determined, although this may not be sufficient to establish the presence of a successful jet (Nakar & Piran, 2018) and degeneracies in the ejecta total energy and the density of the circum-merger environment may preclude confirmation of any particular model. Polarization measurements and VLBI observations should be able to break this degeneracy and thus distinguish between the models (also see Gill & Granot, 2018).
References
- Abbott et al. (2017a) Abbott, B. P., Abbott, R., Abbott, T. D., et al. 2017a, Physical Review Letters, 119, 161101
- Abbott et al. (2017b) —. 2017b, ApJ, 848, L13
- Abbott et al. (2017c) —. 2017c, ApJ, 848, L12
- Adams et al. (2017) Adams, S. M., et al. 2017, GCN, 21816, 1
- Alexander et al. (2017) Alexander, K. D., Berger, E., Fong, W., et al. 2017, ApJ, 848, L21
- Arcavi et al. (2017) Arcavi, I., Hosseinzadeh, G., Howell, D. A., et al. 2017, Nature, 551, 64
- Berger et al. (2004) Berger, E., Kulkarni, S. R., & Frail, D. A. 2004, ApJ, 612, 966
- Coulter et al. (2017) Coulter, D. A., Foley, R. J., Kilpatrick, C. D., et al. 2017, Science, 358, 1556
- Cowperthwaite et al. (2017) Cowperthwaite, P. S., Berger, E., Villar, V. A., et al. 2017, ApJ, 848, L17
- D’Avanzo et al. (2018) D’Avanzo, P., Campana, S., Ghisellini, G., et al. 2018, ArXiv e-prints, arXiv:1801.06164
- Drout et al. (2017) Drout, M. R., Piro, A. L., Shappee, B. J., et al. 2017, Science, 358, 1570
- Evans et al. (2017) Evans, P. A., Cenko, S. B., Kennea, J. A., et al. 2017, Science, 358, 1565
- Fong et al. (2015) Fong, W., Berger, E., Margutti, R., & Zauderer, B. A. 2015, ApJ, 815, 102
- Frail et al. (2000) Frail, D. A., Waxman, E., & Kulkarni, S. R. 2000, ApJ, 537, 191
- Gill & Granot (2018) Gill, R., & Granot, J. 2018, MNRAS, submitted, arXiv:1803.05892
- Goldstein et al. (2017) Goldstein, A., Veres, P., Burns, E., et al. 2017, ApJ, 848, L14
- Gottlieb et al. (2018) Gottlieb, O., Nakar, E., & Piran, T. 2018, MNRAS, 473, 576
- Gottlieb et al. (2017) Gottlieb, O., Nakar, E., Piran, T., & Hotokezaka, K. 2017, ArXiv e-prints, arXiv:1710.05896
- Granot et al. (2002) Granot, J., Panaitescu, A., Kumar, P., & Woosley, S. E. 2002, ApJ, 570, L61
- Haggard et al. (2018) Haggard, D., Nynka, M., Ruan, J. J., Evans, P., & Kalogera, V. 2018, The Astronomer’s Telegram, 11242
- Haggard et al. (2017) Haggard, D., Nynka, M., Ruan, J. J., et al. 2017, ApJ, 848, L25
- Hallinan et al. (2017) Hallinan, G., Corsi, A., Mooley, K. P., et al. 2017, Science, 358, 1579
- Hotokezaka et al. (2018) Hotokezaka, K., Kiuchi, K., Shibata, M., Nakar, E., & Piran, T. 2018, ArXiv e-prints, arXiv:1803.00599
- Kasliwal et al. (2017) Kasliwal, M. M., Nakar, E., Singer, L. P., et al. 2017, Science, 358, 1559
- Lazzati et al. (2017) Lazzati, D., Perna, R., Morsony, B. J., et al. 2017, ArXiv e-prints, arXiv:1712.03237
- Levan et al. (2017) Levan, A. J., Lyman, J. D., Tanvirand I. Mandel, N. R., et al. 2017, GCN, 22207, 1
- Lipunov et al. (2017) Lipunov, V. M., Gorbovskoy, E., Kornilov, V. G., et al. 2017, ApJ, 850, L1
- Lyman et al. (2018) Lyman, J. D., Lamb, G. P., Levan, A. J., et al. 2018, ArXiv e-prints, arXiv:1801.02669
- Margutti et al. (2017) Margutti, R., Berger, E., Fong, W., et al. 2017, ApJ, 848, L20
- Margutti et al. (2018) Margutti, R., Alexander, K. D., Xie, X., et al. 2018, ArXiv e-prints, arXiv:1801.03531
- McMullin et al. (2007) McMullin, J. P., Waters, B., Schiebel, D., Young, W., & Golap, K. 2007, in Astronomical Society of the Pacific Conference Series, Vol. 376, Astronomical Data Analysis Software and Systems XVI, ed. R. A. Shaw, F. Hill, & D. J. Bell, 127
- Mooley et al. (2017) Mooley, K. P., et al. 2017, GCN, 22211, 1
- Mooley et al. (2018) Mooley, K. P., Nakar, E., Hotokezaka, K., et al. 2018, Nature, 554, 207
- Nakar & Piran (2011) Nakar, E., & Piran, T. 2011, Nature, 478, 82
- Nakar & Piran (2018) —. 2018, ArXiv e-prints, arXiv:1801.09712
- Nakar et al. (2002) Nakar, E., Piran, T., & Granot, J. 2002, ApJ, 579, 699
- Piro & Kollmeier (2018) Piro, A. L., & Kollmeier, J. A. 2018, ApJ, 855, 103
- Resmi et al. (2018) Resmi, L., Schulze, S., Ishwara Chandra, C. H., et al. 2018, ApJ, submitted, arXiv:1803.02768
- Rossi et al. (2004) Rossi, E. M., Lazzati, D., Salmonson, J. D., & Ghisellini, G. 2004, MNRAS, 354, 86
- Ruan et al. (2018) Ruan, J. J., Nynka, M., Haggard, D., Kalogera, V., & Evans, P. 2018, ApJ, 853, L4
- Sault et al. (1995) Sault, R. J., Teuben, P. J., & Wright, M. C. H. 1995, in Astronomical Society of the Pacific Conference Series, Vol. 77, Astronomical Data Analysis Software and Systems IV, ed. R. A. Shaw, H. E. Payne, & J. J. E. Hayes, 433
- Shepherd (1997) Shepherd, M. C. 1997, in Astronomical Society of the Pacific Conference Series, Vol. 125, Astronomical Data Analysis Software and Systems VI, ed. G. Hunt & H. Payne, 77
- Soares-Santos et al. (2017) Soares-Santos, M., Holz, D. E., Annis, J., et al. 2017, ApJ, 848, L16
- Tanvir et al. (2017) Tanvir, N. R., Levan, A. J., González-Fernández, C., et al. 2017, ApJ, 848, L27
- The Astropy Collaboration et al. (2018) The Astropy Collaboration, Price-Whelan, A. M., Sipőcz, B. M., et al. 2018, ArXiv e-prints, arXiv:1801.02634
- Troja & Piro (2018) Troja, E., & Piro, L. 2018, The Astronomer’s Telegram, 11245
- Troja et al. (2017) Troja, E., Piro, L., van Eerten, H., et al. 2017, Nature, 551, 71
- Troja et al. (2018) Troja, E., Piro, L., Ryan, G., et al. 2018, ArXiv e-prints, arXiv:1801.06516
- Valenti et al. (2017) Valenti, S., David, Sand, J., et al. 2017, ApJ, 848, L24