Los Alamos National Laboratory
Los Alamos, NM 87545, USA
Tel.: +1 (505) 695 4100
44email: kkoehler@lanl.gov
K.E. Koehler 55institutetext: M.A. Famiano 66institutetext: T.W. Gorczyca
Western Michigan University
Kalamazoo, MI 49008, USA
D.R. Schmidt 77institutetext: J.N. Ullom
National Institute of Standards and Technology (NIST)
Boulder, CO 80305, USA
First Calorimetric Measurement of Electron Capture in 193Pt with a Transition Edge Sensor
Abstract
The neutrino mass can be extracted from a high statistics, high resolution calorimetric spectrum of electron capture in 163Ho. In order to better understand the shape of the calorimetric electron capture spectrum, a second isotope was measured with a close to ideal absorber-source configuration. 193Pt was created by irradiating a 192Pt-enriched platinum foil in a nuclear reactor. This Pt-in-Pt absorber was designed to have a nearly ideal absorber-source configuration. The measured 193Pt calorimetric electron-capture spectrum provides an independent check on the corresponding theoretical calculations, which have thus far been compared only for 163Ho. The first experimental and theoretically-calculated spectra from this 193Pt-in-Pt absorber are presented and overlaid for preliminary comparison of theory with experiment.
Keywords:
neutrino mass, electron capture, microcalorimeter, superconducting transition-edge sensor1 Introduction
Research to understand the calorimetric measurement of electron capture and beta decay within a low temperature detector is of interest for neutrino science and metrology Nucciotti2016 ; Hassel2016 ; Faverzani2016 ; Croce2016 ; Rotzinger2008 ; Loidl2008 ; Loidl2010 ; Loidl2017 . A neutrino mass measurement from microcalorimeter spectroscopy of electron capture decay in 163Ho requires a large-scale experiment with stringent requirements on statistics and detector resolution and a validated theoretical model of the electron capture spectrum. For example, an experiment with eV FWHM, pulse pile up fraction () of , and a spectrum of decays can reach a eV neutrino mass sensitivity with % confidence level Nucciotti2016 . As a tool for understanding the theoretical shape of calorimetric measurements of electron capture, experimental measurements of 193Pt were made and compared to theoretical calculations. These are the first published results of either experimental measurements or theoretical calculations of the 193Pt calorimetric electron capture spectroscopy.
163Ho with its low value of 2.833 keV is far more desirable for a neutrino mass measurement because the statistics in the endpoint region increase with lower ; however, 193Pt has the next lowest value for electron capture of 56.8 keV and a reasonable half life of 50 years Basunia2017 . Significant work has been done in the field on improving the theoretical calculations for the electron-capture spectrum DeRujula2013 ; Faessler2015-1hole ; Robertson2015_objection ; Faessler2015-2hole ; Faessler2015-3hole ; DeRujula2015 ; DeRujula2016 ; Faessler2016a ; Faessler2017 , but all comparisons to date have been based on 163Ho, with some early work on internal bremsstrahlung electron capture with 193Pt DeRujula1981 ; Jonson1983 . Comparing to another isotope is a valuable check on the universal applicability of these models and ensures that the community does not begin to rely on isotope-specific approximations or empirical scaling, which might bias the neutrino mass results.
A 193Pt-in-Pt absorber was created by neutron-irradiating a 192Pt-enriched foil, to create a source-absorber matrix as close to ideal as possible. This absorber should have no complex matrix structure in the form of additional material from dried deposits Croce2016 or lattice damage from ion implantation (the route pursued by ECHo Gastaldo2014 and HOLMES Alpert2015 for embedding 163Ho in a gold foil). A small piece of the resulting irradiated foil can then be used as the absorber material with minimal additional sample preparation. This source-absorber configuration is ideal because the 193Pt is produced homogeneously within the Pt host and there are no elemental interfaces between the decaying isotope and the surrounding absorber material, which is a high purity metal. The absorber should have a simple metallic behaviour at low temperature. The heat capacity and thermal conductivity are well-understood and the absorber structure is expected to be nearly perfect, with fewer opportunities for energy trapping and a uniform environment for energy deposition and thermalization.
2 Irradiation and Characterizations
A 10 mg sample of 56.9% 192Pt-enriched Pt was irradiated at the 6-MW thermal research reactor at the Massachusetts Institute of Technology for approximately 7 days. The original platinum foil had 675 ppm of total contaminants PtAssay , with the majority being lead (330 ppm) and iron (210 ppm). All other contaminants were ppm. These impurities may contribute extra heat capacity. The platinum foil was placed in a polyethylene tube and sent through the 1PH1 intermediate flux pneumatic tube and irradiated at a thermal power of 5.74 MW for 7 days.
The activity of the created 193Pt was estimated in two ways. In the first method, using a 50-year half life Basunia2017 , a 10 barn cross section111An experimental measurement of the cross section at the single energy of 0.025 eV yielded barns Vertebnyi1975 . for thermal neutron capture on 192Pt, an estimated thermal neutron flux of n/cm2-s, and an irradiation of 7 days, we will produce 43 Bq of 193Pt per of platinum. The second method measured the Pt content by gamma spectroscopy using an HPGe detector, giving a lower bound on 193Pt of 0.75 Bq/. The most active isotope determined through gamma spectroscopy was 192Ir at 18.6 Bq/, despite Ir constituting ppm from an assay of the original foil. The most dominant contaminants apart from 192Ir were 51Cr and 182Ta with specific activities of 0.06 Bq/ and 0.08 Bq/ respectively. These contaminants each have less than a 1-year half-life and will decay away.
3 Theoretical Spectrum
The simplest model of electron capture involves a proton within the nucleus capturing an orbital electron, leaving a single vacancy in the daughter atom. As a result of the vacancy, the daughter is now in an excited atomic state. Embedding this daughter within an absorber allows a calorimetric measurement of all the decay energy except that of the escaping neutrino and potential surface escapes of photons or electrons. The equation describing the calorimetrically-measured electron capture spectrum comes from Fermi’s description of -decay Fermi1934 ; DeRujula1981 ; DeRujula1982 :
| (1) |
The total decay rate is and is the measured calorimetric energy. The neutrino density of states contributes the prefactor before the sum, dependent on the energy released by the reaction () and the neutrino kinematic mass (). is the weak Fermi coupling factor and is the nuclear matrix element. The sum over final states is a sum over all allowed post-nuclear-decay states in the daughter. The weighting of each Lorentzian () depends on both the electron-nucleus interaction and the parent-daughter atomic wavefunction overlap. The hard work is in determining which post-decay states to keep and calculating the weighting factor.
Using antisymmetrized wavefunctions and Faessler’s notation Faessler2015-1hole ; Faessler2015-2hole ; Faessler2015-3hole ; Faessler2016a ; Faessler2017 , can be approximated as:
| (2) |
where is an orbital calculated in the parent nuclear and atomic potential and is an orbital calculated in the daughter nuclear and atomic potential. is the atomic number of the parent atom. represents the electron-nucleus interaction, here described by an orbital wavefunction in the parent evaluated at the nuclear radius, . The simplest approximation which we refer to as the unitary approximation is to assume , so simplifies to .
There are various corrections to this simple model to be explored by comparisons to experimental data. A few of the corrections follow: (1) the daughter state may involve not only a vacancy from an electron capture, but an additional electron (or more) may be promoted to another bound state (shake up) or to the continuum (shake off) Robertson2015_objection ; Faessler2015-2hole ; Faessler2015-3hole ; DeRujula2015 ; DeRujula2016 ; Faessler2016a ; Faessler2017 ; (2) the atomic overlap can be calculated using a product of single-electron wavefunction overlaps as shown in Eq. 2, rather than assuming the unitary approximation; (3) more terms from the fully anti-symmetrized atomic wavefunction can be included, increasing the complexity and accuracy of an atomic overlap calculation. This paper does not address (1), but does show the spectroscopic effects of approximating the atomic overlap as unity versus a calculated atomic overlap (2) and the effects of including more terms in the atomic overlap (3).
| Peak | (eV) | (eV) |
|---|---|---|
| L1 | 13419 | 7.9 |
| L2 | 12824 | 5.23 |
| M1 | 3174 | 14.8 |
| M2 | 2909 | 8.9 |
| N1 | 691.1 | 8 |
| N2 | 577.8 | 6.1 |
| O1 | 95.2 | 5* |
| O2 | 63 | 5* |
| P1 | 1* | 1* |
Allowed captures are governed by conservation of energy and angular momentum, so the higher value for electron capture in 193Pt allows captures from the ns and np1/2 states, where n 2, whereas the lowest states accessible for electron capture in 163Ho are the 3s and 3p1/2. The energies and widths of the 193Pt peaks from Campbell2001 ; CRC are given in Table 1.
The nomenclature describing the calculated spectra is 1H-(N), where 1H denotes a single hole spectrum (no shake-up or shake-off contributions). N describes the number of off-diagonal orbital overlap factors retained in the calculation. In principle, this description indicates which terms are being kept from the overlap of the fully-antisymmetrized atomic wavefunctions, each of which has Z! terms. For example, if only the first term in Eq. 2 is kept, this description is (0) because all orbital overlaps are of type . If all the written terms in Eq. 2 are kept, this description is (1) because we are keeping terms that have one off-diagonal factor, . The unitary approximation described above () is referred to as (0U).
Both 1H-(0U)a and 1H-(0U)b are similar calculations with the only difference coming from the evaluation of the orbital wavefunction at the nucleus. Model “a” uses tabulated values for the orbital Dirac-Fock-Slater (DFS) wavefunctions at Band1986 , whereas Model “b” uses uses orbital wavefunctions from the LANL atomic code suite Fontes2015 evaluated at au, a good approximation for the 193Pt nuclear radius Angeli2013 . The other two models calculated also use orbital wavefunctions from the LANL atomic code suite for use in the atomic overlap calculations. The biggest difference comes from the difference between Model “a” and Model “b”, indicating the sensitivity to the orbital overlap with the nucleus. There are small differences in the predicted peak heights from the 1H-(0U)b, 1H-(0), and 1H-(1) theories. These theoretical curves are all shown in Fig. 1 alongside experimental data.
4 Experimental Calorimetric Spectrum
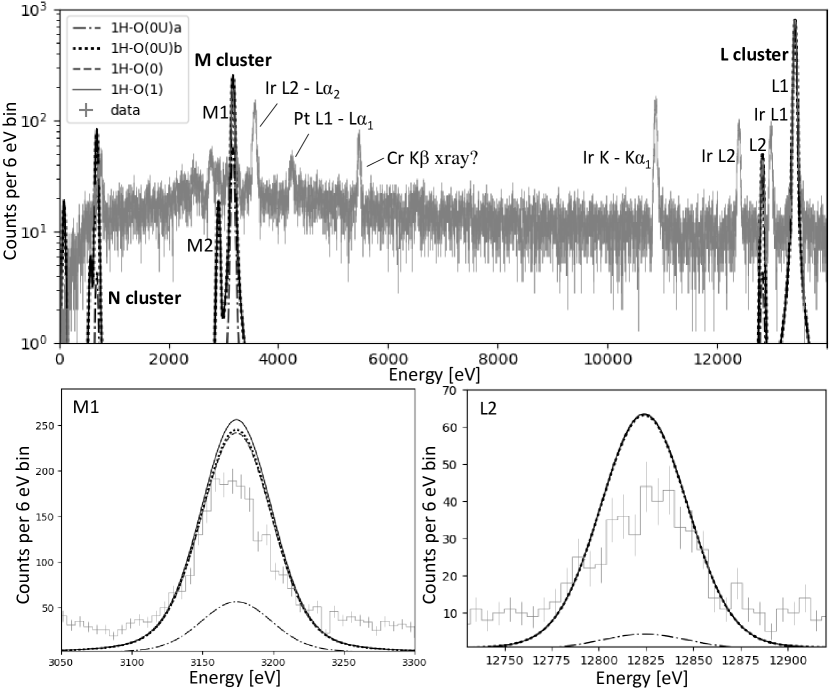
The transition-edge-sensor microcalorimeter is a 350 square Mo-Cu bilayer with a superconducting transition temperature near 110 mK Croce2016 . A small piece ( 3 or 0.04 , estimated from density) from the irradiated foil was hand-cut with a razor and attached to the microcalorimeter detector with an indium bump bond. The preliminary measured spectrum (Fig. 1) employed a linear energy calibration through the origin using the L1 capture peak. Future measurements will use external calibration lines to ascertain the shift in the peaks, since recent discussion has indicated that the energies used should not be just the binding energy of the daughter orbitals, but the energy of the daughter configuration Nucciotti2016 ; Springer1985 ; Robertson2015 . For 163Ho, this amounts to adding the binding energy of the additional electron in the 4f shell. For 193Pt, this is not quite as straightforward because the ground state of Ir and Pt involves a rearrangement of both the 6s and 5d shells. While Pt has 9 electrons in the 5d shell and 1 electron in the 6s shell, the ground state of Ir has 7 electrons in the 5d shell and 2 electrons in the 6s shell. The energy of the Lorentzian peak center might then be calculated as , where the denotes the vacancy orbital and the binding energies are with respect to the Ir atom. Because of this difference, until a higher statistics and higher resolution measurement can be made, we are using a very simple energy calibration.
While the production of 192Ir was unintentional, the spectrum does show the peak signature of electron capture in 193Pt in addition to 192Ir, which has a 4% decay path via electron capture. The data shown in Fig. 1 represents a 58-hour measurement along with scaled theoretical descriptions convolved with a eV Gaussian response. No attempt has been made to fit the theoretical descriptions to the data. A simple scaling of the calculated theoretical shapes to the L1 peak was done and an adequate Gaussian description was determined by varying until it was a reasonable description of the data.
The dominant peak (L1) comes from 2s capture in 193Pt, with the next three peaks descending in energy coming from 2s capture in 192Ir (L1), 2p1/2 capture in 193Pt (L2), and 2p1/2 capture in 192Ir (L2). The keen observer will notice that the 192Ir L2 peak is actually taller than the 192Ir L1 peak, contrary to expectations. This is because the 192Ir L2 peak is also populated by 1s captures in 192Ir (at 74 keV and out of dynamic range for this detector), but with an escape of the K x-rays. The next peak at 10.9 keV is also from the 1s capture in 192Ir, but with the K escape x-ray. The three peaks at around 3544 eV, 4241 eV, and 5427 eV are tentatively identified as an escape peak from 192Ir L2 peak, escape peak from 193Pt L1 peak, and a Cr x-ray. The M cluster contains M1 and M2 peaks for both Pt and Ir, similarly the N cluster. Higher statistics are needed to better identify the peaks in the M and N clusters. Further measurements will also help in identification of the peaks between the M and L clusters because 192Ir has a much shorter half life (74 days) than 193Pt (50 years), so it will disappear from the spectrum over time.
A lower bound for the activity of the 193Pt was calculated by integrating the experimental data in the L1, L2, and M1 peaks above background (a flat background assumed for each peak) for an activity of Bq (1.2 Bq/). A plausible actual activity is calculated by integrating the scaled theoretical fit for 1H-(1) and dividing those counts by the measurement time. Based on these calculations, the 193Pt activity within the absorber was 0.13 Bq (3.3 Bq/), larger than the lower bound provided by gamma spectroscopy measurements of Pt (0.75 Bq/). This calculation is an order of magnitude lower than the predicted specific activity from a 10-barn cross section measurement (41 Bq/), but reasonable assuming a 1-barn cross section calculation (4.1 Bq/), which might indicate the neutron flux was not as thermal as expected. The lower bound given by integrating the L1, L2, and M2 experimental peaks is the most conservative conclusion and indicates the 10-barn cross-section calculation is deficient in the values used for integrated neutron flux, neutron energies, and/or cross-section.
Preliminary comparisons of experimental data to theoretical curves are encouraging. All binding energies and line widths used in the theoretical calculations come from the literature Campbell2001 ; CRC (see Table 1), so the only empirically derived values were an overall scaling factor determined from the L1 peak and . The locations and approximate heights of the L2 and M1 peaks on the 193Pt spectrum are accurately described by the theory. The L2 and M1 peak heights are overshot by the theoretical curves, apart from the 1H-(0U)a theory. There are several potential factors at play here: the detector is not a perfect detector because the irradiation of the foil would have created 193Pt on the edges of the foil; the background is substantial and there is a significant background in the spectrum; and the peak heights are strongly dependent on the nuclear radius used and the shape of the calculated atomic orbital near the origin because the Lorentzian peaks scale like . Any further comparisons of theoretical shape and experimental data would be premature given the low statistics of the spectrum presented.
5 Conclusions and Future Work
This paper presents the first calorimetric measurement of electron capture in 193Pt and the first published theoretical calculations for this spectrum. It is clear that further research must be done on the detector response ( eV FWHM). The predicted resolving power of 290 based purely on signal and noise considerations corresponds to 46 eV FWHM at the L1 peak (13419 eV). This is consistent with the measured detector response, indicating the energy resolution degradation may be due to heat capacity. However, while this is a less than satisfactory energy resolution, the spectrum does not show a significant difference in resolution between the L and M clusters, such as that seen between the M and N clusters in previously measured 163Ho spectra by this team Croce2016 . Better identification of the peaks between the L and M cluster should also be pursued. With higher statistics and/or improved resolution the various theoretical curves can be compared to the experimental data, offering an independent check on the theory from the work done with 163Ho.
Acknowledgements.
This work was supported by the US Department of Energy (DOE) Nuclear Energy’s Fuel Cycle Research and Development (FCR&D), Materials Protection, Accounting and Control Technologies (MPACT) Campaign and Los Alamos National Laboratory, Laboratory-Directed Research and Development Program. We gratefully acknowledge the support of the Center for Integrated Nanotechnologies, an Office of Science User Facility, and the Massachusetts Institute of Technology reactor personnel, in particular Thomas Bork for facilitating the radiation and Mike Ames for conducting immediate gamma measurements and modeling the irradiation. Heartfelt thanks to Dave Mercer for his assistance with the gamma spectroscopy and analysis, and Andrew Hoover for participating in peer review of this work.References
- (1) A. Nucciotti. Adv. High Energy Phys. 2016, 1–41 (2016). ISSN 1687-7357. doi:10.1155/2016/9153024. URL http://www.hindawi.com/journals/ahep/2016/9153024/.
- (2) C. Hassel, K. Blaum, T. D. Goodacre, H. Dorrer, C. E. Düllmann, K. Eberhardt, S. Eliseev, C. Enss, P. Filianin, A. Fäßler, A. Fleischmann, L. Gastaldo, M. Goncharov, D. Hengstler, J. Jochum, K. Johnston, M. Keller, S. Kempf, T. Kieck, U. Köster, M. Krantz, B. Marsh, C. Mokry, Y. N. Novikov, P. C. Ranitzsch, S. Rothe, A. Rischka, J. Runke, A. Saenz, F. Schneider, S. Scholl, R. X. Schüssler, F. Simkovic, T. Stora, P. Thörle-Pospiech, A. Türler, M. Veinhard, M. Wegner, K. Wendt, and K. Zuber. J. Low Temp. Phys. 184, 3-4, 910–921 (2016). ISSN 15737357. doi:10.1007/s10909-016-1541-9. URL http://www.kip.uni-heidelberg.de/echo/.
- (3) M. Faverzani, B. Alpert, D. Backer, D. Bennet, M. Biasotti, C. Brofferio, V. Ceriale, G. Ceruti, D. Corsini, P. K. Day, M. De Gerone, R. Dressler, E. Ferri, J. Fowler, E. Fumagalli, J. Gard, F. Gatti, A. Giachero, J. Hays-Wehle, S. Heinitz, G. Hilton, U. Köster, M. Lusignoli, M. Maino, J. Mates, S. Nisi, R. Nizzolo, A. Nucciotti, A. Orlando, L. Parodi, G. Pessina, G. Pizzigoni, A. Puiu, S. Ragazzi, C. Reintsema, M. Ribeiro-Gomez, D. Schmidt, D. Schuman, F. Siccardi, M. Sisti, D. Swetz, F. Terranova, J. Ullom, and L. Vale. J. Low Temp. Phys. 184, 3-4, 922–929 (2016). ISSN 0022-2291. doi:10.1007/s10909-016-1540-x. URL http://link.springer.com/10.1007/s10909-016-1540-x.
- (4) M. P. Croce, M. W. Rabin, V. Mocko, G. J. Kunde, E. R. Birnbaum, E. M. Bond, J. W. Engle, A. S. Hoover, F. M. Nortier, A. D. Pollington, W. A. Taylor, N. R. Weisse-Bernstein, L. E. Wolfsberg, J. P. Hays-Wehle, D. R. Schmidt, D. S. Swetz, J. N. Ullom, T. E. Barnhart, and R. J. Nickles. J. Low Temp. Phys. 184, 3-4, 958–968 (2016). ISSN 0022-2291. doi:10.1007/s10909-015-1451-2. URL http://link.springer.com/10.1007/s10909-015-1451-2.
- (5) H. Rotzinger, M. Linck, A. Burck, M. Rodrigues, M. Loidl, E. Leblanc, L. Fleischmann, A. Fleischmann, and C. Enss. J. Low Temp. Phys. 151, 3-4, 1087–1093 (2008). ISSN 0022-2291. doi:10.1007/s10909-008-9787-5. URL http://link.springer.com/10.1007/s10909-008-9787-5.
- (6) M. Loidl, E. Leblanc, M. Rodrigues, T. Branger, D. Lacour, J. Bouchard, and B. Censier. Appl. Radiat. Isot. 66, 6-7, 872–876 (2008). ISSN 0969-8043. doi:10.1016/J.APRADISO.2008.02.027. URL https://www.sciencedirect.com/science/article/pii/S0969804308000742.
- (7) M. Loidl, M. Rodrigues, B. Censier, S. Kowalski, X. Mougeot, P. Cassette, T. Branger, and D. Lacour. Appl. Radiat. Isot. 68, 7-8, 1454–1458 (2010). ISSN 0969-8043. doi:10.1016/J.APRADISO.2009.11.054. URL https://www.sciencedirect.com/science/article/pii/S096980430900743Xhttps://www.sciencedirect.com/science/article/pii/S096980430900743X{\#}bbib7.
- (8) M. Loidl, M. Rodrigues, and R. Mariam. Appl. Radiat. Isot. , April, 0–1 (2017). ISSN 0969-8043. doi:10.1016/j.apradiso.2017.10.042. URL http://dx.doi.org/10.1016/j.apradiso.2017.10.042.
- (9) M. Shamsuzzoha Basunia. Nucl. Data Sheets 143, 1–381 (2017). ISSN 0090-3752. doi:10.1016/J.NDS.2017.08.001. URL https://www.sciencedirect.com/science/article/pii/S0090375217300443?via{\%}3Dihub.
- (10) A. De Rújula 3 (2013). URL http://arxiv.org/abs/1305.4857https://arxiv.org/pdf/1305.4857.pdf.
- (11) A. Faessler, L. Gastaldo, and F. Šimkovic. J. Phys. G Nucl. Part. Phys. 42, 1, 015108 (2015). ISSN 0954-3899. doi:10.1088/0954-3899/42/1/015108. URL http://stacks.iop.org/0954-3899/42/i=1/a=015108?key=crossref.d506b5c21d52718faee1f91a46645730.
- (12) R. G. H. Robertson. Phys. Rev. C - Nucl. Phys. 91, 3, 1–6 (2015). ISSN 1089490X. doi:10.1103/PhysRevC.91.035504.
- (13) A. Faessler and F. Šimkovic. Phys. Rev. C 91, 4, 045505 (2015). ISSN 0556-2813. doi:10.1103/PhysRevC.91.045505. URL https://link.aps.org/doi/10.1103/PhysRevC.91.045505.
- (14) A. Faessler, C. Enss, L. Gastaldo, and F. Simkovic 064302, 1–6 (2015). ISSN 0556-2813. doi:10.1103/PhysRevC.91.064302.
- (15) A. De Rújula and M. Lusignoli pages 1–6 (2015). URL http://arxiv.org/abs/1510.05462.
- (16) A. De Rújula and M. Lusignoli. J. High Energy Phys. 2016, 5, 15 (2016). ISSN 1029-8479. doi:10.1007/JHEP05(2016)015. URL http://arxiv.org/abs/1601.04990http://dx.doi.org/10.1007/JHEP05(2016)015http://link.springer.com/10.1007/JHEP05(2016)015.
- (17) A. Faessler, L. Gastaldo, F. Simkovic, and A. D. Morgenstelle pages 1–21 (2016).
- (18) A. Faessler, L. Gastaldo, and F. Šimkovic. Phys. Rev. C 95, 4, 045502 (2017). ISSN 2469-9985. doi:10.1103/PhysRevC.95.045502. URL http://link.aps.org/doi/10.1103/PhysRevC.95.045502.
- (19) A. De Rújula. Nucl. Phys. B 188, 3, 414–458 (1981). ISSN 05503213. doi:10.1016/0550-3213(81)90002-X.
- (20) B. Jonson, J. U. Andersen, G. Beyer, G. Charpak, A. De Rújula, B. Elbek, H. H. Gustafsson, P. Hansen, P. Knudsen, E. Laegsgaard, J. Pedersen, and H. L. Ravn. Nucl. Phys. A 396, 479–493 (1983). ISSN 03759474. doi:10.1016/0375-9474(83)90040-4. URL http://linkinghub.elsevier.com/retrieve/pii/0375947483900404.
- (21) L. Gastaldo, K. Blaum, A. Doerr, C. E. Düllmann, K. Eberhardt, S. Eliseev, C. Enss, A. Faessler, A. Fleischmann, S. Kempf, M. Krivoruchenko, S. Lahiri, M. Maiti, Y. N. Novikov, P. C. O. Ranitzsch, F. Simkovic, Z. Szusc, and M. Wegner. J. Low Temp. Phys. 176, 5-6, 876–884 (2014). ISSN 15737357. doi:10.1007/s10909-014-1187-4.
- (22) B. Alpert, M. Balata, D. Bennett, M. Biasotti, C. Boragno, C. Brofferio, V. Ceriale, D. Corsini, K. P. Day, M. De Gerone, R. Dressler, M. Faverzani, E. Ferri, J. Fowler, F. Gatti, A. Giachero, J. Hays-Wehle, S. Heinitz, G. Hilton, U. Köster, M. Lusignoli, M. Maino, J. Mates, S. Nisi, R. Nizzolo, A. Nucciotti, G. Pessina, G. Pizzigoni, A. Puiu, S. Ragazzi, C. Reintsema, M. R. Gomes, D. Schmidt, D. Schumann, M. Sisti, D. Swetz, F. Terranova, J. Ullom, P. K. Day, M. De Gerone, R. Dressler, M. Faverzani, E. Ferri, J. Fowler, F. Gatti, A. Giachero, J. Hays-Wehle, S. Heinitz, G. Hilton, U. Köster, M. Lusignoli, M. Maino, J. Mates, S. Nisi, R. Nizzolo, A. Nucciotti, G. Pessina, G. Pizzigoni, A. Puiu, S. Ragazzi, C. Reintsema, M. R. Gomes, D. Schmidt, D. Schumann, M. Sisti, D. Swetz, F. Terranova, and J. Ullom. Eur. Phys. J. C 75, 3, 1–11 (2015). ISSN 1434-6052. doi:10.1140/epjc/s10052-015-3329-5. URL http://dx.doi.org/10.1140/epjc/s10052-015-3329-5.
- (23) Pt-192 Assay - Batch 186140. Technical report, Oak Ridge National Laboratory (2016).
- (24) V. P. Vertebnyi, P. N. Vorona, A. I. Kalchenko, V. A. Pshenichnyi, and V. K. Rudishin. Yad. Fiz. 22, 674 (1975).
- (25) E. Fermi. Il Nuovo Cimento 11, 1, 1–19 (1934). ISSN 0029-6341. doi:10.1007/BF02959820. URL http://link.springer.com/10.1007/BF02959820.
- (26) A. De Rújula and M. Lusignoli. Phys. Lett. B 118, 4, 429–434 (1982). ISSN 03702693. doi:10.1016/0370-2693(82)90218-0.
- (27) J. Campbell and T. Papp. At. Data Nucl. Data Tables 77, 1, 1–56 (2001). ISSN 0092640X. doi:10.1006/adnd.2000.0848.
- (28) W. M. Haynes, editor. CRC handbook of chemistry and physics. CRC Press, Boca Raton, 97 edition (2016). ISBN 9781498754286.
- (29) I. Band and M. Trzhaskovskaya. At. Data Nucl. Data Tables 35, 1, 1–13 (1986). ISSN 0092640X. doi:10.1016/0092-640X(86)90027-6.
- (30) C. J. Fontes, H. L. Zhang, J. A. Jr, R. E. H. Clark, D. P. Kilcrease, J. Colgan, R. T. Cunningham, P. Hakel, N. H. Magee, and M. E. Sherrill. J. Phys. B At. Mol. Opt. Phys. 48, 14, 144014 (2015). ISSN 0953-4075. doi:10.1088/0953-4075/48/14/144014. URL http://stacks.iop.org/0953-4075/48/i=14/a=144014?key=crossref.7723534d1292d54fe3ad136200ca3006.
- (31) I. Angeli and K. P. Marinova. At. Data Nucl. Data Tables 99, 1, 69–95 (2013). ISSN 0092640X. doi:10.1016/j.adt.2011.12.006. URL http://dx.doi.org/10.1016/j.adt.2011.12.006.
- (32) P. T. Springer, C. L. Bennett, and P. A. Baisden. Phys. Rev. A 31, 3, 1965–1967 (1985). ISSN 0556-2791. doi:10.1103/PhysRevA.31.1965. URL https://link.aps.org/doi/10.1103/PhysRevA.31.1965.
- (33) R. G. H. Robertson. Nucl. Part. Phys. Proc. 265-266, 7–12 (2015). ISSN 24056014. doi:10.1016/j.nuclphysbps.2015.06.003. URL http://dx.doi.org/10.1016/j.nuclphysbps.2015.06.003.