,
Crystal growth in nano-confinement:
Subcritical cavity formation and viscosity effects
Abstract
We report on the modeling of the formation of a cavity at the surface of crystals confined by a flat wall during growth in solution. Using a continuum thin film model, we discuss two phenomena that could be observed when decreasing the thickness of the liquid film between the crystal and the wall down to the nanoscale. First, in the presence of an attractive van der Waals contribution to the disjoining pressure, the formation of the cavity becomes sub-critical, i.e., discontinuous. In addition, there is a minimum supersaturation required to form a cavity. Second, when the thickness of the liquid film between the crystal and the substrate reaches the nanoscale, viscosity becomes relevant and hinders the formation of the cavity. We demonstrate that there is a critical value of the viscosity above which no cavity will form. The critical viscosity increases as the square of the thickness of the liquid film. A quantitative discussion of model materials such as Calcite, Sodium Chlorate, Glucose and Sucrose is provided.
Keywords: Crystal growth, Nano-confinement, Pattern formation, Interfacial phenomena, Thin fluid film, Geophysics
1 Introduction
Crystal growth is commonly confined in pores, faults, or gaps, as observed for example in rocks, in natural and artificial cements, or in biomineralization. In these conditions, crystals can be directly formed on substrate surfaces —such as during heterogeneous nucleation [1, 2, 3, 4, 5], or can be sedimented on substrates due to gravity. The subsequent growth then occurs in the presence of a contact with a substrate. Here, we wish to discuss the growth dynamics with the simplest type of contact, i.e. with a flat, rigid, and impermeable wall.
While growth can then occur at the free surface away from the contacts via bulk transport of growth units, growth in the contact regions requires mass transport along the interface between the crystal and the substrate [6] when the substrate is impermeable. The presence of a liquid film in the contact is a key ingredient to allow for such mass transport along the interface during solution growth, as discussed in the literature [7, 8, 9].
A recent combination of experiments with optical measurements and modeling via a thin film model has shown that when mass supply through the liquid film is insufficient, growth cannot be maintained in the central part of the contact, and a cavity forms in the crystal within the contact region [9]. In later stages, the cavity expands and gives rise to a rim along the edge of the contact. Such rims have been observed in many previous experiments [10, 11, 12, 13] focusing on the crystallization force produced by the growth process [14, 15, 8, 16], which is known to have important consequences for deformation and fracturing of rocks, and the weathering of building materials [17, 18]. However, here wish to focus on the case where external forces are small, which correspond for example to the experiments of Ref.[9], where the crystal was only weakly maintained against the substrate due to its own weight.
These experiments were also realized with liquid film thicknesses in the range from to nm due to the presence of nano-scale roughness or dust between the crystal and the substrate. Our aim here is to investigate the possible changes in this scenario when the thickness of the film is decreased down to the nanometer scale using a thin film model [19, 9] which accounts consistently for thermodynamics, non-equilibrium transport processes (diffusion and advection) and crystal-surface interaction.
At the nanoscale, novel ingredients come into play. The first type of ingredient is related to disjoining pressure effects, which describe the energetic cost of placing the crystal surface at a given distance from the substrate.
The standard theory of disjoining pressure, named the DLVO approach [20], combines two effects. The first one is an electrostatic double-layer repulsion due to the redistribution of charged ions close to the surfaces. These forces are exponentially decreasing with the distance. They are repulsive between similar surfaces but can be both repulsive or attractive between dissimilar surfaces [20, 21]. The second contribution to the DLVO theory are van der Waals forces, which lead to power-law interactions between surfaces. Van der Waals interactions are usually attractive when a liquid film is present in between the surfaces [20, 21]. In the past decades, significant deviation from the DLVO theory were measured at short ranges (few nanometers). These additional (usually repulsive) interactions related, e.g., to the local ordering or binding of water molecules, are referred to as hydration forces [22, 23, 24, 25]. The sum of power-law attractive forces and of exponential repulsive forces gives rise to a minimum in the interaction potential, which corresponds to an equilibrium thickness for the liquid film, hereafter denoted as [20, 22]. This distance is usually in the scale from 1 to 10 nm [20]. In the presence of such a minimum, heterogeneous nucleation can occur on the substrate, because there is a gain of energy when a crystal grows with an interface in this minimum. Hence, our study could describe growth along a flat substrate after heterogeneous nucleation.
In order to account for these effects in our model, we use a disjoining pressure with an attractive van der Waals contribution together with a generic effective short range repulsion. We show that the presence of an attraction makes the appearance of the cavity discontinuous. Indeed, various quantities, such as the depth of the cavity, exhibit a jump at the transition. In addition, there is a minimum supersaturation needed to induce cavity formation. However, the non-equilibrium morphology diagram describing the occurrence of the cavity remains unaffected as compared to the case where disjoining pressure is purely repulsive [9].
A second ingredient which becomes relevant when the film thickness is decreased down to the nanoscale is viscosity. Indeed we observe that viscosity hinders the formation of the cavity. We also show the existence of a critical viscosity above which cavities cannot form. We determine the value of the critical viscosity and find it to be proportional to the square of the film thickness. This result can also be re-formulated as the existence of a critical thickness below which the cavity will not form for a given viscosity.
We accompany the presentation of model results with a semi-quantitative discussion of the nano-confined growth of some materials, viz., Calcium Carbonate, Sodium Chlorate, Glucose and Sucrose. Although they belong to disparate classes of materials, with time-scales ranging from second to geological times and contact lengthscales from microns to centimeters, our modeling approach suggests that their behavior can be globally classified based on a small number of dimensionless physical parameters.
2 Model and methods
We consider a system with a confinement geometry similar to that of the experiments in [9]: a growing crystal is separated from a flat, impermeable and inert substrate by a thin film of solution. However, here, the film thickness is assumed to be of the order of nanometers. We assume the presence of a macroscopic concentration reservoir outside the contact region.
To predict the evolution of the confined interface during crystal growth, we use the thin film model presented in [19]. This model describes the growth of a rigid crystal, and accounts for diffusion and hydrodynamics in the liquid film. We assume that the slope of the crystal surface is small. Dynamical equations for the interface evolution can therefore be obtained by means of the standard lubrication expansion [26]. Within this limit, due to the slenderness of the film, attachment-detachment kinetics is fast as compared to diffusion along the liquid film. This assumption is more robust when considering highly soluble materials. In addition, we neglect hydrodynamic flow induced by crystal-solution density difference, assume the dilute limit and linearized Gibbs-Thomson relation. We also assume for simplicity an axisymmetric geometry.
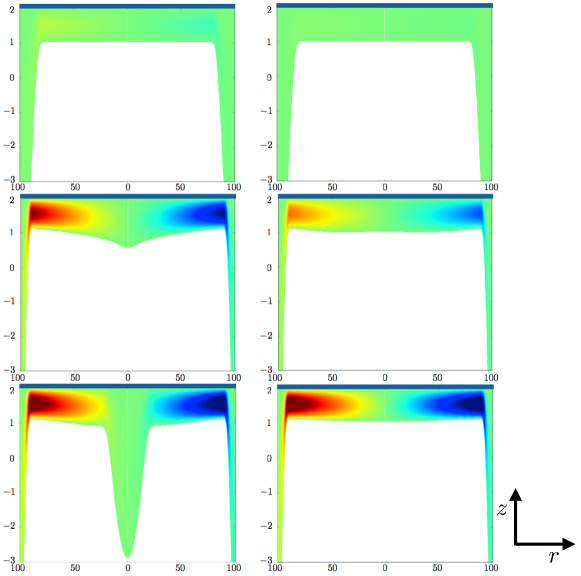
The system can be visualized in figure 1, where the profile of the crystal projected along the radius, represented in white, is growing via transport of mass from the macroscopic solution reservoir at the boundary of the simulation box to the crystal surface via the thin film solution. The velocity field of the liquid is represented by the color map and the substrate is represented by the dark-blue rectangle at the top of the images.
Let us now describe the evolution equations in more details. Using cylindrical coordinates , the dynamical equation relating the local film thickness , and the vertical rigid-body translational velocity of the crystal along reads
| (1) | |||
| (2) |
where is an effective mobility, with the diffusion constant, the molecular volume, the numerical solubility, the Boltzmann constant and the temperature. In the local chemical potential , the first two terms represent the contribution of surface tension ( surface parallel to substrate). These terms are proportional to the surface stiffness . The last term represents the contribution of the interaction potential between the substrate and the crystal.
Since we here focus on small distances , we need to account for the van der Waals contribution to , which is usually attractive for a liquid film between two solids [20]. We also included a short range repulsive term to account for a generic effective repulsion preventing contact. The interaction potential then reads
| (3) |
where is the Hammaker constant and the equilibrium thickness. It follows that the term appearing in (2) is
| (4) |
where . Given the system under study, in the following we assume nm.
The global balance between viscous forces produced by hydrodynamic flow and the forces resulting from the interaction potential provides an additional relation which allows one to determine :
| (5) |
Here we have no contribution of external force since we expect gravity effects to be negligible as compared to van der Waals attraction at this scales.
In practice the dynamical equations were solved in normalized units. Defining the dimensionless repulsion strength , dimensionless variables are the normalized width , radius and time . Rewriting the model equations in a dimensionless form, the only parameter explicitly appearing in the equation is the normalized viscosity
| (6) |
A large value of indicates a strong influence of viscosity. Since in (6), viscosity effects are seen to be important when is small.
The other relevant dimensionless quantities are the normalized system size
| (7) |
normalized supersaturation
| (8) |
and the normalized crystal velocity (growth rate)
| (9) |
-
Material CaCO NaClO Glucose Sucrose -
a [27, 28, 29] Calcium carbonate is in general characterised by a wide range of solubility due to its strong dependency on carbon dioxide presence. The value in absence of CO2 at is [30] . However this value can increase of about two orders of magnitude when CO2 is present as is the case in natural environments as sea water [31]. We assume the latter.
Two sets of simulations with different dimensionless viscosities, and , were performed. They respectively aim at modeling low solubility crystals such as Calcium Carbonate (CaCO3), and highly soluble crystals like salts and sugars. For the latter class, we focused on Sodium Chlorate (NaClO3), which was used in our previous work [9], and Glucose.
The value of the dimensionless viscosity depends on the physical parameters as described by (6). The values we chose for the simulations are rough estimations. For instance Glucose actually lies in an intermediate regime between and . Some exploratory simulations were also performed at viscosities higher than . Larger viscosities could be encountered in other natural materials as more complex sugars. In the case of sucrose for instance, we have mPa so that at saturation [41]. As a summary, the parameters used in the simulations are listed in table 1.
Finally, the value of the normalized repulsion strength is chosen following the same lines as in [19]. For simplicity we assume J [20] to be the same for all materials considered here. We then obtain . In any case, the qualitative behavior is not influenced by this parameter which never appears explicitly in the normalized equations, and only contributes to the spatial and temporal scales on which phenomena can be observed.
3 Discontinuous transition
We numerically solved (1) and (5) in a circular simulation box of fixed radius , and fixed film width and supersaturation at the boundary of the integration domain. In all simulations we were able to reach a steady state characterized by a constant growth rate and crystal interface profile. We observe that for low enough viscosities , a cavity appears when increasing the simulation box radius , or the boundary supersaturation . In figure 1 we show two examples of simulations. The two columns where realized using different normalized viscosities , and keeping the other parameters fixed. Simulations at higher viscosity, e.g. , do not show the appearance of a cavity.
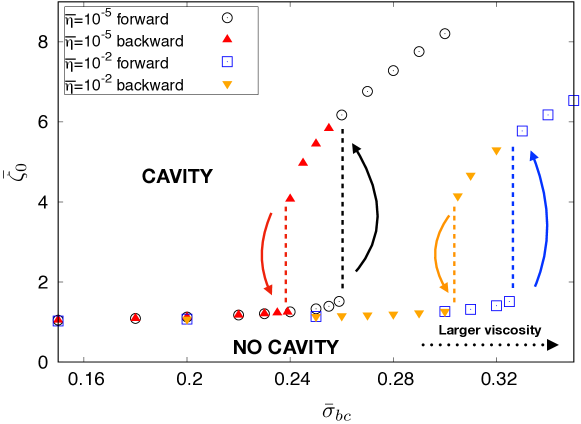
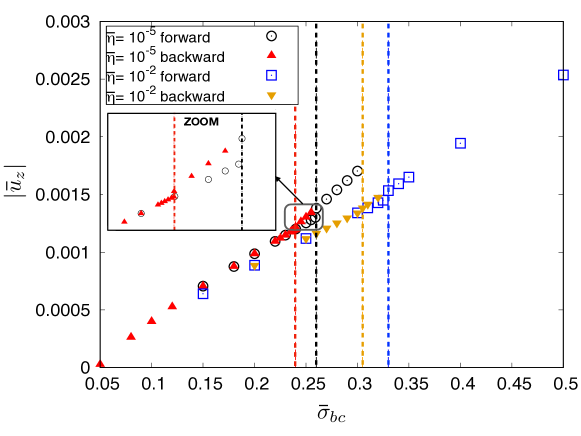
For the two set of simulations considered, namely and , we studied the steady state profiles close to the transition. In figure 2 we show as an example the variation of the normalized width of the film in the center of the contact as a function of the normalized supersaturation , and for fixed box size . Each dots corresponds to a steady state reached in a single simulation.
Considering a surface which is initially flat and in the minimum of the interaction potential (), and gradually increasing the supersaturation , we observe a sharp jump in the value of at the transition. This process corresponds to black circles and blue squares in figure 2. However if we start with a system beyond the critical supersaturation, thus featuring a cavity, and slowly decrease the supersaturation , the transition is not observed at the same point, but at a lower supersaturation. This is represented by red and yellow triangles in figure 2. Hence, the transition exhibits hysteresis. A similar behavior is observed when looking at the crystal growth rate. This is showed in figure 5, where the discontinuity is less apparent especially in the backward transition (i.e. when decreasing the supersaturation).
No qualitative difference is observed between simulations at and . The main difference lies in the shift of the transition towards larger supersaturations when the viscosity is increased.
4 Non-equilibrium morphology diagram
In [9], the conditions under which the formation of a cavity can be observed were summarized in a non-equilibrium morphology diagram. Let us recall the derivation of the condition for the transition following the same lines as in [9]. Consider steady state with a flat contact. From mass conservation (neglecting the consequences of solute advection), the total mass entering the liquid film from the boundary of a disc of radius must be equal to the mass entering the crystal, leading to
| (10) |
where is the film thickness, is the mass flux entering the crystal per unit area and is the the diffusion flux entering the liquid film. Integrating the previous relation and using the identities where is the growth rate, and , we obtain the concentration profile . Then, using the definition of the supersaturation , we find
| (11) |
where and are respectively the radius and the supersaturation at the boundary of the contact area. Using as condition for cavity formation, we obtain the growth rate at the threshold
| (12) |
Following [9], the heuristic multiplicative constant is introduced in order to capture quantitatively the simulation results within this simplified approach.
In order to build a non-equilibrium morphology diagram representing the location of the transition (when it exists) in a plane where the axes are the left hand side and right hand side of (12), we need to evaluate the observables and . First, we determine the couple and at the transition. Then, we consider the contact radius from the condition that exceeds the equilibrium position by . Finally we obtain using
| (13) |
where is the local mean curvature. The procedure is repeated for simulations at different box sizes and viscosities, and on the different branches of the hysteresis curve.
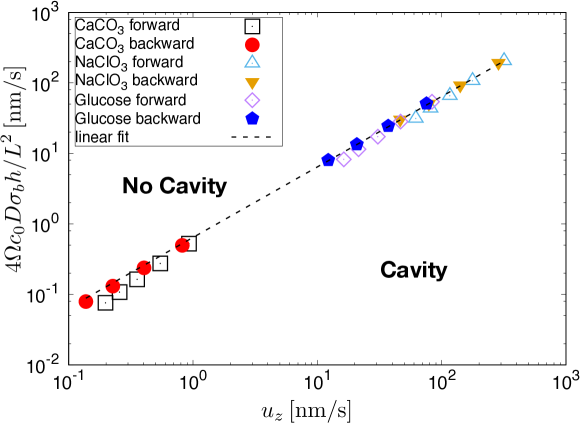
The results, shown in figure 3, confirm the expected linearity of the transition line. Interestingly, the forward and the backward transitions roughly collapse on the same line. The differences in mass transport kinetics between different materials however lead to differences in the orders of magnitude of the critical vertical growth velocity (from about to nm). A linear fit for the slope of the transition line leads to . This result is close to the value obtained in [9]. However, the model of [9] was different, with a purely repulsive potential and a load to maintain the crystal close to the substrate. This result suggests that the constant could be robust with respect to the details of the model.
5 Critical supersaturation and critical viscosity
To understand how viscosity can affect the transition we resort to a perturbative analysis of the steady-state solution. This is done assuming that, just before the transition, the profile deviates slightly from the equilibrium configuration . The details of the derivation, reported in B, reveal that the perturbation exhibits a concave parabolic profile. Hence, the thickness in the center of the contact increases as the supersaturation increases even in the absence of cavity.
This result suggests a simple mechanism for cavity formation. We use the standard result of the linear stability analysis of an infinite flat profile of thickness , which indicates that the surface of the crystal should be stable when , and unstable when . This is similar to usual spinodal decomposition [43]. Hence, the initial profile with is constant and at the minimum of the potential with corresponds to a stable configuration. Considering now a non-equilibrium profile with a concave parabolic , an approximate criterion for the cavity to form is that the thickness at the center of the contact reaches the inflection point of the potential, with . This scenario is consistent with a discontinuous transition, since upon destabilization the thickness in the center of the contact becomes larger than . Once the instability is initiated, the larger , the larger , and the stronger the destabilization, leading to a self-amplifying feedback. Note once again that this behavior is reminiscent of spinodal instabilities [44, 45, 46].
Using this simple argument, i.e. , and in the limit of large contacts, we find an expression for the critical supersaturation:
| (14) |
The details of the derivation are reported in B.
As a first consequence of (14), the critical supersaturation is expected to reach a finite value , when the viscosity vanishes. This result differs from the behavior of purely repulsive potentials discussed in [9], where vanishingly small supersaturations were able to destabilize large crystals. This difference is intuitively understood from the fact that the supersaturation here needs to be large enough to lead to an escape of the crystal surface from the potential well at . Thus the thermodynamic force related to supersaturation must be larger than the disjoining force dragging the interface towards the minimum of the potential . Since , we obtain that , which is identical to (14) when and is given by (3). This result, which states that the the critical supersaturation is expected to reach a constant value when the viscosity vanishes and the size is large, is confirmed by simulations in figure 4 for small viscosities (blue and red triangles). However, the predicted value is larger than the value observed in simulations . Going back to physical variables , we find that the critical supersaturation at vanishing viscosities is small to for nm. Since , the critical supersaturation decreases quickly when the equilibrium thickness increases, and for nm.
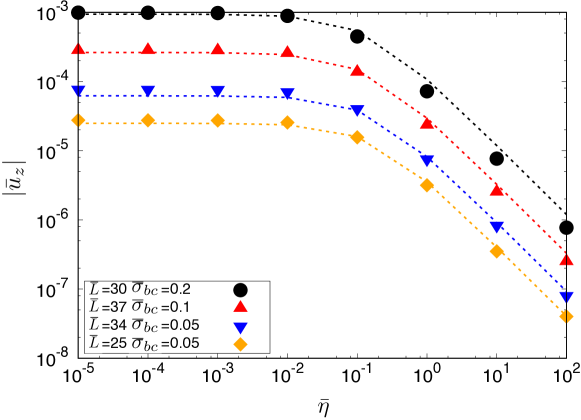
The expression (14) also provides information about the consequences of viscosity. For example, it agrees qualitatively with figure 2, where higher viscosities were shown to lead to a transition at higher supersaturations. In figure 4, we show the normalized critical (forward) supersaturation at different normalized viscosities as obtained by simulations. This again confirms good qualitative agreement with (14), since it agrees both with the increase of with increasing , and with the divergence of for a finite value of .
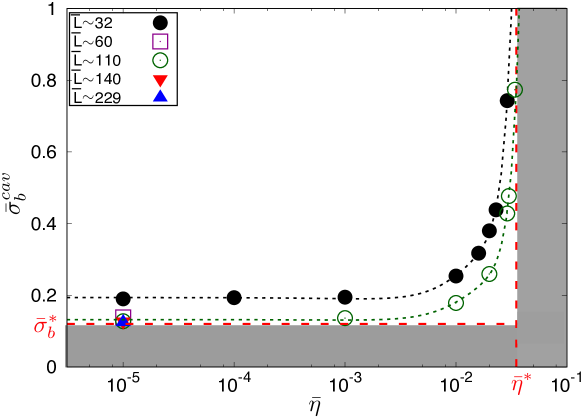
However, (14) is quantitatively inaccurate. For example, the observed threshold at is lower than the predicted value . Despite the absence of a quantitatively accurate expression for the critical supersaturation as a function of viscosity, it is possible to obtain quantitative insights about the critical viscosity using the morphology diagram. Indeed, inserting the parabolic profile of the film in the contact in the force balance equation (5), leads to a second relation valid below the transition
| (15) |
The details of this derivation are presented in B.2. This expression exhibits quantitative agreement with simulation results as illustrated in figure 7. It follows from (15) that, as viscosity increases, the growth rate decreases. In addition, for low viscosities the growth rate is independent of the viscosity.
Inserting (15) in (12), we find the critical value of the viscosity above which the cavity cannot form
| (16) |
Interestingly, if we assume the idealized case to hold (), we would have obtained as in (14). Even though (15) and (16) rely on some approximations —based on our perturbative analysis and on the heuristic character of the parameter — we find that (16) provides a reasonably accurate prediction close to the value from the full numerical solution of the model.
The discussion of this result can be presented in two different ways. First, we may assume that disjoining pressure effects lead to a fixed film thickness, assumed for example to be nm. Then, using (16) and considering the materials listed in table 1, we find mPas for Calcite, mPas for Sodium Chlorate, mPas for Glucose and mPas for Sucrose. Cavity formation should be hindered or suppressed by viscosity effects when these values are equal to, or smaller than the values of viscosity at saturation reported in the last column of table 1. These are , , and mPas, respectively. Thus, for example we do not expect a cavity to appear for Sucrose while Calcite could feature a cavity. Conclusions on Glucose or Sodium Chlorate are more difficult since the value of the critical viscosity is close to the viscosity at saturation.
The threshold can be reformulated in a different manner. Indeed, since the value of the critical viscosity increases as the square of there is a critical thickness above which a cavity can form for a given system. Using the viscosity at saturation, we find nm for CaCO3, nm for NaClO3, nm for Glucose, and nm for Sucrose. These results once again state that cavity formation should be suppressed for Sucrose with nanoscale confinement. For other materials with smaller viscosities, the main effect of viscosity should be to shift the transition as shown in figure 2 and figure 3. In general, when the film thickness is larger than nm as in [9, 12], we expect cavities can form for most materials.
6 Discussion
Some limitations of our approach are discussed in this section. The first one concerns the difficulty to analyze strongly anisotropic crystals which exhibit facets. Indeed, the stiffness is expected to diverge at faceted orientations. However, in [9], satisfactory quantitative agreement with experimental data for faceted crystals was obtained using a large but finite stiffness. Applying this ad hoc assumption to the results of the present paper would not change them qualitatively. However, the value of some physical observables would change. If we assume an effective stiffness about - times the surface tension [9], crystal velocities (see figure 3) reduce by the same factor. In addition, due to our stiffness-dependent normalization of space variables, our simulations would correspond to larger crystal sizes (by a factor - ). In any case this will not change the measured slope of the non-equilibrium phase diagram nor the value of the critical viscosity since these quantities are independent of the stiffness.
A second difficulty is to use continuum models to describe the consequences of nano-scale confinement on diffusion and hydrodynamics. It is known for example that diffusion constants in water can vary significantly with confinement [47]. In contrast, the hydrodynamic description of water with bulk viscosity is known to be quantitatively accurate for separations larger than nm [47]. At the nanoscale, liquids can also be structured in the vicinity of solid surfaces. For example, layering may lead to oscillations in the disjoining pressure [20]. Additional confinement effects specific to solutions appear when the liquid film thickness is decreased up to values that are comparable to the size of the solute molecules. Such confinement effects could be observed, e.g., for sucrose which exhibits a molecular size of the order of one nanometer. Globally, using continuum models to probe nanoscale hydrodynamic effects is a challenge. In order to reach quantitative accuracy, such methods must be based on effective models which are calibrated on molecular simulations to account for possible deviations from the bulk behavior. This strategy should allow one to describe some of the consequences of confinement by means of the thickness-dependence of physical parameters such as the diffusion constant and the viscosity. Achieving this goal would be an important step toward the modeling of crystal growth with nanoscale confinement. Indeed, modeling of the growth process in standard molecular dynamics simulations is difficult due to prohibitive computational time.
Another phenomenon which comes to the fore at the nanoscale is thermal fluctuations. While the model discussed here is purely deterministic, atomistic simulations such as Molecular Dynamics of Monte Carlo Simulations [48] can account for fluctuations. Thermal fluctuations could trigger the random opening and closure of the cavity observed in NaClO3 crystals reported in Ref. [9]. Larger-scale fluctuations or perturbations, such as those due to convection or stirring in the bulk fluid outside the crystal, should not be relevant here, since they influence mass transport at scales larger than the thickness of the diffusion boundary layer at the free surface of the crystal, which is itself larger than the film thicknesses considered here. Indeed, taking , we would need a very large hydrodynamic velocity outside the contact region for to reach a scale comparable to that of the liquid film in the contact nm.
As already mentioned in the introduction, since it leads to growth perpendicular to the substrate incorporation of mass in the crystal at contacts may lead to the generation of forces on the substrate [14, 15, 8, 16]. These crystallization forces play an important role in geology since they are responsible for deformation and fracturing of rocks, and are also crucial for the weathering of building materials [17, 18]. Even though these forces are well characterized at equilibrium via energy balance [49, 50], we still lack a precise understanding of the related non-equilibrium dynamics. A major issue is for instance to understand the interplay between the force of crystallization and the non-equilibrium morphology of the contact [10], often characterized by the presence of a rim along the edge of the contact region [10, 11, 12, 13]. Despite the absence of external forces in our model, we hope that our results will provide hints toward a better understanding of the conditions under which rims can form.
7 Conclusions
In conclusion, we have studied the formation of cavities in nano-confined crystal surfaces. Examples are discussed for some model materials ranging from poorly soluble minerals (Calcite) to high soluble salts (Sodium Chlorate) and sugars.
Cavity formation was recently observed experimentally using NaClO3 crystals with liquid film thicknesses that were one or two orders of magnitude larger than those used here [9]. Despite the different scales the resulting non-equilibrium morphology diagrams are very similar (with a similar value of the phenomenological constant ). This further confirms the robustness of cavity formation with respect to variations of physical conditions and materials.
However, some differences are observed at the nanoscale. First, we show that an attractive van der Waals interaction induces a discontinuous (subcritical) transition with hysteresis. Moreover, there is a minimum supersaturation below which cavities cannot form because the driving force is not sufficient for the interface to escape from the potential well of the disjoining pressure (however its quantitative value is relatively small when is larger than nm). Second, due to the nanoscale width of the liquid film separating the crystal and the confining wall, viscosity becomes relevant. The effect of viscosity is to shift the transition toward larger crystal sizes and larger supersaturations. Moreover, the formation of the cavity can also be prevented by sufficiently large viscosities. We estimated the relevant critical viscosity above which no cavity should appear. In practice, such condition could be realized for instance for sucrose.
We hope that our work will inspire novel experimental investigations or molecular simulations of growth after heterogeneous nucleation and of growth of sedimented crystals.
Appendix A Growth rate as a function of supersaturation
In figure 5 we show the normalized growth rate as a function of the normalized supersaturation at the boundary of the simulation box as obtained from numerical solution of (1) and (5). The growth rate responds roughly linearly to changes in the supersaturation, and a small jump followed by a change of slope is observed at the transition. Hysteresis is also found here but the discontinuity is more apparent when increasing the supersaturation from an initial flat surface (forward transition).
Appendix B Perturbation to equilibrium
Using a perturbative approach from the equilibrium solution of (1) and (5), we here derive approximate expressions for the growth rate and the critical supersaturation.
As a preamble, we characterize the equilibrium solution itself. Steady-state solution of (1) and (5) obey
| (17) |
The equilibrium solution is a particular steady-state equation obeying and
| (18) |
where is a constant which corresponds to the equilibrium chemical potential. The radius of the contact region is denoted as . Multiplying (18) by , and integrating between the center of the contact at and a radius , we find a relation between the equilibrium chemical potential and the slope at the boundary of the integration domain
| (19) |
where we have used the relation , corresponding to the equilibrium force balance (5). A second relation can be found when multiplying (18) by and integrating with respect to :
| (20) |
where . Equation (20) relating the surface slope outside the contact to the depth of the potential well , is equivalent to a generalized form of the Young contact angle condition. The integral term in the second equation is related to the effect of line tension. In the following, we will neglect this term.
We now assume that the equilibrium profile is flat with for . Then, we expect , and combining (20) and (19) we find
| (21) |
where we assumed that the interaction potential vanishes far from the contact region . Note that under these approximations the right hand side of (20) vanishes, and this equation is the small slope limit of the Young contact angle condition.
Consider now a system below the transition, so that no cavity is present. The crystal surface profile is then expected to be close to the equilibrium profile. We therefore consider the difference between the steady-state solution and the equilibrium solution to be small. Expanding (17) to linear order in , and integrating two times, we find
| (22) |
where we have used the parity of and (18), and we have defined the chemical potential at the edge of the contact zone with given by (2). Assuming again that in the contact area the equilibrium profile is flat , (22) can be rewritten as:
| (23) |
A particular solution of this equation is a parabola:
| (24) |
A comparison between this solution and the profile obtained from numerical integration is shown in figure 6 for crystal close to the transition. The agreement is very satisfactory.
B.1 Viscosity effect on the growth rate
Applying a similar procedure to the force balance expression in (5) we have to leading order
| (25) |
Using (22) to express the right hand side, we are left with
| (26) |
As done previously we assume that in the contact area , the equilibrium profile is . With this assumption the previous relation reduces to
| (27) |
Using (24) to express the last term in the right hand size we have
| (28) |
We then obtain
| (29) |
As showed in figure 7 the comparison between this relation and the direct numerical solution of proves to be satisfactory.
Here, we wish to focus on steady-states close to the threshold of cavity formation. Since from 21, this term can be neglected far from equilibrium and for large system sizes where cavity formation occurs. For the same reason we neglect the term of order . Finally, assuming the supersaturation is small, we have , and we obtain (15).
B.2 Viscosity effect on the critical supersaturation
As discussed in the main text, we expect the cavity to appear when , where is the width at the center of the contact, and is defined by the relation . Given (4) and assuming again , we find and . Let us recall (24) and consider the correction to :
| (30) |
Now we use the condition for the appearance of the cavity, and deduce the corresponding critical value of the chemical potential at the boundary:
| (31) |
Using (29) we have
| (32) |
Using again the identity , neglecting the last term in the denominator () and the equilibrium chemical potential (), we obtain (14).
References
References
- [1] Markov I V 2017 Crystal Growth for Beginners 3rd ed (World Scientific, Singapore) ISBN 9813143428
- [2] Turnbull D 1950 The Journal of Chemical Physics 18 198–203 ISSN 00219606
- [3] Winter D, Virnau P and Binder K 2009 Physical Review Letters 103 1–4 ISSN 00319007 (Preprint 1001.3336)
- [4] Page A J and Sear R P 2006 Physical Review Letters 97 1–4 ISSN 00319007
- [5] Chayen N E, Saridakis E and Sear R P 2006 Proceedings of the National Academy of Sciences of the United States of America 103 597–601 ISSN 0027-8424
- [6] Durney D W 1972 Nature 253 315–317 ISSN 00280836
- [7] Weyl P K 1959 Journal of Geophysical Research 64 2001–2025 ISSN 2156-2202
- [8] Desarnaud J, Bonn D and Shahidzadeh N 2016 Scientific Reports 6 30856 ISSN 2045-2322
- [9] Kohler F, Gagliardi L, Pierre-Louis O and Dysthe D K 2018 Submitted (Preprint 1802.00310)
- [10] Robert J Flatt, Michael Steiger G W S 2007 Environ Geol 52 187–203
- [11] Røyne A and Dysthe D K 2012 Journal of Crystal Growth 346 89–100 ISSN 0022-0248
- [12] Li L, Kohler F, Røyne A and Dysthe D 2017 Crystals 7 361 ISSN 2073-4352
- [13] Taber S 1916 American Journal of Science 532–556
- [14] Becker G F and Day A L 1916 The Journal of Geology 24 313–333
- [15] Correns C W and Steinborn W 1939 Zeitschrift für Kristallographie-Crystalline Materials 101 117–133
- [16] Naillon A, Joseph P and Prat M 2018 Physical Review Letters 120 34502 ISSN 1079-7114
- [17] Flatt R J 2002 Journal of Crystal Growth 242 435–454 ISSN 00220248
- [18] Espinosa-Marzal R M and Scherer G W 2010 Accounts of chemical research 43 897–905
- [19] Gagliardi L and Pierre-Louis O 2018 Physical Review E 97 012802 ISSN 2470-0045
- [20] Israelachvili J N 1991 Intermolecular and Surface Forces Third Edition 3rd ed (Academic Press) ISBN 0123751829
- [21] Verwey E J W and Overbeek J T G 1948 Theory of the stability of lyophobic colloids (Elsevier Publishing Company. INC.) ISBN 00223654 (ISSN)
- [22] Alcantar N, Israelachvili J and Boles J 2003 Geochimica et Cosmochimica Acta 67 1289–1304 ISSN 00167037
- [23] Valle-Delgado J J, Molina-Bolívar J A, Galisteo-González F, Gálvez-Ruiz M J, Feiler A and Rutland M W 2005 Journal of Chemical Physics 123 1–12 ISSN 00219606
- [24] Hamilton A, Koutsos V and Hall C 2010 Chemical Communications 46 5235 ISSN 1359-7345
- [25] Diao Y and Espinosa-marzal R M 2016 PNAS 113 12047–12052
- [26] Oron A and Bankoff S G 1997 Reviews of Modern Physics 69 931–980 ISSN 0034-6861
- [27] Yuan-Hui L and Gregory S 1974 Geochimica et Cosmochimica Acta 38 703–714 ISSN 00167037
- [28] Røyne A, Bisschop J and Dysthe D K 2011 J. Geophys. Res. 116 B04204 ISSN 0148-0227
- [29] 2017 National Center for Biotechnology Information. PubChem Compound Database; CID=10112
- [30] Tegethoff F W (ed) 2001 Calcium Carbonate (Basel: Birkhäuser Basel) ISBN 978-3-0348-9490-6
- [31] Miller J P 1952 American Journal of Science 250 161–203
- [32] Seidell A 1919 Solubilities of inorganic and organic substances (New York, Van Nostrand)
- [33] Misbah C, Renard F, Gratier J P and Klaus K 2004 Geophysical Research Letters 31 1–5 ISSN 0094-8276
- [34] Campbell A, Kartzmark E and Olivier B G 1966 Canadian Journal of Chemistry 44 925–934
- [35] Lide D R (ed) 2005 Handbook of Chemistry and Physics 86th ed (CRC Press (Taylor and Francis Group)) ISBN 0-8493-0486-5
- [36] Campbell A and Oliver B 1969 Canadian Journal of Chemistry 47 2681–2685 ISSN 1480-3291
- [37] Gladden J K and Dole M 1953 Journal of the American Chemical Society 75 3900–3904 ISSN 15205126
- [38] Viet Bui A and Nguyen M H 2004 Journal of Food Engineering 62 345–349 ISSN 02608774
- [39] 2017 National Center for Biotechnology Information. PubChem Compound Database; CID=5793
- [40] Honig P 1959 Principles of Sugar Technology, Volume II Crystallisation elsevier p ed
- [41] Mathlouthi M and Reiser P 1995 Sucrose springer s ed vol 69 ISBN 0751402230
- [42] 2017 National Center for Biotechnology Information. PubChem Compound Database; CID=5988
- [43] Cahn J W 1961 Acta Metallurgica 9 795–801 ISSN 00016160
- [44] Mitlin V S and Petviashvili N V 1994 Physics Letters A 192 323–326 ISSN 03759601
- [45] Herminghous S, Jacobs K, Mecke K, Bischof J, Fery A, Ibn-Elhaj M and Schlagowski S 1998 Science 282 916
- [46] Xie R, Karim A, Douglas J F, Han C C and Weiss R A 1998 Physical Review Letters 81 1251–1254 ISSN 10797114
- [47] Bocquet L and Charlaix E 2010 Chem. Soc. Rev. 39 1073–1095 ISSN 0306-0012
- [48] Høgberget J, Røyne A, Dysthe D K and Jettestuen E 2016 Physical Review E - Statistical, Nonlinear, and Soft Matter Physics 94 1–12
- [49] Steiger M 2005 Journal of Crystal Growth 282 470–481 ISSN 00220248
- [50] Steiger M 2005 Journal of Crystal Growth 282 455–469 ISSN 00220248