Twin radio relics in a near-by low-mass galaxy cluster Abell 168
Abstract
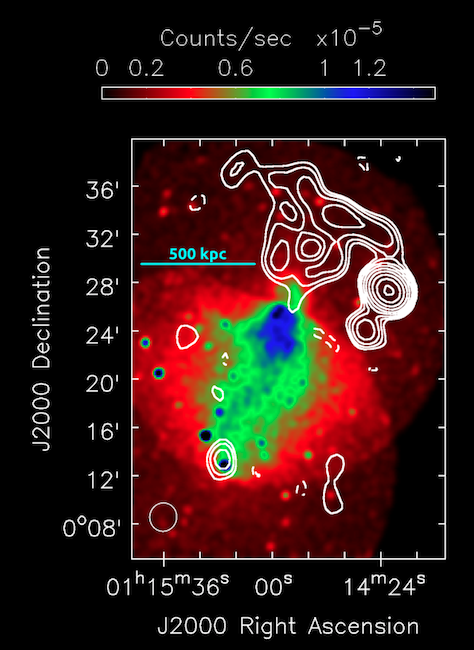
We report the discovery of twin radio relics in the outskirts of the low-mass merging galaxy cluster Abell 168 (redshift=0.045). One of the relics is elongated with a linear extent 800 kpc, a projected width of 80 kpc and is located 900 kpc toward the north of the cluster center, oriented roughly perpendicular to the major axis of the X-ray emission. The second relic is ring-shaped with a size 220 kpc and is located near the inner edge of the elongated relic at a distance of 600 kpc from the cluster center. These radio sources were imaged at 323 and 608 MHz with the Giant Meterwave Radio Telescope and at 1520 MHz with the Karl G Jansky Very Large Array (VLA). The elongated relic was detected at all the frequencies with a radio power at 1.4 GHz of 1.38 W Hz-1 having a power law in the frequency range 70 - 1500 MHz (S). This radio power is in good agreement with that expected from the known empirical relation between the radio powers of relics and the host cluster masses. This is the lowest mass (M500 = 1.241014 Mo) cluster in which relics due to merger shocks are detected. The ring-shaped relic has a steeper spectral index () of -1.740.29 in the frequency range 100 - 600 MHz. We propose this relic to be an old plasma revived due to adiabatic compression by the outgoing shock which produced the elongated relic.
keywords:
galaxies: clusters: intracluster medium – galaxies: clusters: individual (A168) – techniques: interferometric – radio continuum: general – radiation mechanisms: non-thermal – X-rays: galaxies: clusters1 Introduction
Diffuse radio emission in galaxy clusters can be broadly classified into two categories – halos and relics, found predominantly in the central regions and towards the peripheries of clusters respectively. Neither of them are associated with currently active galaxies of the clusters. Halos are typically of 1 Mpc extent, have a roundish morphology, of low surface brightness ( 1 mJy arcmin-2 at 1.4 GHz) and are unpolarized to a few percent level. Halos tend to have steep radio spectra, with , where S , S being the flux density. Relics are similar to halos in terms of their extents in one direction with narrow ( 0.1 Mpc) extents in the perpendicular direction. Relics have somewhat higher surface brightnesses, but have similar spectra as the halos. However, they are located toward the cluster periphery ( 1 Mpc from the cluster center) and are polarized to the extent of 20 % (Feretti et al., 2012; Brunetti & Jones, 2014). About 30 % of the high X-ray luminosity (L 5 erg s-1 ) clusters host radio halos and relics. A positive correlation between the radio powers of halos and relics at 1.4 GHz and the X-ray luminosities of respective host clusters has been observed (Feretti et al., 2012).
The radio emission from halos and relics is known to be synchrotron in origin with Gev electrons radiating in the G magnetic fields in clusters. The most important puzzle with the existence of such diffuse radio emission in galaxy clusters has been their extents. The diffusion time scales of the relativistic electrons to cover these extents are more than 10 times larger than the life times of the radiating electrons at a frequency 1 GHz (Jaffe, 1977). One of the ways to get around this problem is to postulate in-situ acceleration of relativistic electrons, thus avoiding the time scale problem. Magnetic fields have been found to be ubiquitous in galaxy clusters (Carilli & Taylor, 2002).
Cluster-wide turbulence is believed to be responsible for in-situ acceleration of relativisitc electrons that produce the radio halos. Cluster mergers have been invoked to create turbulence in the cluster volume. Mildly relativistic seed electrons present in the cluster volume (from previous AGN activities, for e.g.) are believed to be accelerated to relativistic energies through their interactions with the turbulence. Turbulent acceleration is inefficient and short-lived, as a consequence of which the halo emission is believed to be correlated to recent merger activities of clusters. Indeed, a correlation between the dynamical states of clusters and the existence of radio halos and relics in them has been observed with the halos and relics being predominantly found in non-virialised clusters (Brunetti et al., 2007; Donnert et al., 2013; Brunetti et al., 2009; Cassano et al., 2010).
At least two types of radio relics are known to exist in clusters. The large ( Mpc) relics are found toward the peripheries of clusters, oriented perpendicular to the merger axes of clusters (Bagchi et al., 2006; van Weeren et al., 2010; van Weeren et al., 2012). These relics are produced by the out-going merger shocks. While the overall machanism for producing the relativistic electrons is believed to be diffusive shock acceleration at the sites of these shocks, the seed electrons can come from both the thermal pool of electrons and the mildly relativistic fossil electrons left over from earlier AGN activities (Ensslin et al., 1998; Markevitch et al., 2005). Cluster merger simulations have been carried out to account for the occurrence of relics and their properties. Some of the basic properties of relics like their morphology, spectral index variations from the shock edge towards the post-shock regions, and the steepening of spectral index at higher frequencies have been accounted for to some extent (Enßlin & Brüggen, 2002; Kang & Ryu, 2015; Kang, 2017). A recent example of re-acceleration of electrons by shocks in galaxy clusters has been found in Abell 3411-3412 (van Weeren et al., 2017). The second type of relics are the radio ’phoenices’ that are believed to trace the compressed fossil plasma. These ’phonecies’ are found both in the central and the peripheral regions of clusters and display steep and curved spectra (Slee et al., 2001; Enßlin & Gopal-Krishna, 2001; Enßlin & Brüggen, 2002; Kale & Dwarakanath, 2012).
| Cluster | RA(J2000) | DEC(J2000) | Lx (0.1-2.4 keV) | MSZ | |||||
| hh | mm | ss | ∘ | ′ | ′′ | (1044 erg s-1) | (1014 M⊙) | ||
| A168 | 01 | 15 | 12.0 | +00 | 19 | 48 | 0.0450 | 0.46 | 1.52 |
The diffuse radio emission associated with the galaxy cluster Abell 168 (hereafter A168) was discovered in a cross referencing of the Meta-Catalogue of X-ray detected Clusters (MCXC) of galaxies with the GaLactic and Extragalactic All-sky MWA (GLEAM) survey at 200 MHz carried out by the Murchison Widefield Array. The MCXC is a catalogue of X-ray detected galaxy clusters based on the publicly available ROSAT All Sky Survey and serendipitous discoveries (Piffaretti et al., 2011). This catalog consists of a total of 1743 galaxy clusters with homogenised properties such as redshift, 0.1–2.4 keV band luminosity , total mass , and radius available for each cluster. The GaLactic and Extragalactic All-sky MWA (GLEAM) survey was carried out using the Murchison Widefield Array (Hurley-Walker et al., 2017). The GLEAM survey covers the entire sky south of in the frequency range 72-231 MHz. The instantaneous frequency coverage of MWA is 30.72 MHz and hence the above mentioned frequency range is divided into five bands providing near contiguous coverage. In addition, this survey also produced images at 200 MHz with a bandwidth of 60 MHz resulting in a resolution of 2 arcmin and a sensitivity of 5 mJy beam-1. This diffuse radio emission in A168 was also detected as part of the project to catalog all diffuse radio sources in clusters using the GLEAM survey (M. Johnston-Hollitt, private communication). An overlay of the GLEAM 200 MHz image on the XMM-Newton image of the A168 cluster is shown in Fig. 1. Some basic properties of A168 are given in Table 1. A168 is also detected in the Planck observations (PSZ2 G135.76-62.03) and it’s Sunyaev-Zel’dovich (SZ) mass is of 1.52 1014 M (Planck Collaboration et al. (2016)).
The cosmology used in this paper is = 70 km s-1 Mpc-1 = 0.3 and = 0.7, giving a luminosity distance of 199.3 Mpc to A168 with an assumed redshift of 0.045.
2 Observations
2.1 GMRT Observations
The cluster A168 was observed with the Giant Meterwave Radio Telescope (GMRT) in the standard 325 and 610 MHz bands during 26-27 November, 2016. A continuous track of 8 hours was carried out at each of the two center frequencies with a bandwidth of 32 MHz and 512 channels. The GMRT Software Backend was used for these observations. Primary calibrators 3C48 and 3C147 were used along with the secondary gain calibrator 0059+001 at both the frequencies.
2.2 VLA Observations
The Karl G. Jansky Very Large Array (VLA) observations of A168 were carried out on 28 April, 2017 when the array was in the D-configuration (maximum baseline 1 km). The total observing time was 2.5 hour. The observations were carried out in the frequency range 1-2 GHz with 16 spectral windows, each spectral window having 64 channels. The primary and secondary calibrators used were 3C138 and J0059+0006 respectively.
3 Data Analysis
3.1 VLA Data Analysis
For analysing the VLA data, the Very Large Array calibration pipeline, which does basic flagging and calibration, was used (https://science.nrao.edu/facilities/vla/data-processing/pipeline). The shortest baseline from which data was available was 200 with the longest baseline available being 5000 ( 1 km). This calibrated data was further analysed using the Common Astronomy Software Applications (CASA) package ((McMullin et al., 2007)). The imaging was carried out using the multi-scale, multi-frequency synthesis method in the task CLEAN which takes into account the large bandwidth used in these observations in addition to recovering the extended emission as well as possible. Furthermore, imaging was also carried out taking into account the spectral curvature across the band (Taylor terms = 2 in the task CLEAN) and the wide-field of view (w-projection in the task CLEAN) (Cornwell et al., 2008; Rau & Cornwell, 2011). Suitable number of phase and amplitude self-calibrations were carried out to get the best images as evidenced by minimum RMS and least systematics.
Images of different resolutions and sensitivities were produced by varying the weighting of the visibilities (robust parameter in the task CLEAN). Varying the robust parameter (Briggs, 1995) from -2 to +2 changes the weighting of the visibilities from ’uniform’ to ’natural’. Natural weighting produces images sensitive to extended emission, but with a loss of resolution. Uniform weighting, on the other hand, produces images with the best resolution, but at the loss of sensitivity to extended emission. The final image adopted here is the one produced with robust = 1, which is a compromise between sensitivity to extended emission and resolution.
3.2 GMRT Data Analysis
The GMRT observations were analysed using the Source Peeling And Modeling (SPAM) package ((Intema et al., 2009). SPAM is an Astronomical Image Processing Software (AIPS)-based Python package that provides semi-automated data reduction scripts for all sub-GHz Frequencies at GMRT (Intema, 2014). Apart from incorporating well-tested data reduction steps like calibration, wide-field imaging and self-calibration, SPAM also incorporates direction-dependent gain calibration and imaging and radio frequency interference excision methods (Intema, 2014). Images of A168 field were produced with different weightings, tapers and uvranges of the visibilities included in the imaging. The GMRT observations were also analysed using AIPS and the images produced by these two methods were compared. There was excellent agreement between the two sets of images.
The shortest baseline included in the imaging at 323 and 608 MHz was 200 to be consistent with the VLA observations. This restriction also excludes some of the shortest baseline visibilities from GMRT which are invariably corrupted by radio frequency interference. The final images used here are the ones with a value of robust = 1 in the imaging task CLEAN for reasons already explained. Since the VLA observations were carried out in the D-configuration (maximum baseline 1 km), the higher resolution observations at 323 and 608 MHz from GMRT (maximum baseline 25 km) were imaged to have the same resolutions as those from the VLA observations by a suitable tapering of the visibilities. All the images were corrected for the respective primary beam attenuations. The higher resolution GMRT observations were examined for possible unresolved sources contaminating the cluster diffuse emission.
3.3 Flux Density Scale
The GLEAM survey is on the flux density scale of Baars et al. (1977) and is accurate to 8 %. The GMRT flux densities are on the Scaife & Heald (2012) scale. These two scales are in agreement to within 3 % (Hurley-Walker et al., 2017). The VLA flux densities are tied to the Perley & Butler (2017) flux density scale which is in agreement with the Scaife & Heald (2012) scale to within 5 %.
| Frequency (MHz) | 74 | 154 | 200 | 323 | 608 | 1520 |
|---|---|---|---|---|---|---|
| Synthesized beam () | 141 x 134, -10 | 173 x 163, -10 | 141 x 134, -10 | 52 x 52 | 52 x 52 | 52 x 52 |
| RMS (mJy beam-1) | 200 | 13.7 | 8.2 | 4.2 | 2.0 | 0.16 |
| A | 600 | 339(36.6) | 149(19.3) | 96(15.8) | 28(6.6) | 0.48 |
| B | 864(200) | 348(43) | 222(32) | 155(29.5) | 66(13.0) | 28(3.0) |
| Source | Identification | Optical | mag | Radio | Separation | |||||||||||
|---|---|---|---|---|---|---|---|---|---|---|---|---|---|---|---|---|
| RA(J2000) | DEC(J2000) | RA(J2000) | DEC(J2000) | |||||||||||||
| hh | mm | ss | ∘ | ′ | ′′ | hh | mm | ss | ∘ | ′ | ′′ | ′′ | ||||
| C | SDSSJ011431.02+002621.4 | 01 | 14 | 31.0 | +00 | 26 | 21 | 1.76 | - | 01 | 14 | 31.00 | 00 | 26 | 19.60 | 1.8 |
| D | SDSSJ011425.58+002932.7 | 01 | 14 | 25.6 | +00 | 29 | 33 | 0.35 | 20.4g | 01 | 14 | 27.00 | 00 | 29 | 39.59 | |
| 01 | 14 | 24.17 | 00 | 29 | 39.59 | |||||||||||
| E | SDSSJ011435.83+003356.9 | 01 | 14 | 35.8 | +00 | 33 | 57 | 0.54 | 21.3g | 01 | 14 | 35.67 | 00 | 33 | 59.60 | 3.5 |
| F | CGCG385-039 | 01 | 14 | 25.7 | +00 | 32 | 10 | 0.04 | 15.5g | 01 | 14 | 25.50 | 00 | 32 | 09.58 | 2.6 |
.
4 Results
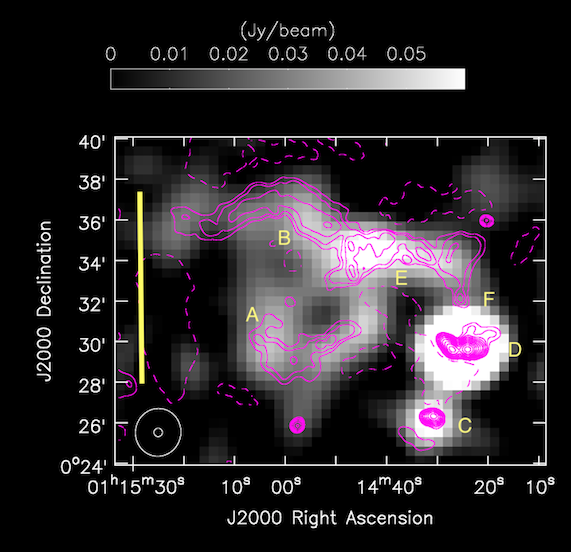
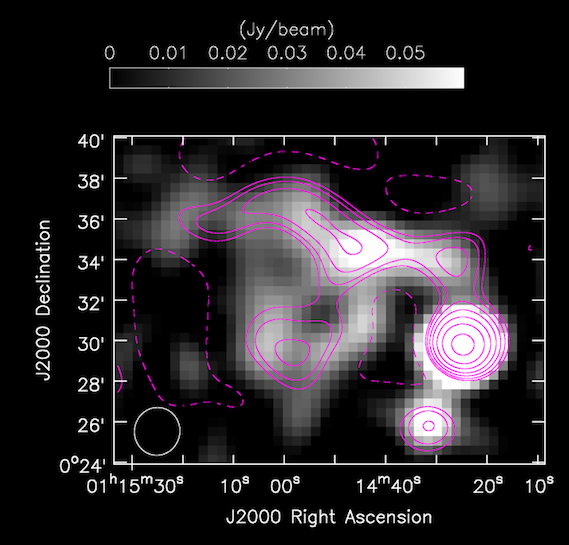
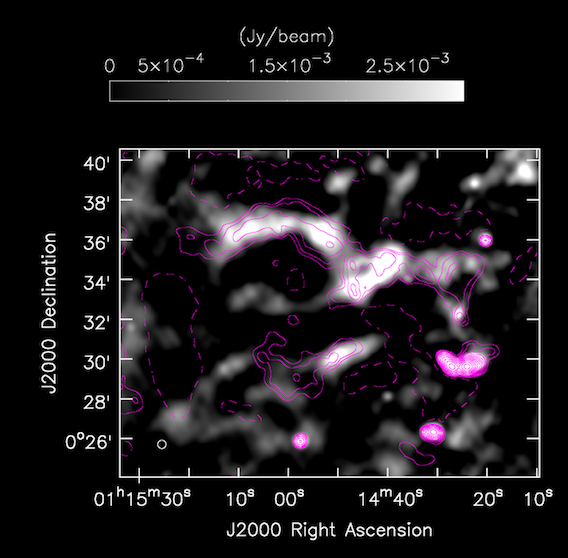
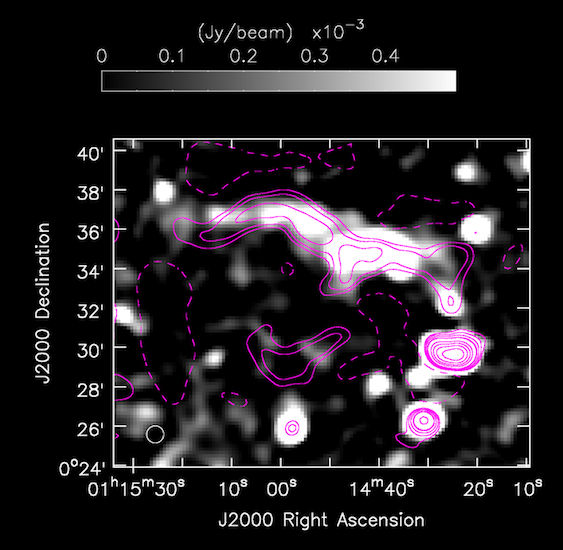
An image at 323 MHz from GMRT is overlaid on the GLEAM 200 MHz image in Fig. 2a. In Fig. 2b the above GMRT 323 MHz image convolved to the same resolution as that of the GLEAM 200 MHz image is shown. In Fig. 2c the 323 MHz image at a resolution of 25 is overlaid on the GMRT 608 MHz image at the same resolution. In Fig. 2d, a 323 MHz image at a resolution of 52 resolution is overlaid on the VLA 1520 MHz image.
The diffuse emission detected in the GLEAM survey can be discussed as two sources A and B, as marked in Fig. 2a. The source B refers to the northern source while source A refers to the southern ring-shaped region. The source B is detected in all the images shown here, while source A is detected at all except in the VLA images. The estimated flux densities of extended sources A and B from these images are given in Table 2. There are two primary sources of errors in the estimation of the flux densities of extended sources. First, there is an error due to the uncertainties in the flux densities of the primary and secondary calibrators at different frequencies. This error is estimated to be 10%. Second, the errors in the flux density estimates of extended sources will be the rms in the image (Table 2) multiplied by the square root of the ratio of the solid angle of the extended source to that of the synthesized beam. Since these two sources of errors are unrelated, they are added in quadrature to estimate the total error on the flux densities of the extended sources (given in parantheses in Table 2).
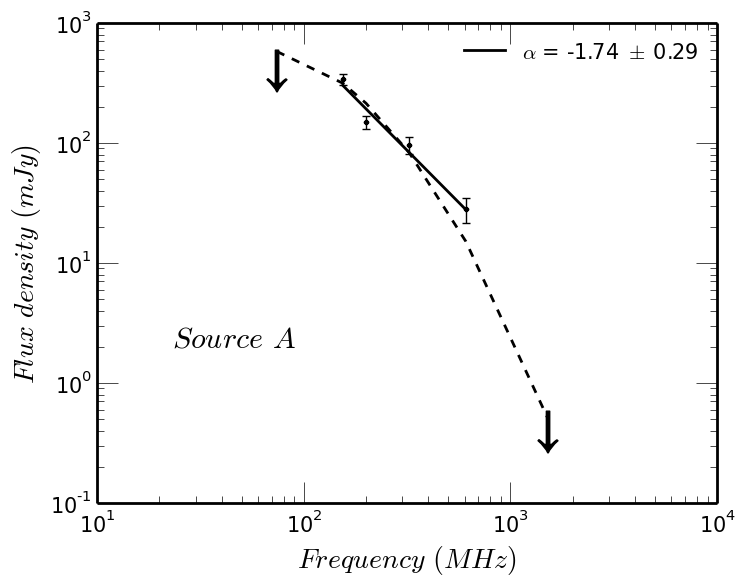
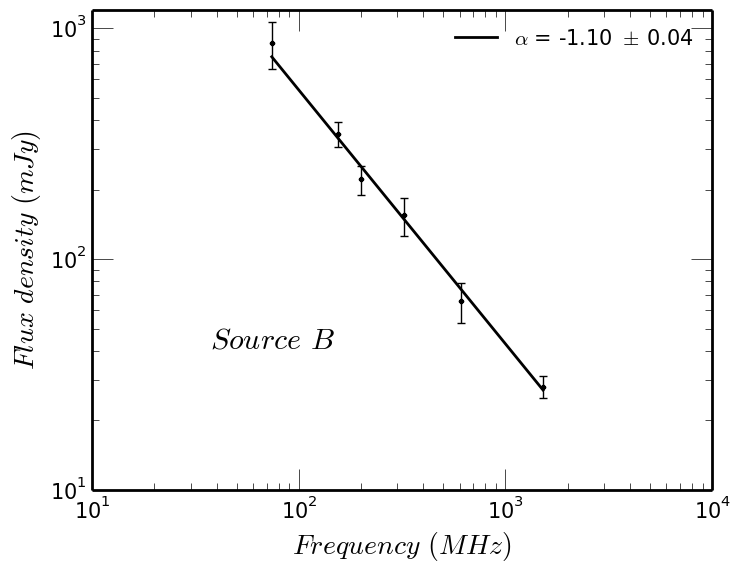
There are no flux density estimates of sources A and B corresponding to the GLEAM survey frequencies at 87.5 and 118 MHz. This is because sources A and B are convolved into one source at these frequencies due to poorer resolution. However, the sum of the extrapolated flux densities of sources A and B at 118 MHz is in agreement within errors of the observed flux density of the convolved source at 118 MHz. The flux density estimate at 74 MHz is from the VLSSr survey at a resolution of 80 (Lane et al., 2014) convolved to the same resolution as the GLEAM survey images at 200 MHz. The measured flux density from VLSSr was scaled down by a factor of 1.1 to be consistent with the Baars et al scale used here (Lane et al., 2014). The flux densities of sources E (S323 = 7.7 mJy, ) and F (S323 = 5.4 mJy, ), which are unrelated to the diffuse source B, but which get convolved into source B at poorer resolutions are subtracted from the estimated flux densities of source B. In any case, the total flux density of sources E and F is less than 10% of that of source B at 323 MHz. Optical identifications for sources C to F are given in Table 3. The spectra of sources A and B are given in Fig. 3.
5 Discussion
There are four discrete sources, C, D, E and F which are near-by (in projection) to the diffuse sources A and B. As can be seen from Table 3, source D is a double radio galaxy with an optical counterpart ( z = 0.35) in between the lobes where the core is presumably situated. Sources C and E are background sources at redshifts of 1.76 and 0.54 respectively. Source F is a cluster member. In the absence of any possible jet connecting this source to the sources A and B, source F does not appear related to them. Furthermore, the region of the sky covering the sources A and B were also searched for any optical and infra-red sources (with or without redshift measurement) that could possibly have supplied fossil plasma, particularly for source A. No such sources were detected.
The elongated (length 800 kpc) source B is located toward the cluster periphery at a distance 700 kpc from the X-ray peak and 900 kpc from the cluster center. The thickness of the relic is 80 kpc and the orientation of the longer dimension of the relic is nearly perpendicular to the major axis of X-ray emission (Fig. 1). The morphology and the location of relic B is not unlike the well-known ‘sausage’ and ‘toothbrush’ relics found in galaxy clusters (van Weeren et al., 2010; van Weeren et al., 2012). The spectral index of the relic in the frequency range 70-1500 MHz is steep (, Fig. 3b), but, is well within the known distribution of spectral indices of relics ( 0.37, Feretti et al. (2012)). The relic A, on the other hand, has a roundish, or a ring-shaped morphology. With an extent of 220 kpc, it is located closer to the X-ray peak at a distance of 400 kpc. The spectrum of relic A appears curved with an exponential cut-off toward higher frequencies and a flattening toward lower frequencies (Fig. 3a). The best-fit power law for the four detections between 150 and 608 MHz implies a spectral index of (Fig. 3a).
5.1 Cluster dynamics and the relics
The role of cluster mergers in producing shocks underlying the radio relics at cluster peripheries is well supported by observational evidences (Giovannini et al., 1999; Bagchi et al., 2006; van Weeren et al., 2009; Venturi et al., 2013). A different class of relics that are proposed to be fading radio galaxy lobes or such lobes revived due to adiabatic compression (Enßlin & Gopal-Krishna, 2001) are also well known to occur in clusters. Examples of relics in this category are in Abell 4038 (Slee & Roy, 1998; Kale & Dwarakanath, 2012) and in Abell 85 (Slee et al., 2001). In A168 we find an arc-like relic at the periphery (B) and a smaller steep spectrum relic (A) in its wake as seen projected in the plane of the sky. The ICM in the cluster is elongated along the north-south direction and the orientation of B is perpendicular to this direction. Merger shock related relics have been found to preferentially be oriented perpendicular to the elongation axis of the ICM (van Weeren et al., 2011). The flat spectral index of B, arc-like morphology and the orientation thus support the scenario that a cluster merger along the north-south direction led to an outgoing merger shock that accelerated electrons which are detected as the relic B. The relic A has a steep and curved spectrum (Fig. 3) indicative of an ageing population of relativistic electrons. We propose that relic A is a candidate adiabatically compressed lobe of a radio galaxy - the compression having been caused by the outgoing shock which is at B. Simulations of adiabatically compressed cocoons of radio galaxies have shown that as the compression proceeds, the cocoon is torn into filamentary structure which can appear like a single torus or multiple tori at late stages (Enßlin & Brüggen, 2002). The morphology of the relic A is complex and filamentary which compares well with the predicted structures of compressed cocoons. The morphology of B is not smooth at the outer boundary but shows kink like features connected to A implying a possible distortion due to the presence of the radio cocoon in the path of the outgoing shock that led to the formation of A.
There is evidence for a binary merger along the north-south direction in A168 based on optical and X-ray observations. Yang et al. (2004) have estimated a merger timescale of 0.6 Gyr assuming the distance between two X-ray peaks to be 676 kpc and a colliding velocity of 600 km s-1. For the relic A, if the break frequency is considered to be at 100 MHz and the magnetic field is assumed to be 1 G, typical of the cluster outskirts (Feretti et al., 2012), the life time due to synchrotron and Inverse Compton losses is 0.24 Gyr. Since the initial age of the radio cocoon which may have formed A is unknown, the estimated age of A could be considered a minimum. The time taken by a shock with a speed of 600 km s-1 to traverse from A to B which is a distance of 320 kpc is 0.5 Gyr. These timescales are comparable to the minimum estimated merger timescale making the proposed scenario plausible.
Measurement of polarization in the relics A and B will provide further evidence for the passage of a shock. Deep X-ray observations towards the relics are also needed to detect the location and strength of the underlying shock.
5.2 Implications of the low mass host cluster
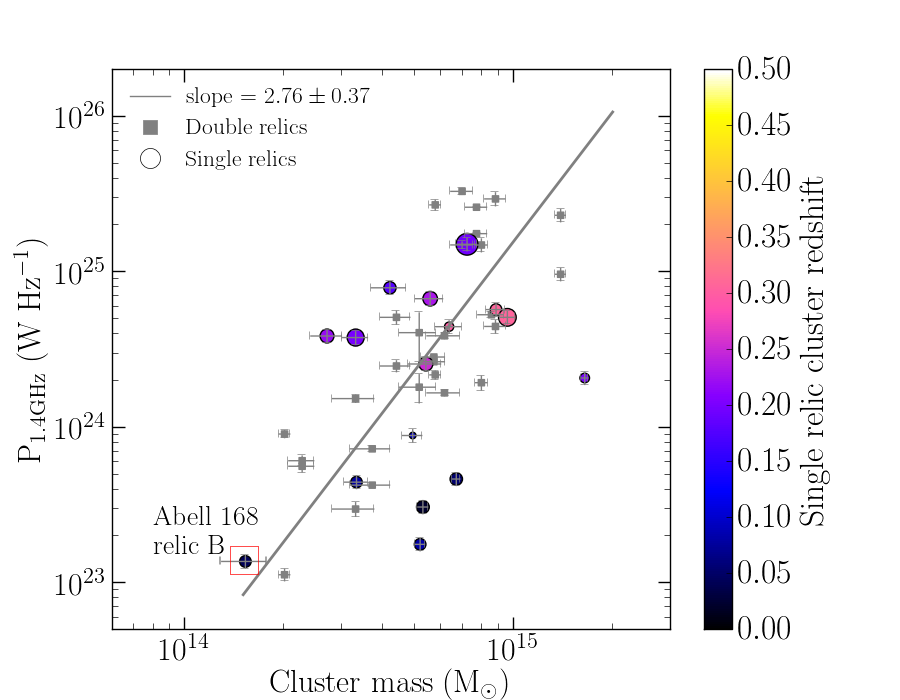
Mergers in massive systems are favoured sites for turbulent re-acceleration of particles leading to radio halos and shocks leading to radio relics (e. g. Cuciti et al., 2015). Radio halos in low mass systems (M M) are not common, but radio relics have been found in low mass systems (de Gasperin et al., 2017; Kale et al., 2017). We show the radio relic power (P1.4GHz) versus host cluster mass scaling with the relic B in A168 plotted (Fig. 4). A168 is the lowest mass system so far known to have radio relics of merger shock origin. The physical mechanism behind the observed empirical relation between P1.4GHz and the host cluster mass is not well understood (de Gasperin et al., 2014). The sample of single relics shows a large scatter around the scaling, however, A168 relic B lies close to the radio power expected according to the scaling relation. A counter relic in A168 may be present but is not detected in our observations. Such counter relics have been found to be factors of 8 or so weaker (e. g. A3365, van Weeren et al. (2011)) and thus may not be detectable. The physical mechanism behind the observed empirical scaling is not known and the relic B in A168 extends it to even lower masses. This indicates that not only does the cluster mass but other factors such as the availability of the seed electrons, the strength of the magnetic field and the merger geometry itself may be playing a role in producing radio relics of certain radio powers.
6 Summary and conclusions
We report the detection of twin radio relics in the low-mass galaxy cluster A168. These relics were discovered in a cross referencing of the MCXC catalogue with the GLEAM survey. We have imaged these relics at 230 and 610 MHz using the GMRT and at 1520 MHz using the VLA. One of the relics (B) is elongated ( 800 kpc), thin ( 80 kpc) and is located towards the northern periphery of the cluster at a distance of 900 kpc from the cluster center. The second relic (A) is ring-shaped, with an extent of 220 kpc and is located near the inner edge of B. Relic B was detected at all the observed frequencies with a radio power at 1.4 GHz of 1.38 W Hz-1 having a power law in the frequency range 70 - 1500 MHz (S). This radio power is in good agreement with that expected from the known empirical relation between the radio powers of relics and the host cluster masses, with the current relic detection from the lowest mass (M500 = 1.241014 Mo) cluster. Relic A has a steeper spectral index () of -1.700.15 in the frequency range 100 - 600 MHz and appears connected to source B. We propose source A to be an old plasma revived due to adiabatic compression by the outgoing shock which produced source B. The orientation of source B, the projected distance between sources A and B, and the radiative life time of source A are consistent with such a scenario. Polarization measurements of source A and B and deeper X-ray observations at the positions of sources A and B will be needed to detect the underlying shock.
7 Acknowledgments
We thank Huib Intema for useful discussions on using SPAM. We thank the referee for a critical reading of the manuscript and constructive criticisms. We thank the staff of the GMRT that made these observations possible. GMRT is run by the National Centre for Radio Astrophysics of the Tata Institute of Fundamental Research. The National Radio Astronomy Observatory is a facility of the National Science Foundation operated under cooperative agreement by Associated Universities, Inc.
References
- Baars et al. (1977) Baars J. W. M., Genzel R., Pauliny-Toth I. I. K., Witzel A., 1977, A&A, 61, 99
- Bagchi et al. (2006) Bagchi J., Durret F., Neto G. B. L., Paul S., 2006, Science, 314, 791
- Briggs (1995) Briggs D. S., 1995, Bulletin of the American Astronomical Society, 27, 1444
- Brunetti & Jones (2014) Brunetti G., Jones T. W., 2014, International Journal of Modern Physics D, 23, 30007
- Brunetti et al. (2007) Brunetti G., Venturi T., Dallacasa D., Cassano R., Dolag K., Giacintucci S., Setti G., 2007, ApJ, 670, L5
- Brunetti et al. (2009) Brunetti G., Cassano R., Dolag K., Setti G., 2009, A&A, 507, 661
- Carilli & Taylor (2002) Carilli C. L., Taylor G. B., 2002, ARA&A, 40, 319
- Cassano et al. (2010) Cassano R., Ettori S., Giacintucci S., Brunetti G., Markevitch M., Venturi T., Gitti M., 2010, ApJ, 721, L82
- Cornwell et al. (2008) Cornwell T. J., Golap K., Bhatnagar S., 2008, IEEE Journal of Selected Topics in Signal Processing, 2, 647
- Cuciti et al. (2015) Cuciti V., Cassano R., Brunetti G., Dallacasa D., Kale R., Ettori S., Venturi T., 2015, A&A, 580, A97
- de Gasperin et al. (2014) de Gasperin F., van Weeren R. J., Brüggen M., Vazza F., Bonafede A., Intema H. T., 2014, MNRAS, 444, 3130
- de Gasperin et al. (2017) de Gasperin F., et al., 2017, A&A, 597, A15
- Donnert et al. (2013) Donnert J., Dolag K., Brunetti G., Cassano R., 2013, MNRAS, 429, 3564
- Enßlin & Brüggen (2002) Enßlin T. A., Brüggen M., 2002, MNRAS, 331, 1011
- Enßlin & Gopal-Krishna (2001) Enßlin T. A., Gopal-Krishna 2001, A&A, 366, 26
- Ensslin et al. (1998) Ensslin T. A., Biermann P. L., Klein U., Kohle S., 1998, A&A, 332, 395
- Feretti et al. (2012) Feretti L., Giovannini G., Govoni F., Murgia M., 2012, A&ARv, 20, 54
- Giovannini et al. (1999) Giovannini G., Tordi M., Feretti L., 1999, New Astron., 4, 141
- Hurley-Walker et al. (2017) Hurley-Walker N., et al., 2017, MNRAS, 464, 1146
- Intema (2014) Intema H. T., 2014, ArXiv e-prints:1402.4889,
- Intema et al. (2009) Intema H. T., van der Tol S., Cotton W. D., Cohen A. S., van Bemmel I. M., Röttgering H. J. A., 2009, A&A, 501, 1185
- Jaffe (1977) Jaffe W. J., 1977, ApJ, 212, 1
- Kale & Dwarakanath (2012) Kale R., Dwarakanath K. S., 2012, ApJ, 744, 46
- Kale et al. (2017) Kale R., Wik D. R., Giacintucci S., Venturi T., Brunetti G., Cassano R., Dallacasa D., de Gasperin F., 2017, MNRAS, 472, 940
- Kang (2017) Kang H., 2017, Journal of Korean Astronomical Society, 50, 93
- Kang & Ryu (2015) Kang H., Ryu D., 2015, IAU General Assembly, 22, 2227971
- Lane et al. (2014) Lane W. M., Cotton W. D., van Velzen S., Clarke T. E., Kassim N. E., Helmboldt J. F., Lazio T. J. W., Cohen A. S., 2014, MNRAS, 440, 327
- Markevitch et al. (2005) Markevitch M., Govoni F., Brunetti G., Jerius D., 2005, ApJ, 627, 733
- McMullin et al. (2007) McMullin J. P., Waters B., Schiebel D., Young W., Golap K., 2007, in Shaw R. A., Hill F., Bell D. J., eds, Astronomical Society of the Pacific Conference Series Vol. 376, Astronomical Data Analysis Software and Systems XVI. p. 127
- Perley & Butler (2017) Perley R. A., Butler B. J., 2017, ApJS, 230, 7
- Piffaretti et al. (2011) Piffaretti R., Arnaud M., Pratt G. W., Pointecouteau E., Melin J.-B., 2011, A&A, 534, A109
- Planck Collaboration et al. (2016) Planck Collaboration et al., 2016, A&A, 594, A27
- Rau & Cornwell (2011) Rau U., Cornwell T. J., 2011, A&A, 532, A71
- Scaife & Heald (2012) Scaife A. M. M., Heald G. H., 2012, MNRAS, 423, L30
- Slee & Roy (1998) Slee O. B., Roy A. L., 1998, MNRAS, 297, L86
- Slee et al. (2001) Slee O. B., Roy A. L., Murgia M., Andernach H., Ehle M., 2001, AJ, 122, 1172
- van Weeren et al. (2009) van Weeren R. J., et al., 2009, A&A, 506, 1083
- van Weeren et al. (2010) van Weeren R. J., Röttgering H. J. A., Brüggen M., Hoeft M., 2010, Science, 330, 347
- van Weeren et al. (2011) van Weeren R. J., Brüggen M., Röttgering H. J. A., Hoeft M., Nuza S. E., Intema H. T., 2011, A&A, 533, A35
- van Weeren et al. (2012) van Weeren R. J., Röttgering H. J. A., Intema H. T., Rudnick L., Brüggen M., Hoeft M., Oonk J. B. R., 2012, A&A, 546, A124
- van Weeren et al. (2017) van Weeren R. J., et al., 2017, Nature Astronomy, 1, 0005
- Venturi et al. (2013) Venturi T., Giacintucci S., Dallacasa D., Cassano R., Brunetti G., Macario G., Athreya R., 2013, A&A, 551, A24
- Yang et al. (2004) Yang Y., Huo Z., Zhou X., Xue S., Mao S., Ma J., Chen J., 2004, ApJ, 614, 692