FRB microstructure revealed by the real-time detection of FRB170827
Abstract
We report a new Fast Radio Burst (FRB) discovered in real-time as part of the UTMOST project at the Molonglo Observatory Synthesis Radio Telescope (MOST). FRB170827 is the first detected with our low-latency ( s), machine-learning-based FRB detection system. The FRB discovery was accompanied by the capture of voltage data at the native time and frequency resolution of the observing system, enabling coherent dedispersion and detailed off-line analysis, which have unveiled fine temporal and frequency structure. The dispersion measure (DM) of 176.80 0.04 pc cm-3, is the lowest of the FRB population. The Milky Way contribution along the line of sight is 40 pc cm-3, leaving an excess DM of 145 pc cm-3. The FRB has a fluence 20 7 Jy ms, and is narrow, with a width of 400 s at 10 of its maximum amplitude. However, the burst shows three temporal components, the narrowest of which is 30 s, and a scattering timescale of s. The FRB shows spectral modulations on frequency scales of 1.5 MHz and 0.1 MHz. Both are prominent in the dynamic spectrum, which shows a very bright region of emission between 841 and 843 MHz, and weaker, patchy emission across the entire band. We show the fine spectral structure could arise in the FRB host galaxy, or its immediate vicinity.
keywords:
radio continuum: transients – instrumentation: interferometers – methods: data analysis1 Introduction
Fast Radio Bursts (FRBs) form a class of extragalactic radio transients, with approximately 30 published since Lorimer et al. (2007) reported the first. The dispersion measures (DMs) of known FRBs currently spans the range pc cm-3 (FRBcat111http://frbcat.org; visited 07/03/2018; Petroff et al. 2016), vastly exceeding the contribution of the Milky Way along their line of sight. FRBs have been detected at the Green Bank Telescope (GBT), the Parkes radio telescope, the Arecibo Observatory, the upgraded Molonglo Observatory Synthesis Telescope (UTMOST) and the Australian Square Kilometer Array Pathfinder (ASKAP) (Lorimer et al. 2007; Keane et al. 2012; Burke-Spolaor & Bannister 2014; Spitler et al. 2014; Petroff et al. 2015; Ravi et al. 2015; Champion et al. 2016; Masui et al. 2015; Keane et al. 2016; Ravi et al. 2016; Petroff et al. 2017; Caleb et al. 2016; Bannister et al. 2017; Bhandari et al. 2018).
Bhandari et al. (2018) have recently estimated the FRB event rate from FRBs found in the HTRU (Keith et al., 2010) and SUPERB (Keane et al., 2018) surveys at Parkes as FRBs ( sr)-1day-1 above Jy ms. At 19 FRBs, this is the largest sample of FRBs found with a single instrument. The authors show that there is no strong evidence that FRBs are other than isotropically distributed on the sky, although the sample size remains small. Macquart & Ekers (2018) found that the slope of the cumulative source count distribution of Parkes FRBs is , implying a non-uniform space density with distance or source population evolution. Larger samples are required to address this issue conclusively, and are expected to become available as facilities like ASKAP (Bannister et al., 2017) and CHIME (Bandura, 2014) reach full FRB search capacity.
Only one of the FRBs reported to date has been found to repeat (FRB121102; Spitler et al. 2016), with the emission showing no sign of an underlying periodicity. The opportunity for repeated targeting of this source has led to a precise localisation using radio interferometers, with FRB121102 pinpointed to a low-metallicity dwarf galaxy at a redshift of (Chatterjee et al., 2017; Tendulkar et al., 2017; Bassa et al., 2017), co-located to within a region mas with a persistent radio source (Marcote et al., 2017). The properties of the host galaxy of FRB121102 are similar to those of the hosts of hydrogen-poor superluminous supernovae (SLSNe-I), leading Metzger et al. (2017) to propose that the repeated bursts from FRB121102 originate from a young magnetar remnant embedded within a young hydrogen-poor supernova remnant which would be at most a few decades old. Michilli et al. (2018) have recently shown that the bursts of FRB121102 exhibit extreme Faraday rotation measures, implying that the source resides in a highly magnetised region.
Many theories have been formulated to explain FRBs, and can be broadly classified as non-cataclysmic and cataclysmic, depending on the fate of the progenitor. Non-cataclysmic theories include giant flares from magnetars (Pen & Connor, 2015), compact objects in young supernovae (Metzger et al., 2017) and supergiant pulses from extragalactic neutron stars (Cordes & Wasserman, 2016). Cataclysmic events include scenarios such as neutron star mergers (Totani, 2013) and “blitzars” which occur when a spinning-down neutron star collapses into a black hole (Falcke & Rezzolla, 2014), releasing the neutron star’s magnetosphere. Cataclysmic models for the events are challenged by the existence of the repeating FRB, although it seems unlikely that FRB121102 is representative of the entire FRB population (Palaniswamy et al., 2018).
A key element to a better understanding of FRBs is to localise them to their host galaxies. We are currently limited to arcmin radius localisations of FRBs at Parkes, GBT and ASKAP, or narrow fan-beam localisations with UTMOST which are 5 arcsec 1.2 degrees. Plans are currently afoot at UTMOST (the UTMOST-2D project), ASKAP (Bannister et al., 2017), MeerKAT, and the Very Large Array (Law et al., 2015), to achieve localisations ranging from a few square arcminutes to a square arcsecond or less. The North-South arm of the Molonglo telescope, which crosses at right angles relative to the East-West, is currently being fitted out to approximately the same sensitivity (fluence Jy ms for a 1 ms burst) as the East-West arm. The localisation that these facilities plan to deliver in the coming 24 months is in the range of 10 arcsec down to sub-arcsecond scales, which permits host galaxy identifications for FRBs depending on the source redshift (Eftekhari & Berger, 2017).
Contingent to source localisation at UTMOST is the capacity to do real-time detection of FRBs. Due to the RFI (Radio Frequency Interference) environment at the site, it is advantageous to use a machine-learning-based system to avoid false triggers so that voltage data can confidently be recorded when FRB events occur. We have developed such a system, and the FRB reported here is our first detection since the system sensitivity was improved substantially by hardware changes implemented in July 2017. Recording voltages preserves amplitude and phase information about the incident electromagnetic radiation. Hence, voltage capture not only leads to superior localisation of the FRB, but it also gives remarkable temporal and frequency resolution relative to our now superseded system.
In this paper we report the first FRB for which a voltage capture has been achieved after a real-time discovery. In section 2, we describe Molonglo’s observing setup, and the real-time pipeline. We report the discovery of FRB170827 in section 3. The analysis of the dynamic spectrum and pulse profile of the FRB is presented in section 4. In section 5, we present the conducted multiwavelength followup. We discuss our results in section 6.
2 Observations and the UTMOST data capture system
The UTMOST is an on-going project to transform MOST, a radio interferometer located near Canberra, Australia, into an FRB finder (Bailes et al., 2017). The 1.6 km extent of UTMOST reflector is divided into 352 “modules”, where each module consists of 22 ring antennas that select a single right circular polarisation and allow the module beam to be steered. The central observing frequency of Molonglo is 835 MHz and the total bandwidth is 31.25 MHz. Since 2017 July, we have been operating the UTMOST telescope as a transit facility, and steering of the array away from the meridian has been sacrificed for better sensitivity. The mechanical system responsible for phasing these antennas away from the meridian was approaching end-of-life and had become unreliable when slewing, such that the sensitivity had fallen well below that in early 2016 when three FRBs were discovered (Caleb et al., 2016). With the switch to transit mode, the telescope sensitivity improved approximately three-fold. The system is proving to be very stable, with phasing calibration of the system required only a few times weekly.
2.1 Real-time analysis and voltage capture
The real-time FRB analysis system, at its core, comprises a GPU-based single-pulse processing software, HEIMDALL222https://sourceforge.net/projects/heimdall-astro/. The input to HEIMDALL is the high resolution filterbank data (327.68 s, 97.66 kHz, 8 bit) for each of the 352 fan-beams: equally spaced tied array beams that cover the field of view of an individual UTMOST module. HEIMDALL searches the fan-beam data streams, spread across 8 GPUs. The software performs dedispersion (from 0 to 2000 pc cm-3) and matched filtering (from 327.68 s to 83.886 ms), and reports time-stamped FRB candidates. Since part of the UTMOST operating spectrum is allocated to mobile phone communications, the vast majority of FRB candidates are artifacts, numbering tens of thousands per night. The system was thus extended by a supervised machine-learning algorithm, based on random forest (Breiman, 2001), in order to perform real-time candidate classification. The model was trained on single pulses from various pulsars, and on RFI-generated candidates, achieving an accuracy of 98.8% (10-fold cross-validation). To perform classification, the model is specified by predefined features, extracted from the input data stream of a given candidate. These features are DM and S/N agnostic, and sufficient to characterise the RFI activity during an event, the noise statistics, and the validity of the candidate. The details of the pipeline will be presented in a subsequent paper.
Application of the pipeline reduced the number of candidates to a manageable number, 10 a day, the first step to making voltage capture a possibility. Channelised voltages are buffered in Random Access Memory for 24 seconds, sufficient to perform real-time beam-forming, single pulse searching and classification. Upon a trigger, a voltage capture around an interesting event is performed, while accounting for dispersive delay and allowing a narrow buffer window for baseline estimation. The captured data are the channelised, critically sampled voltages from each antenna that have not been subject to any RFI mitigation. An email is then issued to human inspectors for a final assessment of the candidate.
3 Discovery of FRB170827
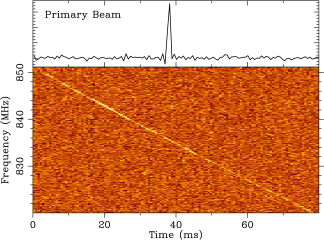
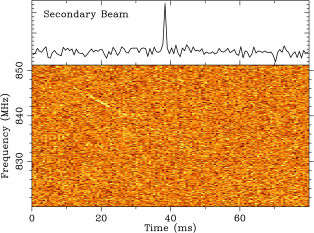
Fig. 1 shows the dynamic spectrum for the FRB at its detection resolutions of 327.68 s and 97.66 kHz. After correcting for the effect of interstellar dispersion, and averaging across the frequency axis, the event S/N at this time resolution was 48. Within seconds, it was evaluated as an FRB candidate by our machine-learning system, triggering an email alert and a voltage capture of ms around the event. A failure of the plotting routine (ironically due to the very high S/N of the event, and since corrected) meant that FRB170827 was only identified as a bona fide FRB three days after the event, which limited immediate follow-up at other wavelengths. The result was issued as Astronomer’s Telegram ATel 10697 (Farah et al., 2017).
| Event UTC | 2017-08-27 16:20:18.1 |
|---|---|
| Fan-beam number | 92 |
| S/N (detection fan-beam) | 48 |
| S/N (coherently dedispersed) | 110 |
| Sampling time | 327.68 s |
| Detection Filter | 1 (655.36 s width) |
| Best-fitting (h:m:s) | 00:49:18.66 (J2000) |
| Best-fitting (d:m:s) | 65:33:02.5 (J2000) |
| Galactic longitude | 303.29∘ |
| Galactic latitude | 51.58∘ |
| (lower limit)* | Jy |
| Observed Fluence (lower limit)* | Jy ms |
| Width (at 10 maximum) | 400 s |
| Refined DM | 176.80 0.04 pc cm-3 |
| Galactic DM (NE2001) | 37 pc cm-3 |
| Galactic DM (YMW16) | 26 pc cm-3 |
-
*
Corrected for the known position of the FRB within the primary beam pattern in the East-West direction, but uncorrected for the (unknown) FRB position in the north-south direction.
The event was seen in 2 fan-beams only (Fig. 1), consistent with celestial sources and the spacing of our fan-beams on the sky. We searched all other fan-beams for similar events in time and dispersion measure, finding none above a S/N of 8. The voltage data were particularly clean around the time of the event, as expected in the very early morning hours (local time 2 AM) on site, as RFI locally is dominated by mobile handset traffic.
Molonglo’s backend supports a mode in which saved voltages can be read and processed from disk, rather than live from the telescope. Voltages allow us to make an improved localisation of the FRB, as we can place fan-beams on the sky arbitrarily. We placed 352 fan-beams across 0.04 deg (beam spacing of degrees) covering the two detection fan-beams, compute the S/N of the FRB in each, and fit for the sky position which maximises S/N. The best-fitting central position for the FRB is = 00:49:17.68, 65:33:02.5 (J2000). Our localisation region is of order 5 arcsec (1-sigma) in the east-west direction, but is constrained only by the telescope primary beam in the north-south direction, with 1-sigma localisation error of 1.2 degrees. The localisation arc can be described as:
| (1) |
where is in hours, is in deg, and is valid in the range [0.81, 0.84]. Once the position was optimized, the voltages were streamed through the system again to form a tied-array beam on the target position. The signal was coherently dedispersed over a range of DMs, including a correction for the system gain as a function of frequency (using weights previously obtained from the bright southern pulsar J16444559), to determine the DM that maximizes the S/N ratio of the event. We obtain a DM of 176.80 0.04 pc cm-3 and an S/N of 110 (compared to S/N = 48 obtained in the detection fan-beam).
The event was sufficiently bright in the detection fan-beam to saturate of the 8 bit, high-resolution filterbank data samples (resolution 327.68 s, 97.66 kHz) in a ms window centered on the event. This is the primary reason for the substantial enhancement in the S/N from 48 to 110: the much higher dynamic range in the voltage data allows us to fully recover the lost flux density. This loss of signal is expected as the parameters used to scale the data stream down to 8-bits are optimised to maximise our sensitivity to S/N events, while not limiting our ability to discover bright events. The S/N improvement is also, to a lesser extent, due to the use of coherent dedispersion, localisation of the event within the primary beam, solving for an optimal DM and improved time resolution of this narrow event.
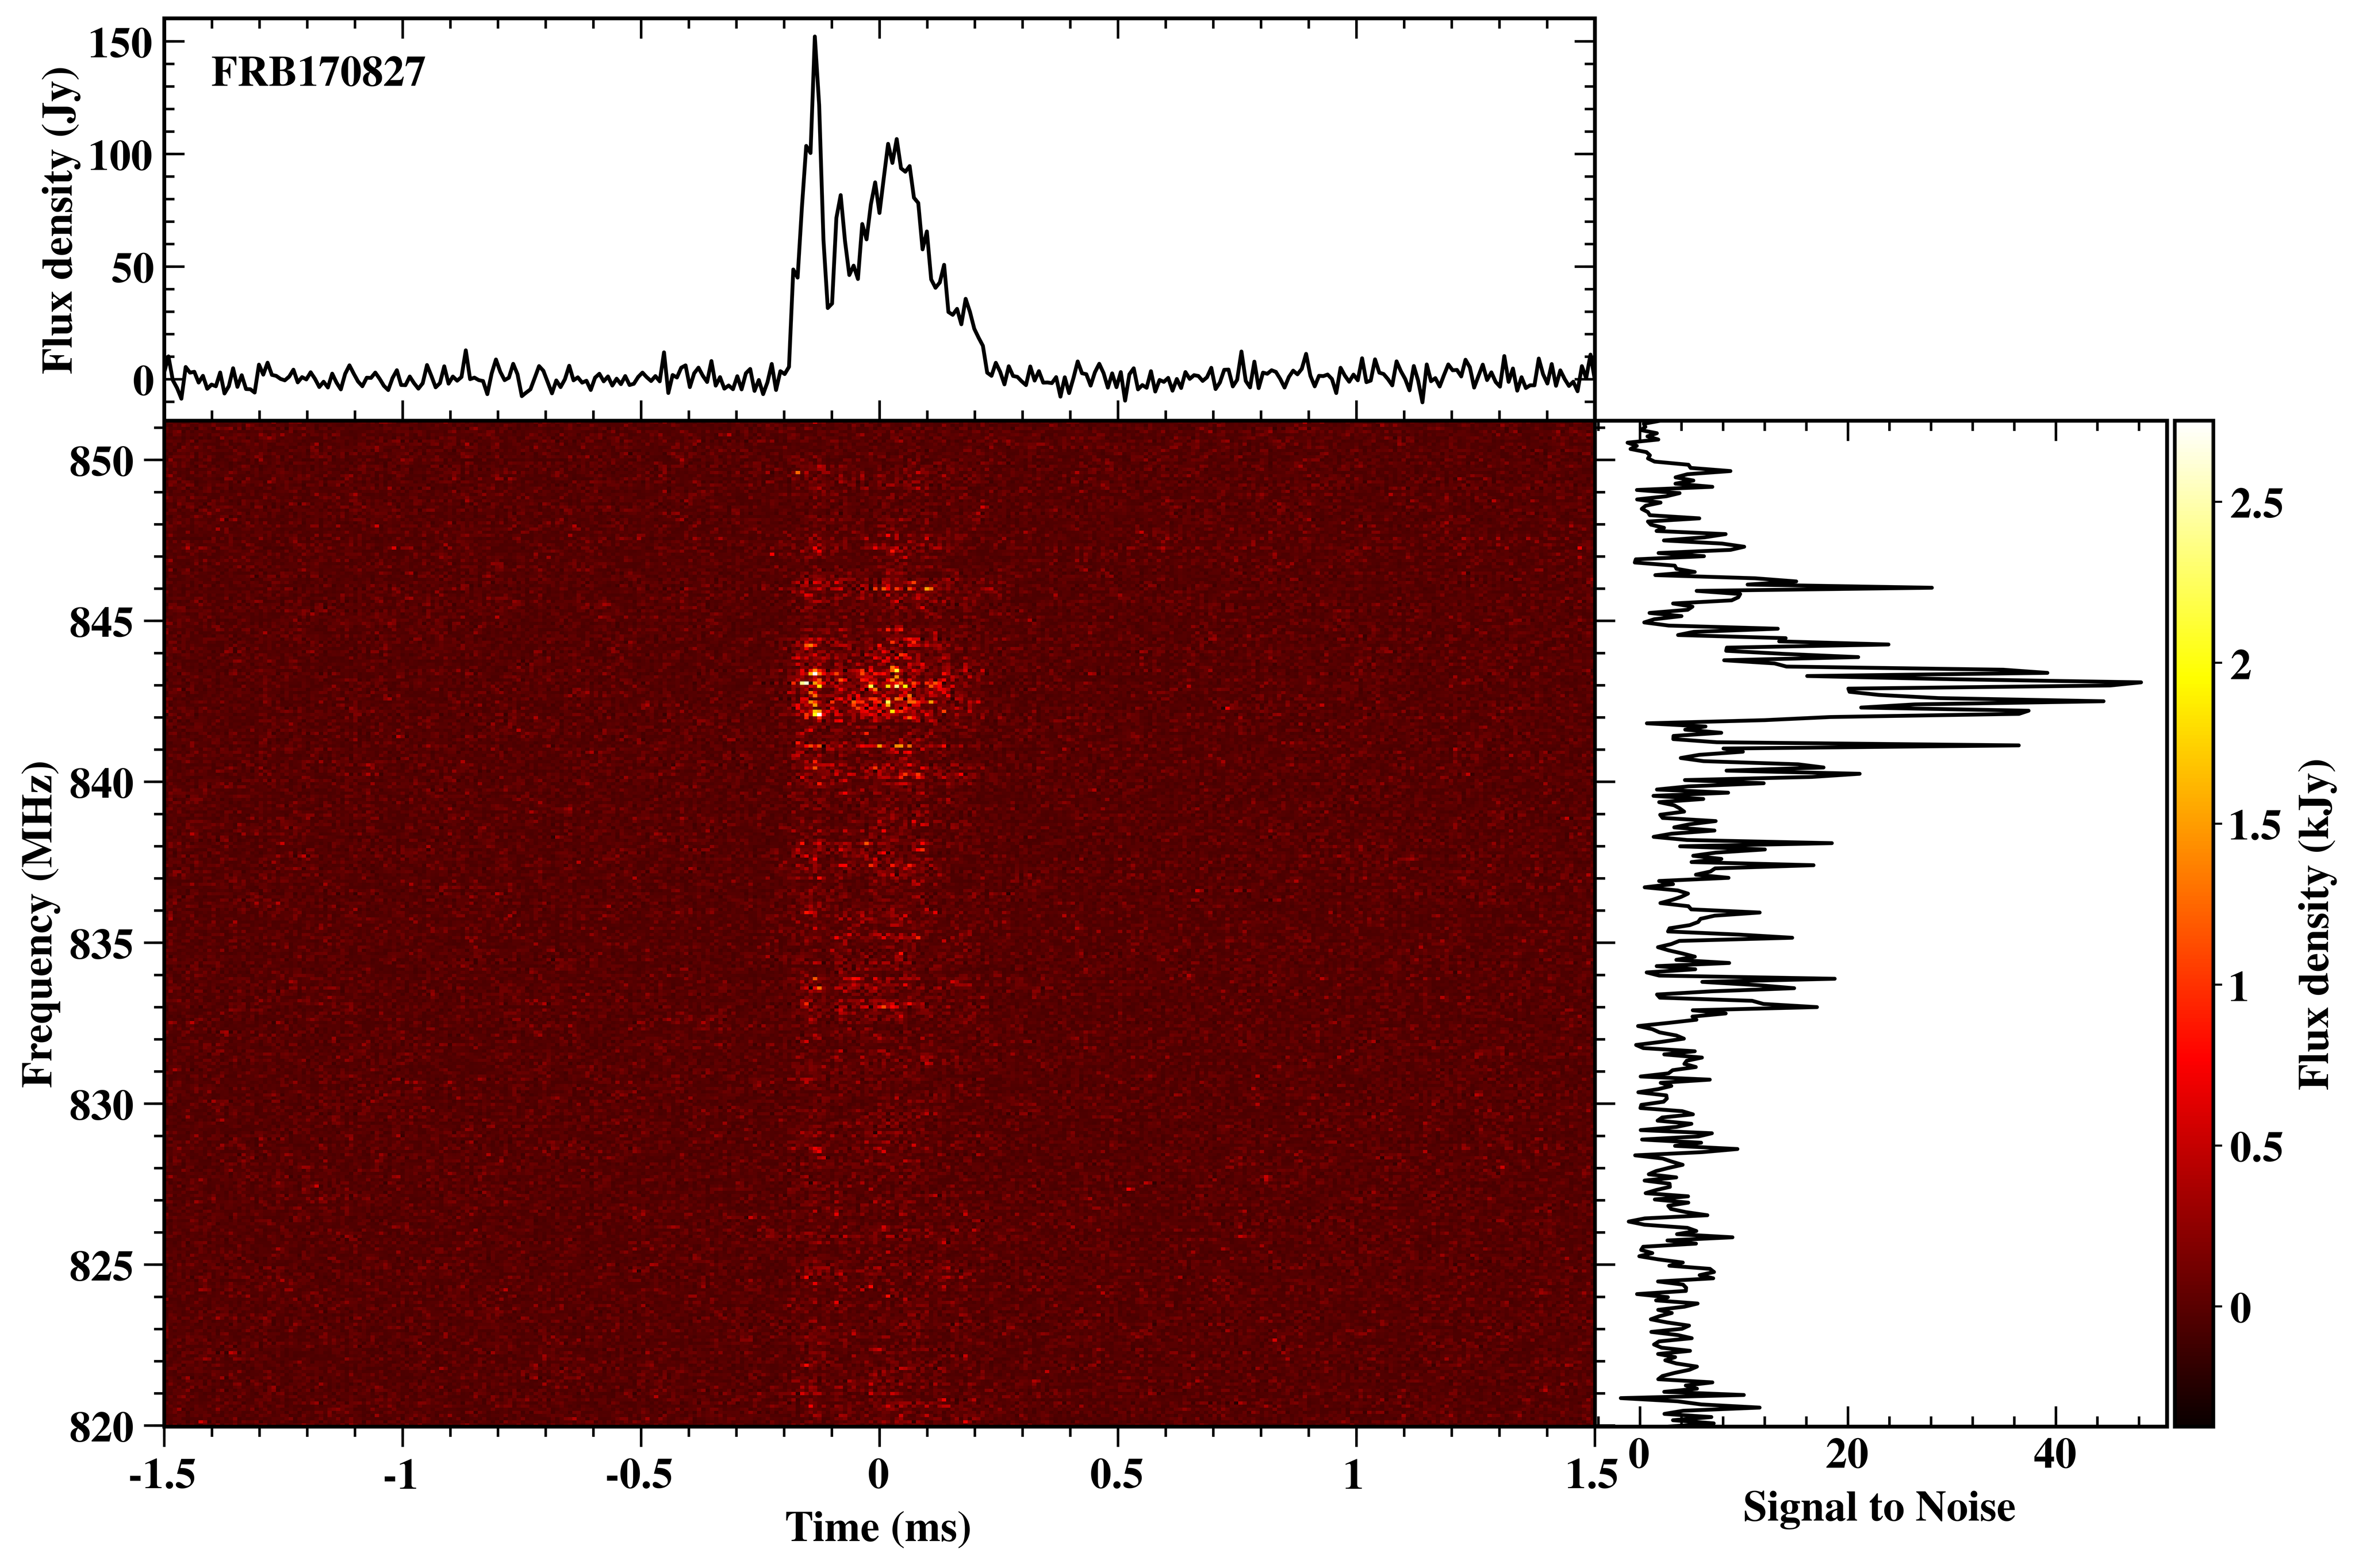
Fig. 2 shows the event at resolutions of 10.24 s and 97.66 kHz, after coherent dedispersion and bandpass correction.
The DM estimate for the Galaxy contribution along the FRB’s line of sight is 37 pc cm-3 using the NE2001 model (Cordes & Lazio, 2002) and 26 pc cm-3 using the YMW16 model (Yao et al., 2017). This results in an average DM excess of pc cm-3 for the FRB, the lowest value for any FRB published. The upper limit on the DM-inferred redshift is thus (Inoue, 2004). The observational properties of FRB170827 are listed in Table 1.
3.1 Possible SMC Origin?
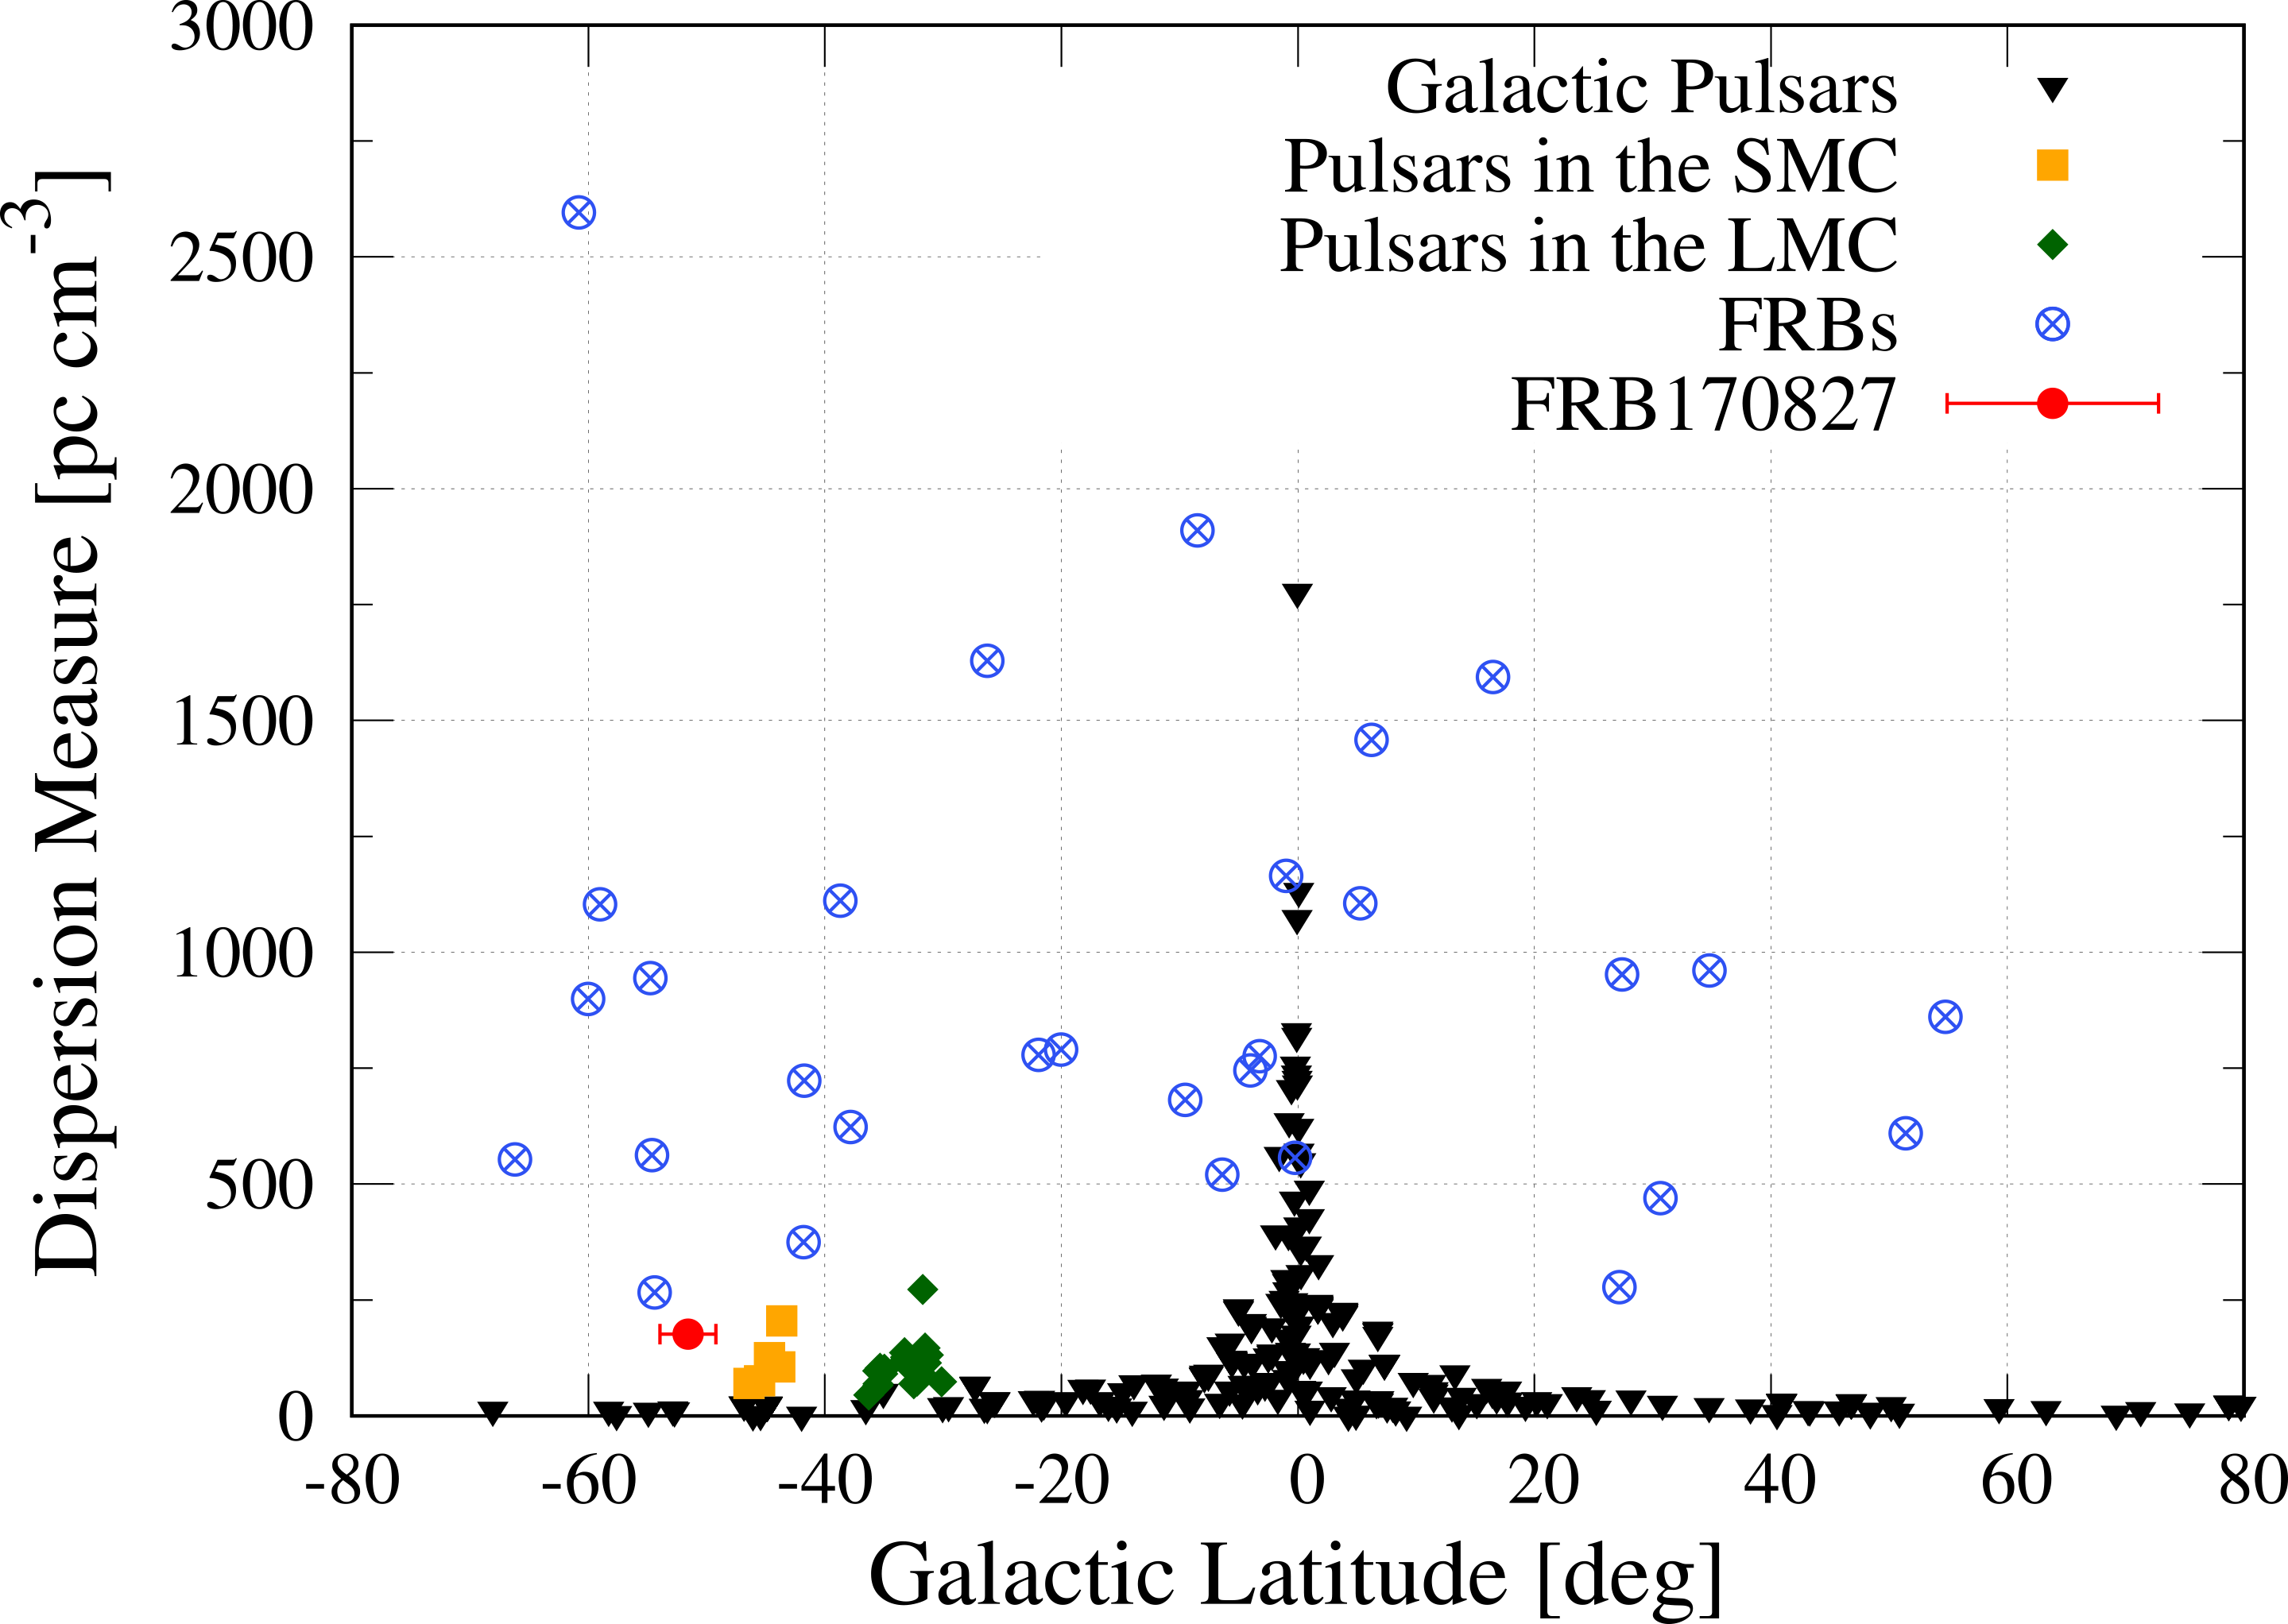
The boresight position of FRB170827 lies degrees ( the primary beam half-width half-power) north of the Small Magellanic Cloud (SMC), such that the extension of the localisation arc (given by Eq. 1) southward intersects with the central regions of the SMC. The DM of the event is similar to the DM of pulsars in the central regions of the SMC, leading us to question whether the source could be in the SMC and we have seen a bright event in a side-lobe. In Fig. 3 we show the DM distribution as a function of Galactic latitude of FRBs published to date, compared with pulsars in the Milky Way, and in the Small and Large Magellanic Clouds respectively, showing that FRB170827 overlaps in DM with pulsars in the SMC. Tests of the scenario that FRB170827 is a far sidelobe detection were carried out in the week following the event, in which the telescope was moved 7 degrees south of the bright southern pulsar Vela, searching for single pulse events. We found that 7 degrees off boresight to the south of Vela, occasional pulses could be seen from Vela at a S/N of a few percent of the boresight S/N. The pulses were detected in one or two adjacent fan-beams, making them otherwise indistinguishable from boresight detections. We estimate that if the source were actually in the SMC, it could be detected at boresight with a S/N 1000, and would have a peak flux density of kJy. It is likely that a source capable of such pulses in the SMC would have given off large numbers of fainter pulses that should have been seen in extant SMC surveys (e.g. Manchester et al., 2006). We therefore consider it unlikely that FRB 170827 resides in the SMC. Pulsar wind nebulae were also searched for along the localisation arc, and none were found333Roberts, M.S.E., 2004, ‘The Pulsar Wind Nebula Catalog (March 2005 version)’, McGill University, Montreal, Quebec, Canada (available on the World-Wide-Web at http://www.physics.mcgill.ca/~pulsar/pwncat.html)..
4 Analysis of FRB170827
Voltage data were captured for 270 ms encompassing the event, and allowed us to examine the FRB’s temporal and frequency structure with much higher resolution than for all of the non-repeating published FRBs. The dynamic spectrum of the FRB displayed in Fig. 2 shows a region of enhanced emission between 841 and 843 MHz, striations on a scale of 100 to 200 kHz and “spiky” emission features which can be brighter than 1 kJy. Interestingly, the latter two features are similar to what is seen in FRB150807 (Ravi et al., 2016).
4.1 Spectral Modulation
Point-like radio sources scintillate due to propagation through inhomogeneous dispersive media. To measure the scintillation effects, we construct the frequency auto-covariance function (ACF) of the spectrum :
| (2) |
where , with being the mean flux density, and the number of frequency channels. The zero lag value, associated with self noise, was excised from the auto-covariance function. The ACF was then normalised by its maximum and fitted by a Gaussian function of the form:
| (3) |
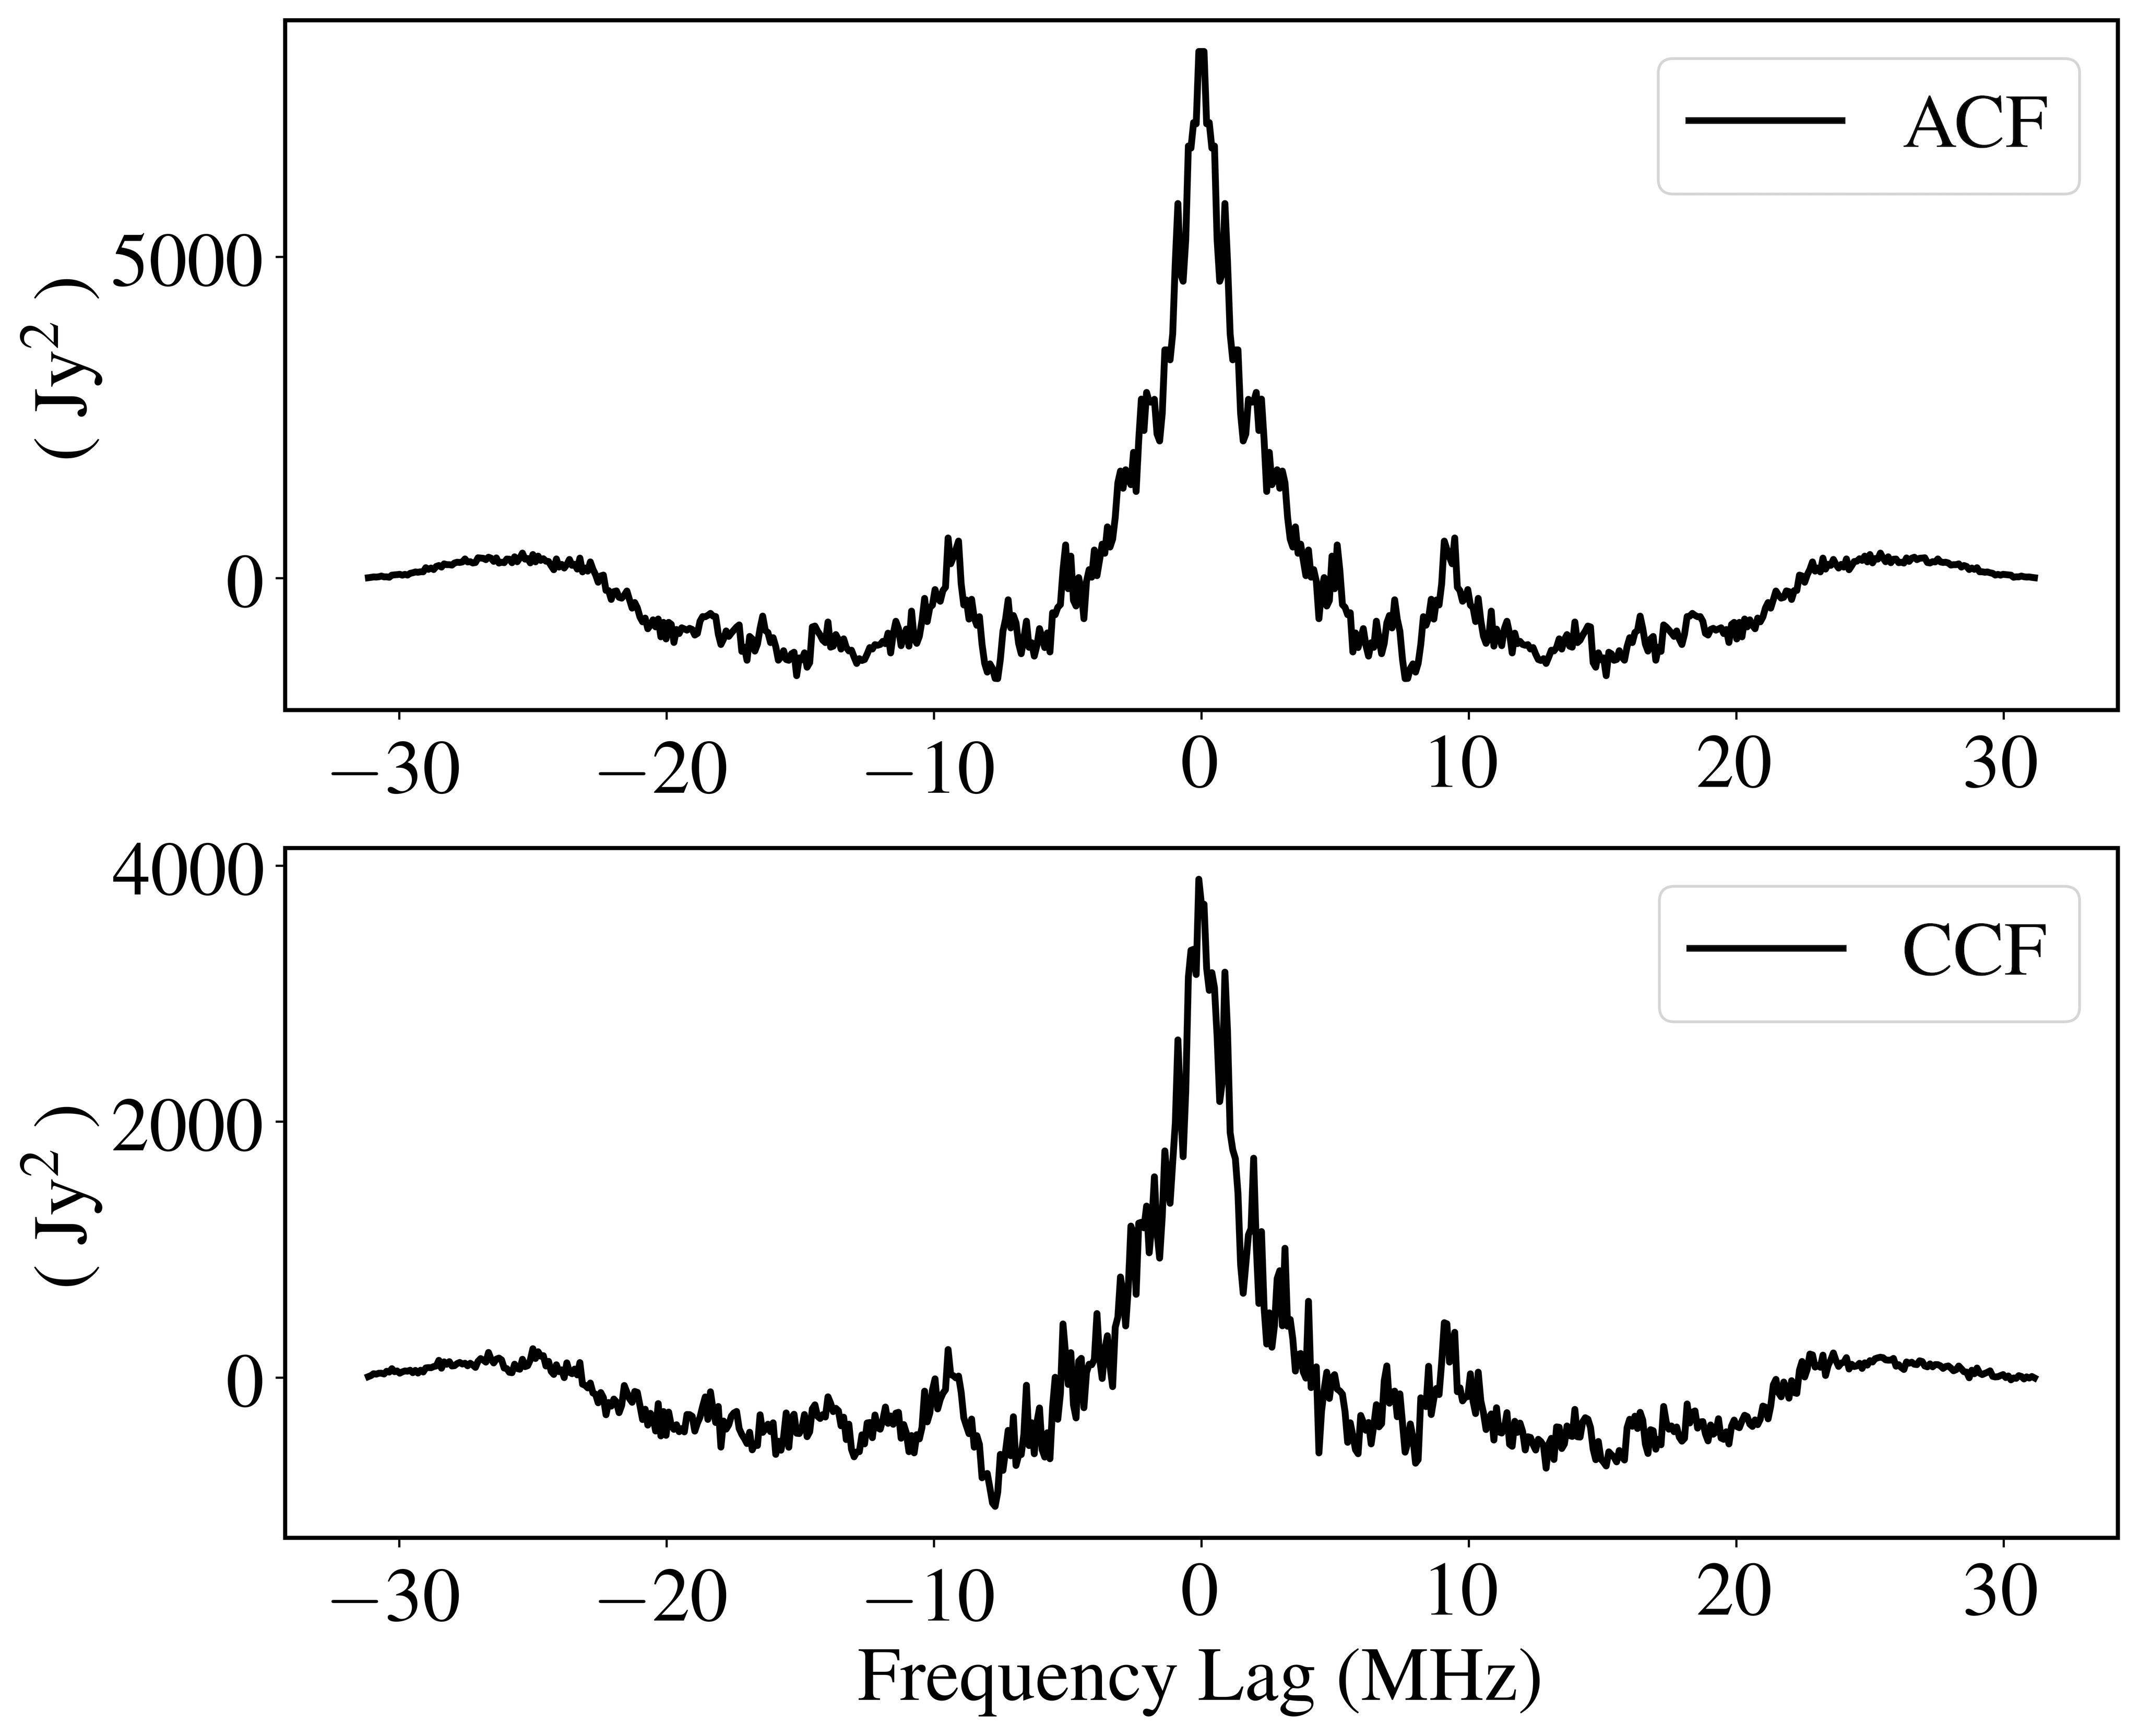
The constructed ACF is shown in Fig. 4. The decorrelation bandwidth, , is usually defined as the frequency lag where the ACF decays to half power (Cordes, 1986). The computed MHz is consistent with what is expected along the line of sight, as shown by the NE2001 model, where 0.8 MHz at 835 MHz. In Fig. 4, we show the cross-covariance function (CCF) of the spectra of the leading and trailing features of the temporal profile (see § 4.2). The CCF peaks at zero-lag, and shows only modest asymmetry that is consistent with arising from sample variance and noise. If the scintillation patterns are identical between the two feature windows, the ACF and CCF would have the same shape (Cordes et al., 1983). We conclude that the dynamic spectrum of FRB170827 is consistent with arising from scintillation.
Another notable feature of the dynamic spectrum of FRB170827 is the 100-200 kHz wide striations seen across the pulse profile. These cannot be explained by a passage through the ISM, as they are an order of magnitude narrower than is expected for the line of sight for the NE2001 model. Below, we consider the possibility that they arise in a second scattering screen, well outside the Milky Way.
Interstellar scintillation can amplify pulsars and FRBs that are otherwise beneath detection thresholds and make them detectable. FRB170827 was well above our detection threshold however, and even saturated our detector system in some channels prior to analysis of the voltage data. A fainter version of FRB170827 might have only been visible across MHz, and may have been overlooked by our search algorithms. Searches for narrow-band FRBs may unveil more events if they can still be differentiated from terrestrial interference.
4.2 Profile Temporal Structure
Apart from the repeating FRB, no other FRB has been studied at this timescale due to limitations set by DM smearing (e.g. Bhandari et al. 2018). Although FRB170827 is much narrower than most FRBs (Ravi, 2017), this might just be an observational bias due to its small level of DM smearing.
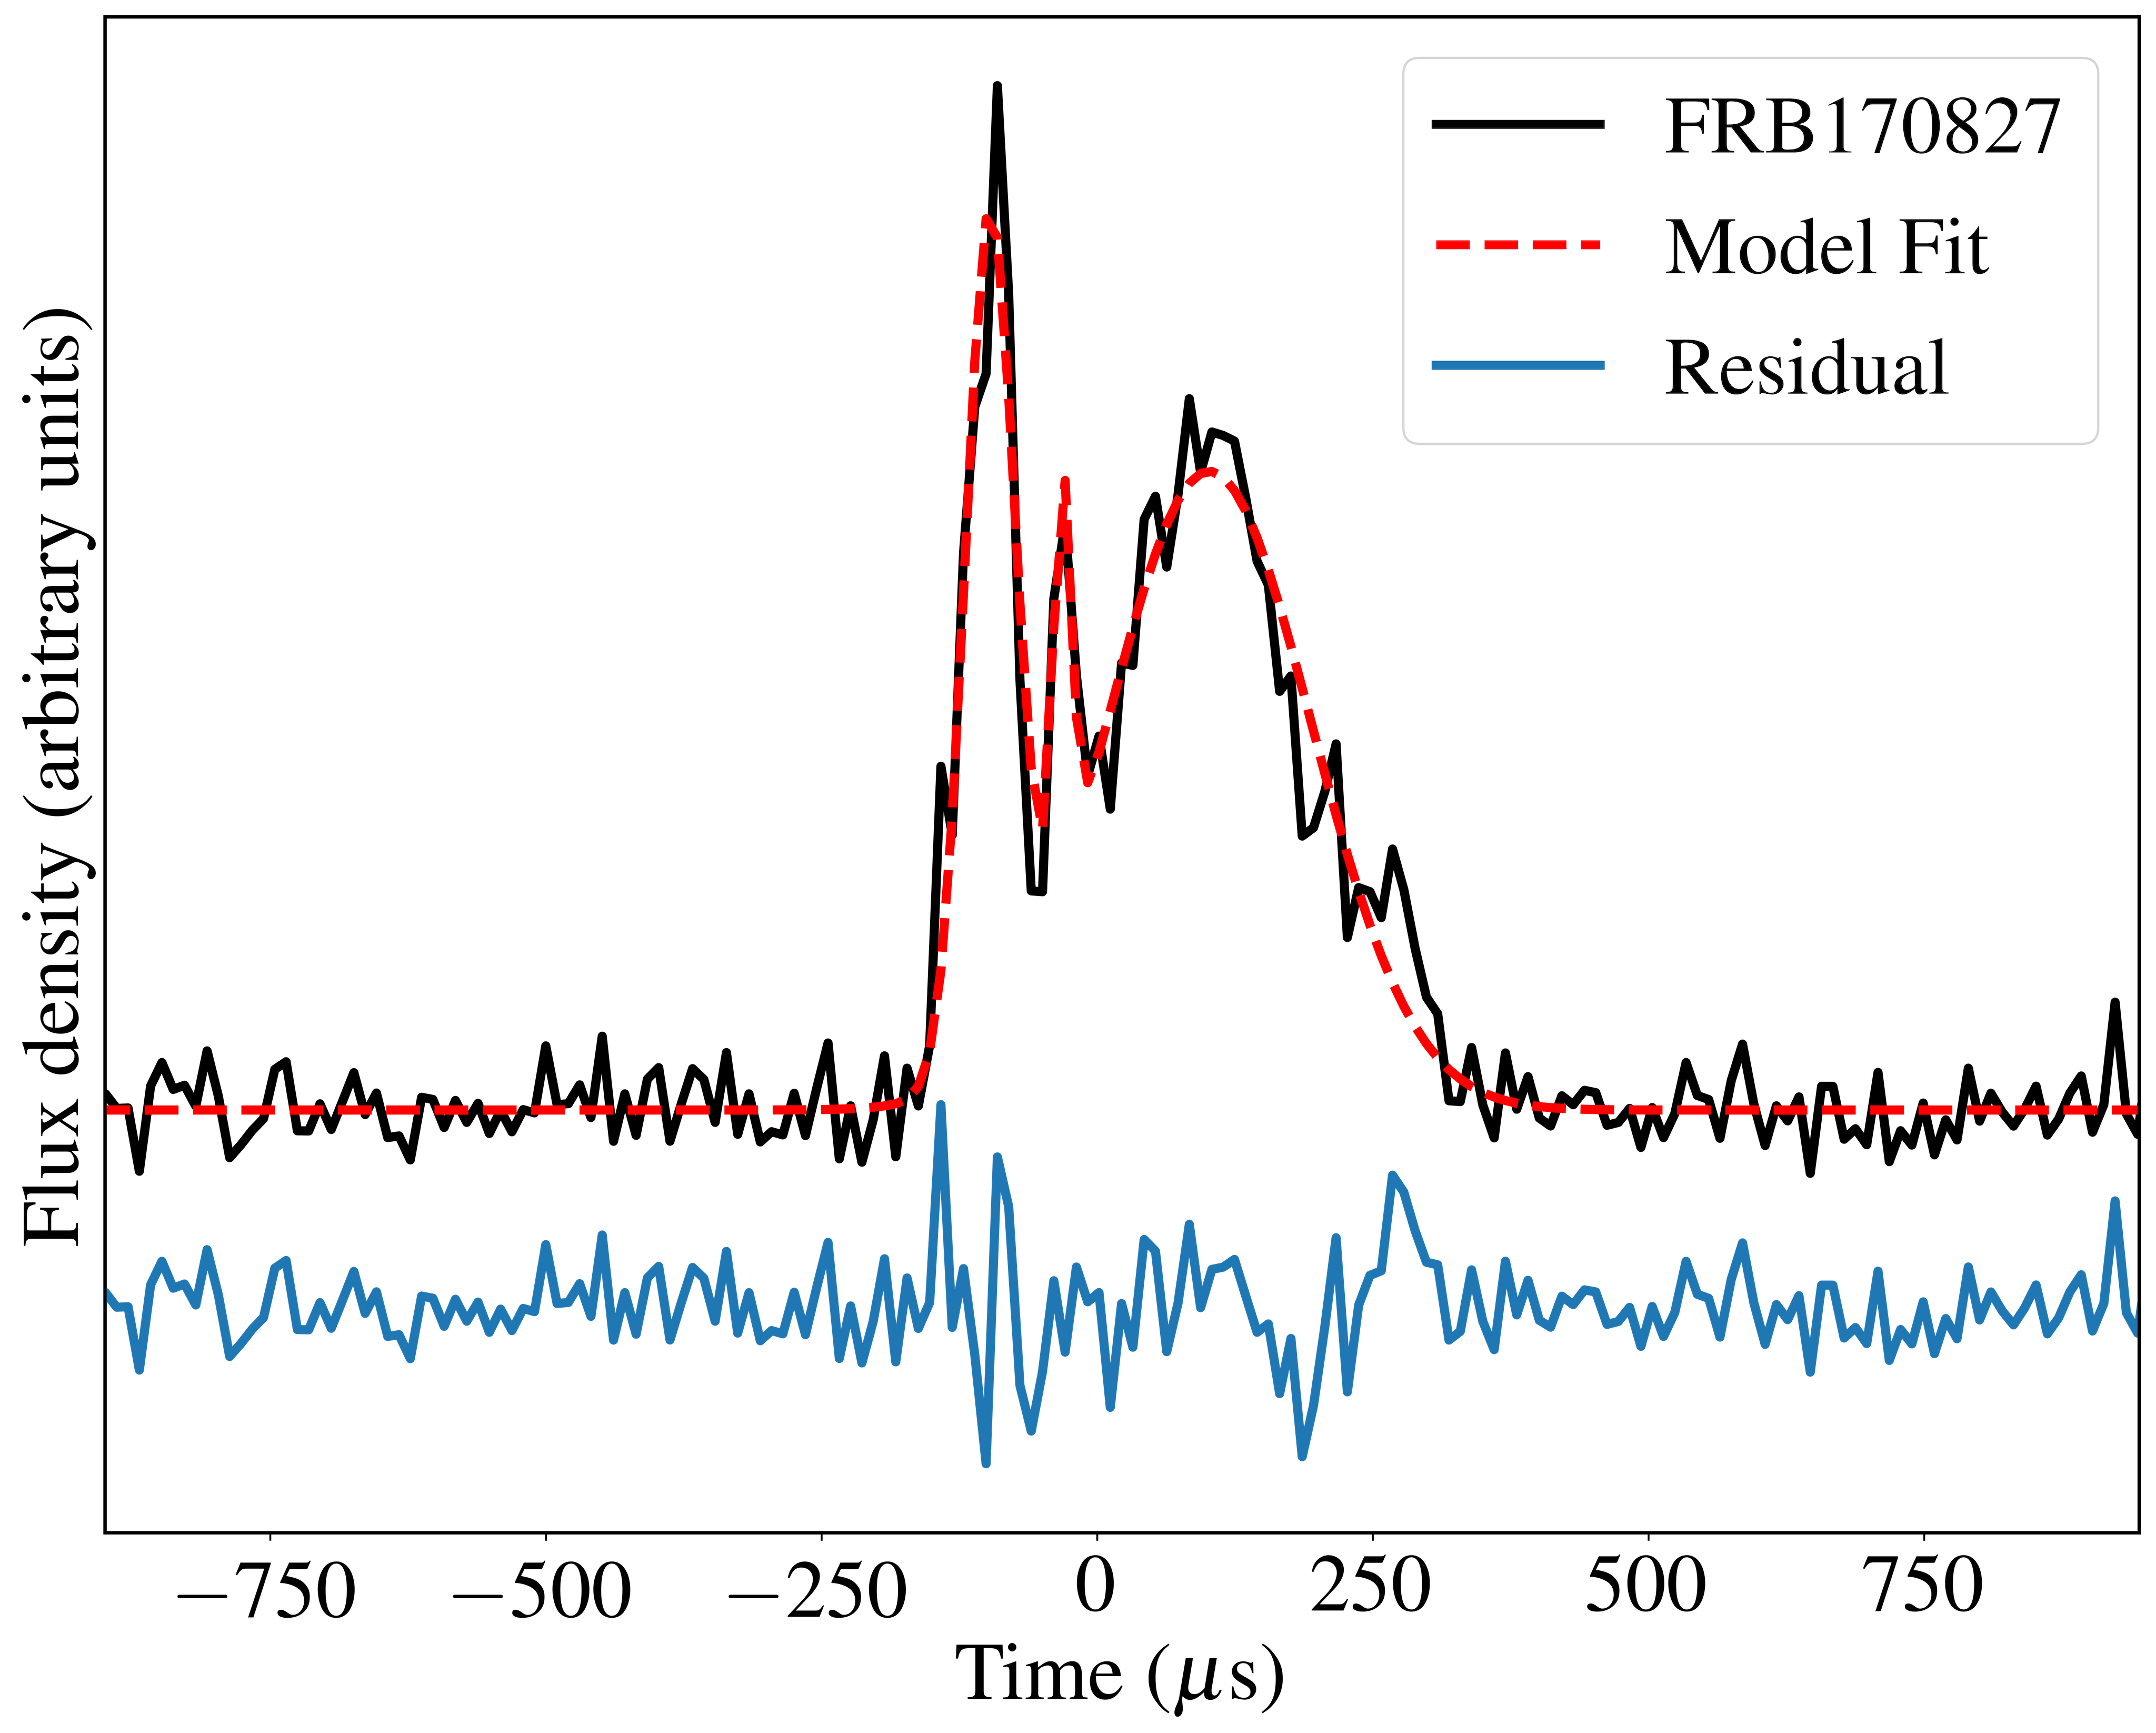
The frequency-averaged pulse profile of the burst shows temporal modulation of the order of tens of microseconds and the profile can be divided into three different components: a sharp leading feature with a peak flux density Jy and width 50 s, an intermediate feature, and a trailing feature. While most FRBs appear to have a single temporal component, some have shown multiple peaks (e.g. FRB121002; Champion et al. 2016). The pulse profile was fitted with a model described by the summation of three Gaussian profiles, each convolved with a one-sided exponential, of the form:
| (4) |
| (5) |
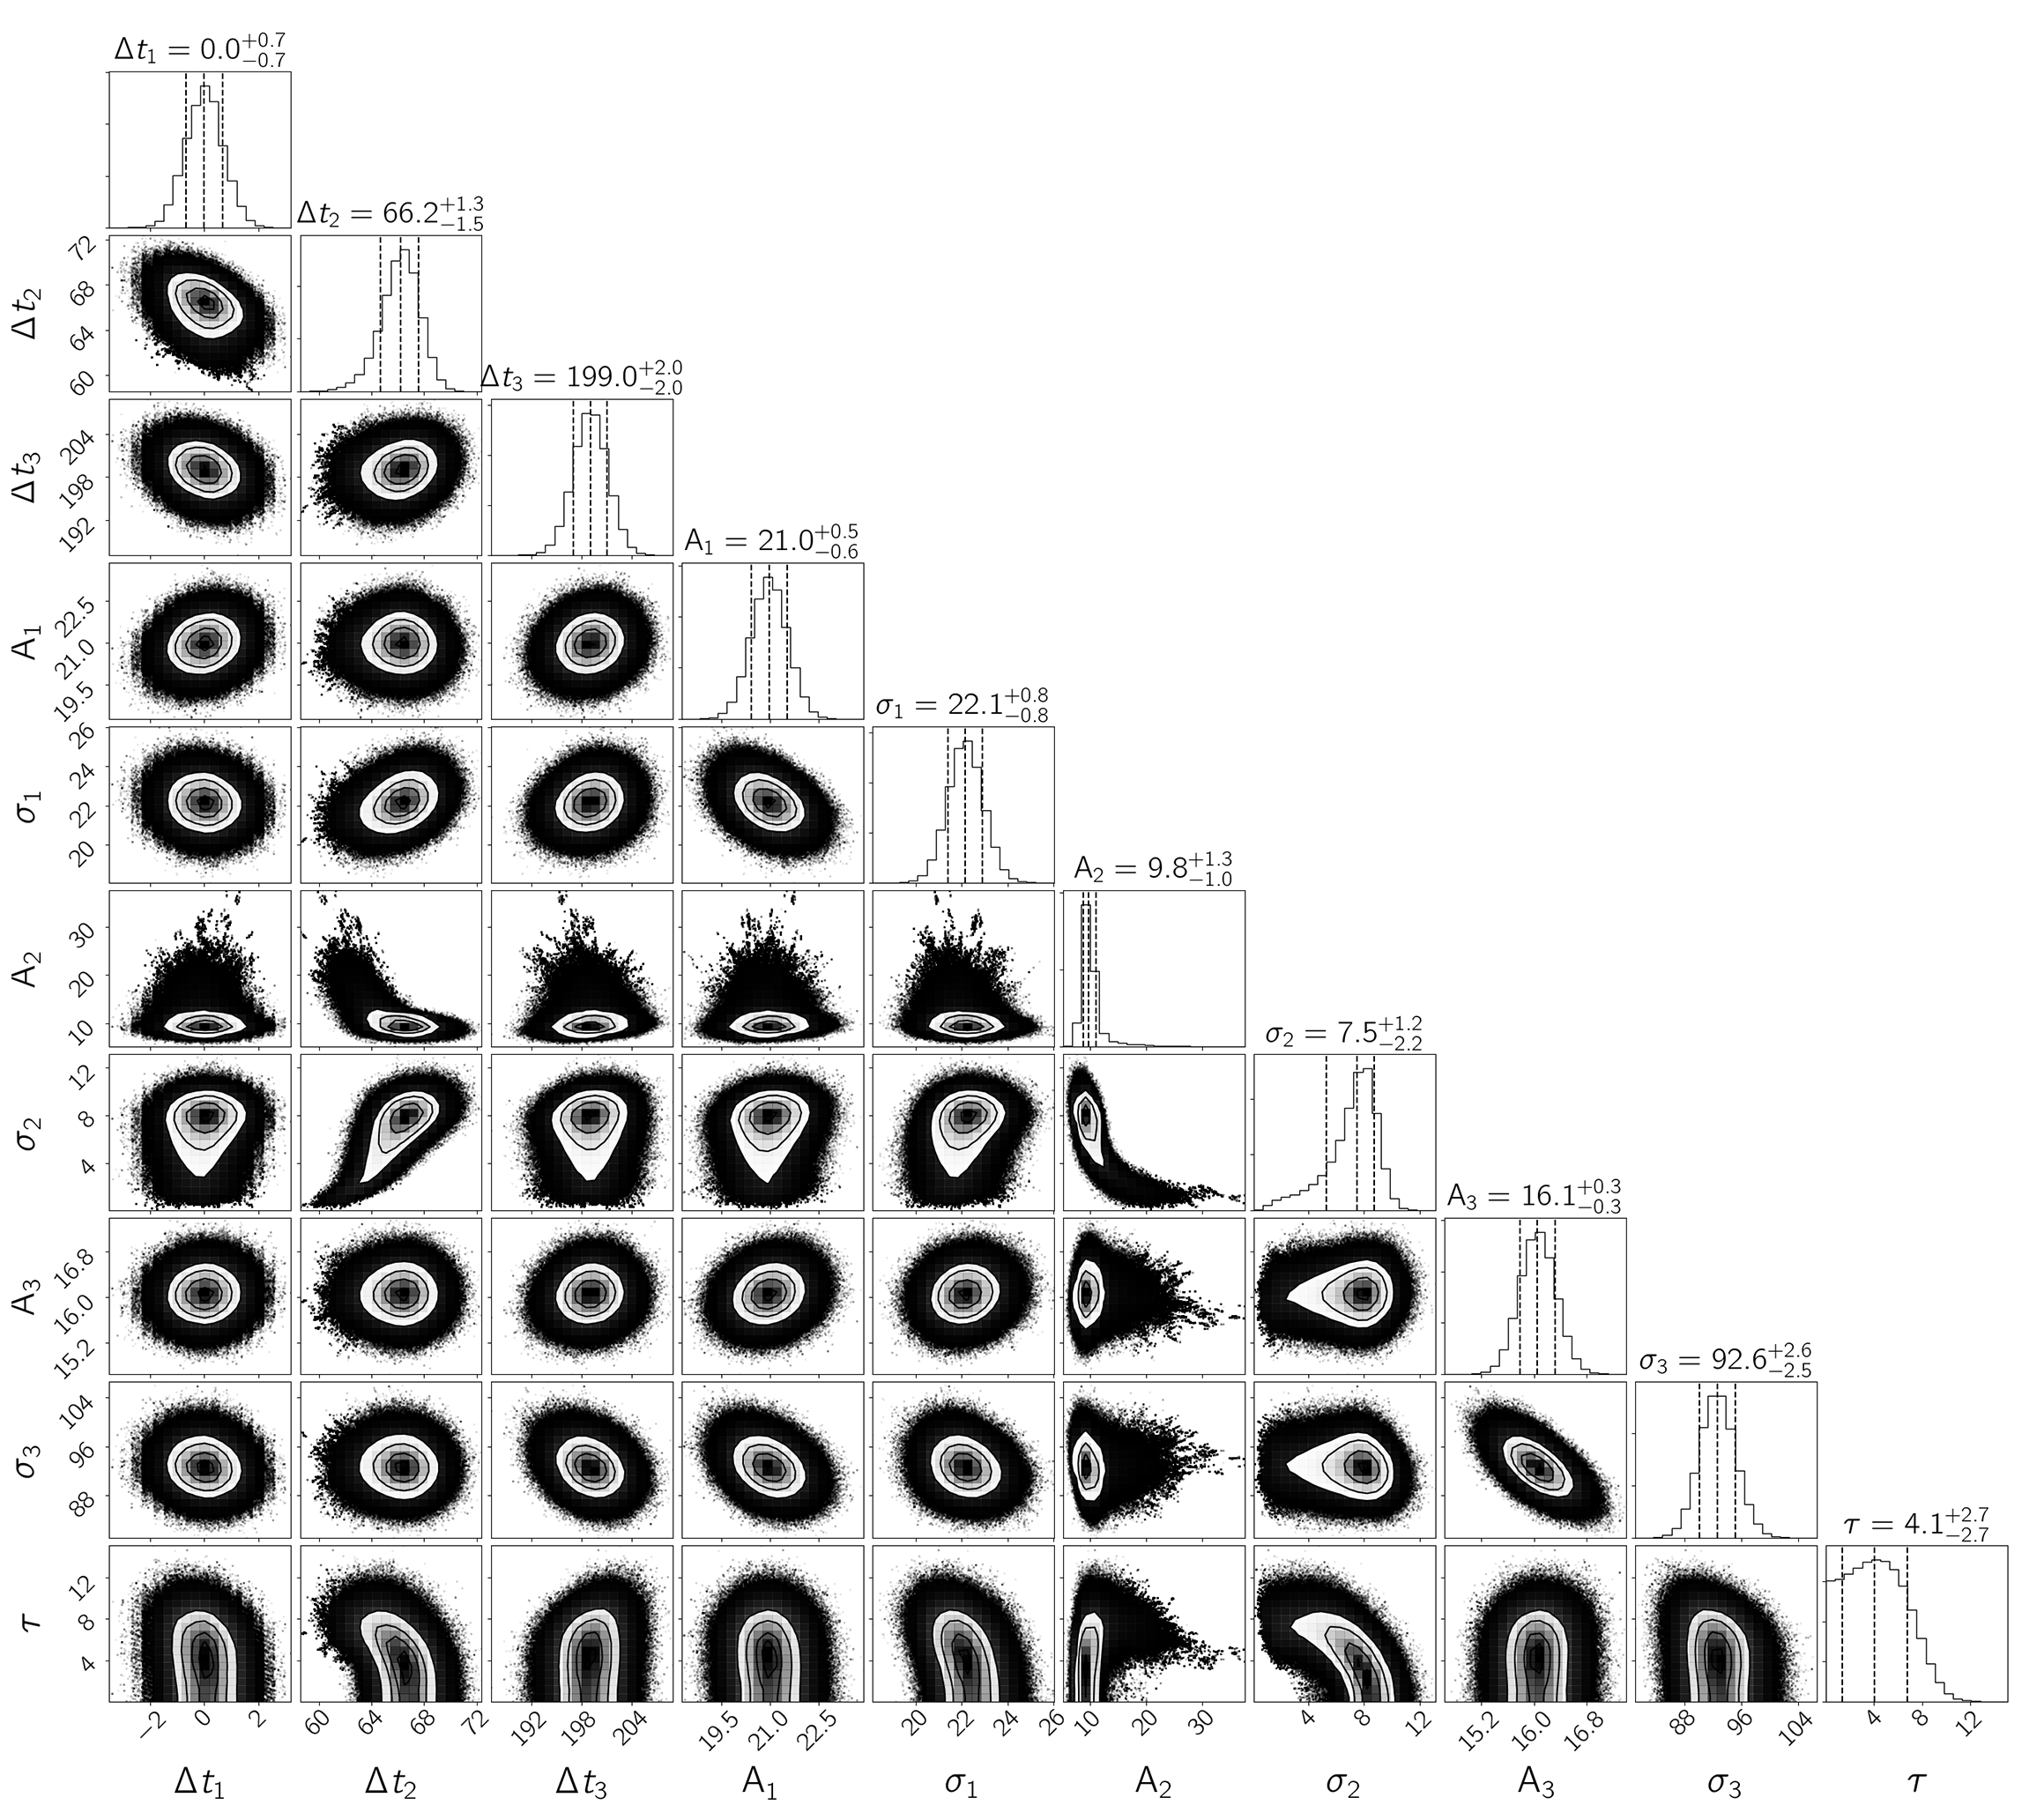
where is time in microseconds, is the scattering timescale at 835 MHz, is a Heaviside unit step function, is the time offset of a Gaussian relative to the first, is the Gaussian dispersion width, and the asterisk denotes convolution. The optimal parameters of the model were obtained using Markov chains Monte Carlo (MCMC)444Using the python package emcee (Foreman-Mackey et al., 2013). Fig. 5 shows the best-fitting model overlaid on the data, and the optimal model parameters are presented in Table 2. We show the estimated posterior distributions for the model parameters in Fig. 6 555This figure is made using the public python package corner (Foreman-Mackey, 2016)..
We estimate the scattering timescale to be s. This corresponds to frequency structures on a scale of , consistent with the striations on the 100-200 kHz scale seen in the dynamic spectrum.
In the following sub-section, we assume that this fine structure is induced by a second scattering screen, external to the Milky Way. We note that is poorly constrained on the lower end of the posterior distribution, and the data are consistent with no scattering at the 2-sigma level. In this case, the structure may be intrinsic to the emission process of the source and in what follows it is important to differentiate between intrinsic emission processes and propagation effects.
We note that if FRB170827 had been recorded with a low-bit digitization system, as was the case, e.g., for the Lorimer burst (Lorimer et al., 2007), the burst presented here would have a much smoother spectrum. Owing to our high dynamic range 8-bit voltage recording, we were able to uncover the wealth of spectral features. If these features are intrinsic to the source, the emission process might be very different to what it is in (for example) the giant pulses from the Crab pulsar (see e.g., Hankins et al., 2016, and references therein) which show relatively broad-band features at similar radio frequencies. Detailed comparison to Crab giant pulses is made difficult by lack of polarisation and coarser time resolution for our FRB.
4.3 Two Screen Model
The dynamic spectrum of FRB170827 shows scintillation on two frequency scales: broadband features explained by a passage through the turbulent ISM, and a finer structure with striations 1-2 frequency channels (100-200 kHz) wide, hinting at the presence of another scattering screen along the FRB’s path from the host to the observer. In this section, we assume that both spectral modulation scales arise from scintillation induced by two scattering screens, a Galactic screen, and another closer to source.
We model the near screen to be placed 1 kpc from the observer. The second screen, in order to give rise to the fine spectral modulation, should be sufficiently distant that it is not resolved by the Galactic screen. Scintillations from a far screen will only be apparent if the incident wave field is spatially coherent across the transverse extent of the scattering disk of the near screen. This scale is of order the screen’s refractive scale, , defined as:
| (6) |
where is the angular radius of the source’s broadened image, is the distance to the scattering screen, is the Fresnel scale, and is the field coherence scale (Lorimer & Kramer, 2012).
We can obtain a first order estimate of the coherence scale of the much further screen by estimating the scale on which its average visibility declines. For a source at an angular diameter distance from the observer and an angular diameter distance from the (more distant) lensing screen, this scale is:
| (7) |
(e.g. Macquart & Koay, 2013). The scintillation bandwidth is related to the coherence scale of the scattering screen by:
| (8) |
(Lorimer & Kramer, 2012). For the Galactic screen, we have:
| (9) |
where is the radiation angular wavenumber. Taking into account the curved geometry of spacetime, the coherence scale of the far screen is:
| (10) |
where and are the effective distance and redshift of the scattering material respectively (Macquart & Koay, 2013). is the angular diameter distance from the observer to the scattering screen.
The condition that the more distant screen is not resolved by the Galactic screen is:
| (11) |
Using Eqs. 6 to 10, Eq. 11 reduces to:
| (12) |
For our values of MHz, MHz, kpc, and Mpc, we get Mpc. The second screen could therefore lie in the Intergalactic Medium, but is also consistent with a turbulent screen close to the FRB source in its host galaxy. This is similar to the case of FRB110523 (Masui et al., 2015), who found evidence for a screen in the host galaxy based on the scattering and polarisation properties of the FRB.
| (s) | (s) | (s) | |
|---|---|---|---|
| 0.0 | 22.1 | 4.1 | |
| 66.2 | 7.5 | ||
| 199.0 | 92.6 |
5 Multiwavelength follow-up
Follow-up observation of the event were made at the radio wavelengths with UTMOST, ASKAP, and Parkes, and at optical wavelengths with SkyMapper (Keller et al., 2007).
-
1.
UTMOST: FRB170827 occurred while we were running the telescope in FRB transit mode after one of the telescope arm drives failed over a weekend, so that normal pulsar observing was not possible. As the telescope was positioned at deg, sources cross through the 4 degree primary beam in approximately 40 minutes. This represents 1.5 hours of (serendipitous) follow-up of the event in the following 48 hours, and before other telescopes could be triggered. No candidate bursts were found 60 minutes around the event, nor in the data recorded in the following two days. Around 22 hours of follow-up of the FRB were then performed during the period from August 2017 to February 2018, finding no repeat bursts down to a S/N of 9.
-
2.
Parkes: We searched for repeat bursts using the 20 cm multibeam receiver and the BPSR backend, as part of the SUPERB project (Keane et al., 2018). The observations were taken in the frequency range 1182-1582 MHz, with a usable bandwidth of 320 MHz, using 1024 channels of width 390 kHz each. Nineteen grid points were searched for 300 seconds each along the localisation arc as provided in Eq. 1, spaced around 20 arcminutes, starting at UTC 2017-08-30 16:39:29. No bursts were found with S/N 8.
-
3.
ASKAP: 12 hours of follow-up beginning on August 30th, 2017, 22:33:17 UTC, centred at the best-fitting position of FRB170827’s field was performed with a single antenna. The observations were taken at a central frequency of 1300 MHz with a bandwidth of 300 MHz. No bursts were detected above a S/N of 9.5, corresponding to a limiting fluence of 22 Jy ms, at the 1.26 ms time resolution.
-
4.
SkyMapper: Several nights of imaging data were taken in the week after the event (2017-08-29, 2017-08-30, 2017-09-01). Images were taken in the bands (100 s exposures) with photometric depth limits of , , , , and , at the 95% upper limit provided by the SkyMapper Transient Survey Pipeline (Scalzo et al., 2017). The follow-up fields were centred around the FRB coordinates, extending north-south to cover the 2-sigma error regions (i.e. 4.8 degrees). We carried out two different follow-up modes over two nights: the first consists on images centred on the FRB position with multiple visits with slight pointing offsets, and the second takes images of the SkyMapper field covering the FRB localisation and the 2-sigma regions.
Eight galaxies were found in the 6dFGS catalog (Jones et al., 2009) lying along the localisation arc of the FRB, in the redshift range . They lie in the magnitude ranges , and are mostly disk galaxies. Reference images were taken on 2015-07-06 (2 years ago) and on 2017-09-02 (4 days after the first epoch of the FRB followup observations). Only five galaxies are well placed on the CCD images to permit proper processing with our image subtraction procedure using both the newly acquired data and the reference images. No transient or variable candidates were detected in the SkyMapper data along the localisation arc.
6 Discussion and Conclusions
In this paper, we reported a Fast Radio Burst (FRB170827) discovered in near real-time at the Molonglo radio telescope. This demonstrated our ability to trigger voltage capture for a new FRB with a low-latency machine-learning-based discovery system. The discovery allowed, and for the first time, to perform coherent dedispersion of a burst after its blind detection, unveiling temporal structure that would not have been otherwise observed.
The full width of the burst is 400 s, and it has a DM of 176.80 0.04 pc cm-3 (after coherent dedispersion), which is the lowest known DM of the FRB population. The Milky Way contribution along the line of sight is 37 pc cm-3 (NE2001) or 26 pc cm-3 (YMW16), leaving an excess of 140 or 150 pc cm-3, and limiting its redshift to , potentially placing it closer than the repeating FRB (FRB121102, for which the host galaxy is at ). It has an observed fluence of 20 7 Jy ms, placing it amongst the brightest FRBs found to date.
The dynamic spectrum of the FRB shows spiky emission features of up to 1 kJy at 10.24 s and 97.66 kHz resolution, similar to the very bright (50 Jy ms) FRB150807 (Ravi et al., 2016), who reported bright spikes of over 1 kJy at a resolution of 64 s and 390 kHz.
The temporal profile of the burst shows three components, the narrowest of which is 30 s. FRB170827 shows spectral modulations on two frequency scales of 1.5 MHz and 0.1 MHz. The latter is based on the scattering of the event of s, obtained via maximum likelihood fitting of the three burst components. These two scales are clearly visible in the dynamic spectrum of the event which is dominated by a bright region of emission between 841 and 843 MHz, but with weaker, patchy emission across the entire band. The present patchy emission is similar to what is seen in the repeating FRB (FRB121102; Michilli et al. 2018) at 4.5 GHz, FRB110523 (Masui et al., 2015) at 800 MHz and in FRBs found at ASKAP (Shannon et al. in prep) at 1.4 GHz. A decorrelation bandwidth of 0.8 MHz (at 835 MHz) is expected due to the ISM at the position of FRB170827 () using the NE2001 model, which is consistent with the larger of these scales. The 0.1 MHz scale striation is significantly lower than can be accounted for from the ISM, and we speculate it could arise in the host galaxy of the FRB, similarly to the high-RM FRB110523 and the repeating FRB (FRB121102).
Microstructure visible in the temporal profile of FRB170827 is very similar to that seen in the repeating FRB121102. This and other similarities to the repeater has strongly motivated a follow-up campaign for repeat bursts, currently being conducted at UTMOST at 835 MHz to a fluence limit of approximately 5 Jy ms and Parkes at 1.4 GHz to a limit of approximately 0.5 Jy ms.
We are currently upgrading the interferometer’s second arm (UTMOST-2D project), and our FRB detection and voltage capture system will enable us to perform FRB host galaxy localisation to a few arcsec accuracy from single FRB events by recording voltages from all the array elements, such as was achieved for FRB170827.
Acknowledgments
The authors would like to thank the anonymous referee for useful comments and suggestions. The Molonglo Observatory is owned and operated by the University of Sydney, with support from the School of Physics and the University. The UTMOST project is also supported by the Swinburne University of Technology. We acknowledge the Australian Research Council grants CE110001020 (CAASTRO) and the Laureate Fellowship FL150100148. We thank Dave Temby, Glen Torr, Glenn Urquhart, Simon Jordan for cheerfully keeping the UTMOST facility performing so smoothly. We thank Kiyoshi Masui for helpful discussions. The Parkes radio telescope is part of the Australia Telescope National Facility, which is funded by the Commonwealth of Australia for operation as a National Facility managed by CSIRO. The ASKAP is part of the Australia Telescope National Facility, which is managed by CSIRO. Operation of ASKAP is funded by the Australian Government with support from the National Collaborative Research Infrastructure Strategy. ASKAP uses the resources of the Pawsey Supercomputing Centre. Establishment of ASKAP, the Murchison Radio-astronomy Observatory and the Pawsey Supercomputing Centre are initiatives of the Australian Government, with support from the Government of Western Australia and the Science and Industry Endowment Fund. We acknowledge the Wajarri Yamatji people as the traditional owners of the Observatory site. ATD is supported by an ARC Future Fellowship grant FT150100415. Parts of this work was performed on the gSTAR national facility at Swinburne University of Technology. SkyMapper is owned and operated by The Australian National University’s Research School of Astronomy and Astrophysics. The national facility capability for SkyMapper has been funded through ARC LIEF grant LE130100104 from the Australian Research Council, awarded to the University of Sydney, the Australian National University, Swinburne University of Technology, the University of Queensland, the University of Western Australia, the University of Melbourne, Curtin University of Technology, Monash University and the Australian Astronomical Observatory.
References
- Bailes et al. (2017) Bailes M., et al., 2017, Publ. Astron. Soc. Australia, 34, e045
- Bandura (2014) Bandura K., 2014, in 2014 United States National Committee of URSI National Radio Science Meeting (USNC-URSI NRSM). pp 1–1, doi:10.1109/USNC-URSI-NRSM.2014.6928108
- Bannister et al. (2017) Bannister K. W., et al., 2017, ApJ, 841, L12
- Bassa et al. (2017) Bassa C. G., et al., 2017, ApJ, 843, L8
- Bhandari et al. (2018) Bhandari S., et al., 2018, MNRAS, 475, 1427
- Breiman (2001) Breiman L., 2001, Machine Learning, 45, 5
- Burke-Spolaor & Bannister (2014) Burke-Spolaor S., Bannister K. W., 2014, ApJ, 792, 19
- Caleb et al. (2016) Caleb M., et al., 2016, MNRAS, 458, 718
- Champion et al. (2016) Champion D. J., et al., 2016, MNRAS, 460, L30
- Chatterjee et al. (2017) Chatterjee S., et al., 2017, Nature, 541, 58
- Cordes (1986) Cordes J. M., 1986, ApJ, 311, 183
- Cordes & Lazio (2002) Cordes J. M., Lazio T. J. W., 2002, preprint, (arXiv:astro-ph/0207156)
- Cordes & Wasserman (2016) Cordes J. M., Wasserman I., 2016, MNRAS, 457, 232
- Cordes et al. (1983) Cordes J. M., Boriakoff V., Weisberg J. M., 1983, ApJ, 268, 370
- Eftekhari & Berger (2017) Eftekhari T., Berger E., 2017, ApJ, 849, 162
- Falcke & Rezzolla (2014) Falcke H., Rezzolla L., 2014, A&A, 562, A137
- Farah et al. (2017) Farah W., et al., 2017, The Astronomer’s Telegram, 10697
- Foreman-Mackey (2016) Foreman-Mackey D., 2016, The Journal of Open Source Software, 24
- Foreman-Mackey et al. (2013) Foreman-Mackey D., Hogg D. W., Lang D., Goodman J., 2013, PASP, 125, 306
- Hankins et al. (2016) Hankins T. H., Eilek J. A., Jones G., 2016, ApJ, 833, 47
- Inoue (2004) Inoue S., 2004, MNRAS, 348, 999
- Jones et al. (2009) Jones D. H., et al., 2009, MNRAS, 399, 683
- Keane et al. (2012) Keane E. F., Stappers B. W., Kramer M., Lyne A. G., 2012, MNRAS, 425, L71
- Keane et al. (2016) Keane E. F., et al., 2016, Nature, 530, 453
- Keane et al. (2018) Keane E. F., et al., 2018, MNRAS, 473, 116
- Keith et al. (2010) Keith M. J., et al., 2010, MNRAS, 409, 619
- Keller et al. (2007) Keller S. C., et al., 2007, Publ. Astron. Soc. Australia, 24, 1
- Law et al. (2015) Law C. J., et al., 2015, ApJ, 807, 16
- Lorimer & Kramer (2012) Lorimer D. R., Kramer M., 2012, Handbook of Pulsar Astronomy
- Lorimer et al. (2007) Lorimer D. R., Bailes M., McLaughlin M. A., Narkevic D. J., Crawford F., 2007, Science, 318, 777
- Macquart & Ekers (2018) Macquart J.-P., Ekers R. D., 2018, MNRAS, 474, 1900
- Macquart & Koay (2013) Macquart J.-P., Koay J. Y., 2013, ApJ, 776, 125
- Manchester et al. (2006) Manchester R. N., Fan G., Lyne A. G., Kaspi V. M., Crawford F., 2006, ApJ, 649, 235
- Marcote et al. (2017) Marcote B., et al., 2017, ApJ, 834, L8
- Masui et al. (2015) Masui K., et al., 2015, Nature, 528, 523
- Metzger et al. (2017) Metzger B. D., Berger E., Margalit B., 2017, ApJ, 841, 14
- Michilli et al. (2018) Michilli D., et al., 2018, Nature, 553, 182
- Palaniswamy et al. (2018) Palaniswamy D., Li Y., Zhang B., 2018, ApJ, 854, L12
- Pen & Connor (2015) Pen U.-L., Connor L., 2015, ApJ, 807, 179
- Petroff et al. (2015) Petroff E., et al., 2015, MNRAS, 447, 246
- Petroff et al. (2016) Petroff E., et al., 2016, Publ. Astron. Soc. Australia, 33, e045
- Petroff et al. (2017) Petroff E., et al., 2017, MNRAS, 469, 4465
- Ravi (2017) Ravi V., 2017, preprint, (arXiv:1710.08026)
- Ravi et al. (2015) Ravi V., Shannon R. M., Jameson A., 2015, ApJ, 799, L5
- Ravi et al. (2016) Ravi V., et al., 2016, Science, 354, 1249
- Scalzo et al. (2017) Scalzo R. A., et al., 2017, Publ. Astron. Soc. Australia, 34, e030
- Spitler et al. (2014) Spitler L. G., et al., 2014, ApJ, 790, 101
- Spitler et al. (2016) Spitler L. G., et al., 2016, Nature, 531, 202
- Tendulkar et al. (2017) Tendulkar S. P., et al., 2017, ApJ, 834, L7
- Totani (2013) Totani T., 2013, PASJ, 65, L12
- Yao et al. (2017) Yao J. M., Manchester R. N., Wang N., 2017, MNRAS, 468, 3289