Motion control and optical interrogation of a levitating single NV in vacuum
Abstract
Levitation optomechanics exploits the unique mechanical properties of trapped nano-objects in vacuum in order to address some of the limitations of clamped nanomechanical resonators. In particular, its performance is foreseen to contribute to a better understanding of quantum decoherence at the mesoscopic scale as well as to lead to novel ultra-sensitive sensing schemes. While most efforts have so far focused on optical trapping of low absorbing silica particles, further opportunities arise from levitating objects with internal degrees of freedom like color centers. Nevertheless, inefficient heat dissipation at low pressures poses a challenge, as most nano-objects, even with low absorbing materials, experience photo-damage in an optical trap. Here, by using a Paul trap, we demonstrate levitation in vacuum and center-of-mass feedback cooling of a nanodiamond hosting a single nitrogen-vacancy center. The achieved level of motion control enables us to optically interrogate and characterize the emitter response. The developed platform is applicable to a wide range of other nano-objects and represents a promising step towards coupling internal and external degrees of freedom.
keywords:
nanodiamond, nitrogen vacancy center, Paul trap, levitation optomechanics, vacuum, feedbackDepartment of Applied Physics, School of Sciences, University of Granada, 18071, Granada, Spain \alsoaffiliationICREA-Institució Catalana de Recerca i Estudis Avançats, 08010 Barcelona, Spain \abbreviations
Optomechanics offers a toolbox to investigate classical and quantum mechanical oscillators in a highly controlled way. A fundamental open question in the field is under which conditions the transition from quantum to classical behaviour takes place, but despite the high level of control achieved with micro and nanomechanical systems, a good understanding of this transition remains elusive. Experiments so far have demonstrated the preparation of mechanical oscillators close to their ground state1234, but the controlled generation of arbitrary quantum motional states5 greatly increases the technical requirements. An exciting route towards these ends is the use of nanoscale mechanical resonators containing internal degrees of freedom678, whose energy levels can be coupled to the motion of the oscillator. This scheme would allow state transfer or cooling and outperform classical resonators, for instance in ultra-sensitive sensing6.
In this regard, nanomechanical resonators based on nanoparticles levitated in vacuum are especially attractive, because they are highly decoupled from the environment due to the absence of clamping, and hence exhibit very large quality () factors, even at moderate pressures. In optical traps, optical forces can be used to efficiently cool the nanoparticle center-of-mass (COM) motion and thus reduce the influence of thermal noise910. Furthermore, one could add further functionality and control to the platform by levitating functional nano-objects with tailored specific properties. For instance, levitated particles with internal degrees of freedom (DOF), such as controllable spin systems, have the potential to be used in matter-wave interferometry111213. However, the optical levitation of nanoparticles with internal DOF faces some challenges1415: on one hand, large optical trapping powers introduce a big constraint on the type of particles that can be levitated in vacuum, since heat from residual absorption of the trapping laser can not be efficiently dissipated at low pressures. On the other hand, high vacuum levels are necessary for maintaining motion coherence and attaining large factors. Hence, to avoid photo-damage other methods to levitate particles with internal DOF are needed.
An alternative approach to optical trapping is the use of Paul traps16, which have been widely applied to manipulate individual ions. The main appeal of Paul traps is the possibility to levitate charged particles without the aid of optical fields 171819, thereby widening the range of their constitutive materials. Paul traps are thus well suited for the levitation of particles with optical defects, like nanodiamonds hosting Nitrogen-Vacancy (NV) centers. NV centers are optical emitters formed by a nitrogen impurity and a vacancy in the crystal lattice of diamond20. NV centers are attractive because they are a stable source of single photons even at room-temperature, whose electron spin can be optically addressed and possesses long coherence times21. They have already been successfully used as a qubit222324 and are excellent candidates for sensing electric and magnetic fields by either using Stark or Zeeman shifts252627. So far, Paul traps have been used to trap and optically interrogate small nanodiamonds clusters at ambient pressures28 and larger microdiamonds29 hosting multiple nitrogen vacancy (NV) centers. Nevertheless, levitation and detection of a single NV center in vacuum, in a strongly underdamped regime of the nanoparticle’s oscillation, has not yet been achieved, requiring a further level of control on the particle dynamics compatible with a single photon optical detection.
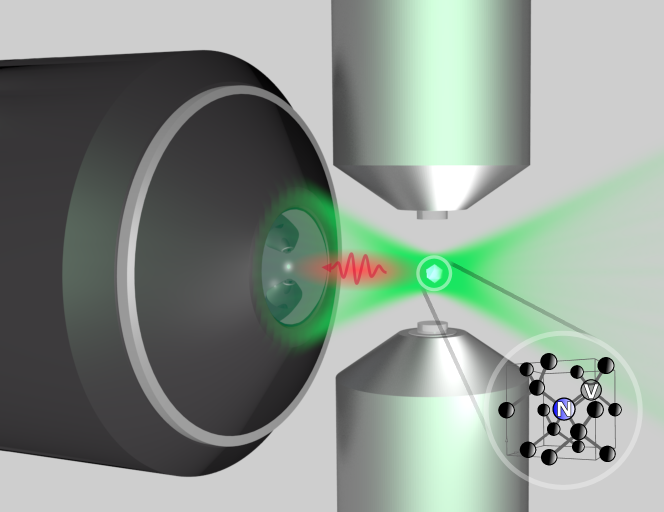
In this letter we report on two key requirements for coupling internal DOFs with the COM motion. Firstly, we demonstrate, for the first time to our knowledge, levitation in high vacuum of a nanodiamond hosting a single NV center. By trapping with a Paul trap, we avoid particle photo-damage, and with low optical intensity are able to measure the NV single photon emission and monitor the nanodiamond’s COM motion (see Figure 1). Secondly, we implement a feedback scheme to reduce the effective temperature of this COM motion and improve the particle’s stability and confinement at low pressures.
The COM equation of motion can be found by calculating the force experienced by a charged particle in the Paul trap time-dependent electric potential16:
| (1) |
where is the voltage amplitude, the driving frequency, the time variable, a geometric constant with length units and , are cylindrical coordinates. Even though the particle’s COM Hamiltonian is explicitly time-dependent, under certain general conditions the motion can be averaged over the high frequency 30. This is known as the adiabatic approximation and ensures that the particle is governed by an effective potential for every axis , where is known as the secular frequency of the -th axis.
Therefore, for low frequencies the full equation of motion for the particle’s COM along the axis can be simplified in the following way
| (2) |
where is the momentum in the direction, the damping constant, the charge of the particle, the restoring force of the effective potential and a stochastic force with standard deviation , associated with the damping via the fluctuation-dissipation relation , where is Boltzmann’s constant and is temperature31. By reducing the pressure and hence , the motion decoherence is reduced, while the inversely proportional factor of the oscillator increases. This is why a trapping scheme capable of bringing particles to low pressures is appealing.
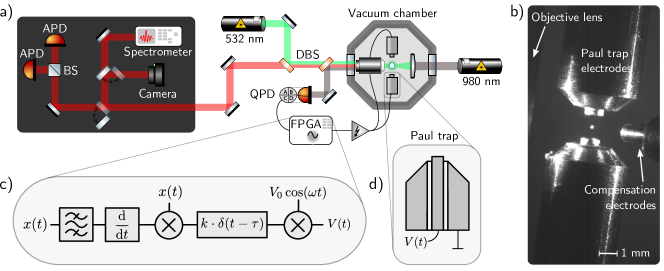
Our trap design (see Figure 2b) has an endcap geometry for good optical access. It is made of two assembled steel electrodes separated by 1.4 mm mounted on a ceramic holder. These electrodes are mounted on a three axis piezoelectric stage (Figure 2a) and driven by a high voltage signal generated by a field programmable gate array (FPGA) card and a high voltage amplifier (Matsusada AMT-1B60). The FPGA acts as a wave generator, and provides a sinusoidal output at adjustable frequency and amplitude. Usual working parameters in our experiment are driving frequency kHz and amplitude in the range of 0.75 kV to 2 kV. Two extra rods pointing towards the center of the trap act as compensation electrodes. The latter are used to eliminate stray fields and thus minimize residual micromotion driving.
To load particles into the Paul trap, we use electrospray injection at ambient pressure with a suspension of nanodiamonds in ethanol (Adámas, 40 nm diameter nanodiamonds, 1-4 NV; see Supplementary information). Trapping events are monitored with a camera (Thorlabs CMOS), using the scattering from a weakly focused 980 nm laser (Figure 2b). The Paul trap is subsequently moved with the piezoelectric stages to bring the particle into the focus of a high numerical aperture (NA) microscope objective (Olympus LMPLFLN 100x). The objective is used to illuminate the nanodiamond with a 532 nm laser, and thus excite the NV transition, and also to collect the emitted fluorescence. The fluorescence light is then directed towards a light-proof box, where it is selectively analysed with an electron multiplying camera (EMCCD) (Andor iXon+ EMCCD), a spectrometer (Acton Spectrapro 2500i), or coupled into low dark-counts single photon detectors (Perkin Elmer SPCM-AQR-14). Due to the low intensity of the two laser beams, we did not detect any effect of the dipole force on the particle dynamics in the Paul trap.
The single photon detectors are set up in a Hanbury, Brown and Twiss (HBT) configuration to study the emitters photon statistics32. They are used to measure the time dependent intensity correlation function, defined as
| (3) |
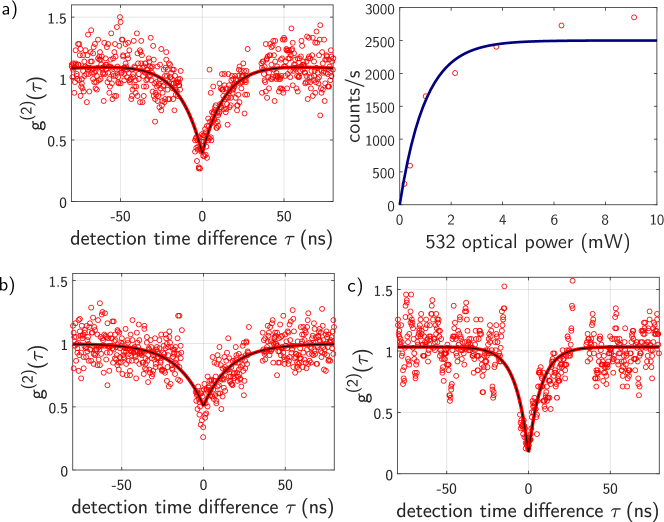
where is the intensity operator and indicates normal ordering. For a single photon emitter, and for two or more (equal) emitters . Usually, background contributions lead to a even though the main contribution stems from a single emitter, which is ensured by 33. This condition is the criterion we use to identify trapped nanodiamonds holding single NVs.
After trapping at ambient pressure we characterize the fluorescence emission of the loaded nanodiamonds. Fluorescence imaging of the particles is performed with the EMCCD camera, followed by measurements. We have detected single NVs in trapped nanodiamonds, with usual count rates of 2000 to 7000 counts per second at excitation powers of 2 - 5 mW. Even though the rotation of the trapped nanodiamonds has not been studied in this experiment, measuring and controlling the crystal Euler angles will be important for coupling internal and external degrees of freedom, as the spin interaction depends on the NV orientation. This could be implemented by using elongated nanodiamonds, whose birefringence will transduce the particle’s rotation into a modulation of the intensity and a change in the light polarization343536.
After a single NV was detected, we compensated the stray fields to minimize the micromotion driving. Stray field compensation was repeated for every new particle, since it was prone to drifts and sign changes. This may be caused by the introduction of other charged particles in the chamber during the use of the electrospray, which can change the static electric field in the trapping region. By following the described procedure, particles can be stably trapped at ambient pressure over very long times: some levitated nanodiamonds were kept for weeks, until they were deliberately substituted by other nanocrystals.
At ambient pressure, the stochastic forces due to collisions with air molecules damp oscillations and lead to overdamped Brownian dynamics. Thus, when a trapped single NV is detected, we decrease the pressure to bring the chamber to vacuum. The voltage amplitude used to trap particles is 2 kV, but Paschen’s law predicts a minimum of the breakdown voltage of air at 750 V 37. Voltages above this value will ignite a plasma at pressures that depend on the electrodes geometry, leading to particle loss. Consequently, while decreasing the pressure we reduce the voltage amplitude below 750 V; at pressures lower than mBar the voltage amplitude can be safely increased again.
For pressures below 1 mBar, the motion coherence of the particle is sufficient to activate the feedback and reduce the energy of the particle. The feedback system, described in Figure 2c, is implemented in the following way: a 980 nm laser is focused with a low effective NA and superimposed with the focus of the trap’s center. The focused light together with the light scattered by the particle are collected by the high NA objective. The 980 nm light is then directed onto a quadrant photo-diode (QPD), which extracts signals that are proportional to the particle’s position for the -th axis. For the and axis, this signal is obtained via differential measurements of the intensity on the quadrants. Conversely, the dynamics in are detected from a modulation on the total intensity, resulting from the interference between the laser beam and the position dependent particle scattering. These signals are fed to the FPGA and processed (Figure 2b). The FPGA modulates the amplitude of the driving voltage to cool down the energy of the COM motion 17. The modulation is obtained by calculating the product , which is effectively at a frequency of . Here, is an experimentally determined constant that can be different for different particles.
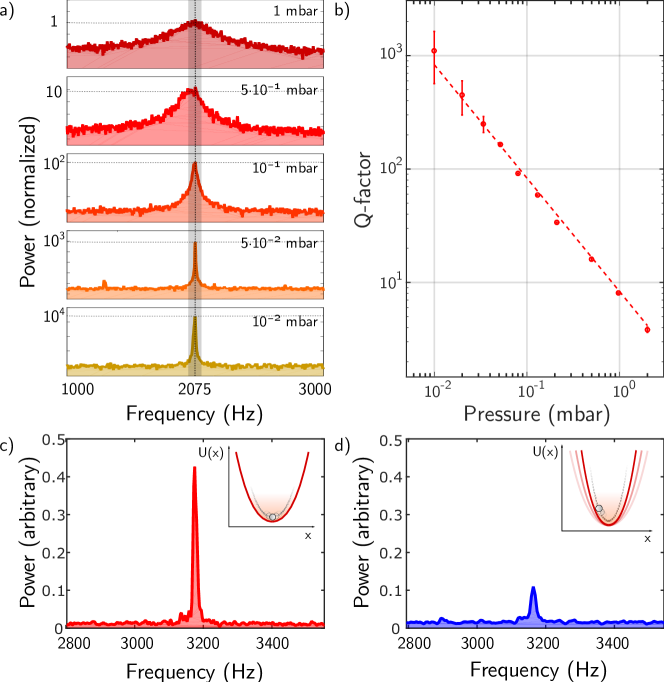
Particles at low pressures were much more stable when stray fields had been cancelled with the compensation electrodes: without 532 nm excitation light and only some weak 980 nm illumination to detect the COM, we were able to trap nanodiamonds at pressures as low as mBar, where the particle’s oscillating motion attained factors above (Figure 3b); at lower pressures the nanodiamonds generally became unstable. The cancellation of the stray fields was also required for feedback cooling. With it, the energy of the axial COM mode could be reduced to a fraction of its value at thermal equilibrium expected by the equipartition theorem. Figure 3 shows the effect of the feedback on a nanodiamond levitated at mBar, demonstrating a reduction of energy of the eigenmode. We achieved energy reductions of 6 to 9 dB at pressures between mBar and mBar, which corresponds to effective temperatures in the range of 75 K to 38 K. This reduction in energy is partly limited by the signal to noise ratio (SNR) from the signal measured using the QPD, but the biggest restriction is the level of vacuum. Indeed, at lower pressures the particle’s motion is more predictable and the feedback performance improves.
The pressure level is, however, limited by diamond photo-degradation. Although nanodiamonds in Paul traps do not inherently suffer from heating due to optical absorption, a certain amount of optical power is required to interact with the single NV center, whether for excitation or for motion detection. As a result, laser power must be high enough for a good SNR, yet sufficiently low to avoid heating up the particle excessively. At ambient pressure, this limitation is not present since the interaction with air molecules not only damps oscillations but is also sufficiently high to keep the particle’s lattice temperature at equilibrium with the environment. In the future this constraint can be eliminated, since spin initialization and readout only require short laser pulses, hence allowing us to work at lower pressures.
In order to probe the capacity of the nanodiamond to withstand heat dissipation, we performed measurements at different pressures. We obtained stable fluorescence counts up until the mBar to mBar range, with 1 to 3 mW of 532 nm power; no signature of quenching due to high temperatures was observed under these conditions38. At this point, a progressive decrease in the scattering signal is apparent, indicating a possible shrinking of the nanodiamonds.
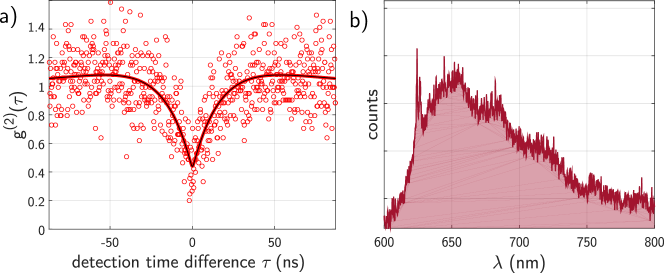
Figure 4a shows the measurement and spectrum of a single NV in a nanodiamond trapped at 0.5 mBar, the same on which we applied the feedback shown in Figure 3d. Figure 4b shows the fluorescence emission spectrum obtained for this NV. The two peaks at nm are caused by Raman scattering (OH stretching) of ethanol traces39 present in the nanodiamonds.
In conclusion, we have demonstrated stable trapping of nanodiamonds and optical readout of a single NV center at pressures down to mBar. This is two orders of magnitude lower than previously attained with optical traps14, where thermal damage limits access to higher vacuum levels. Furthermore, our platform enables us to cool down the particle’s translational modes via parametric feedback. In future experiments, control over the spin system of the levitated NV center can be attained by designing and adding a microwave antenna in the trap. Having such a high level of control of a particle hosting emitters is a decisive step towards achieving strong coupling between a spin and the particle’s mechanical degrees of freedom64142.
1 Associated content
The supplementary material contains information regarding the particle dispersion, loading of particles to the Paul trap, oscillation frequencies and factor, excess charge determination, feedback system and measurements.
The authors acknowledge financial support from the European Research Council through grant QnanoMECA (CoG - 64790), Fundació Privada Cellex, CERCA Programme / Generalitat de Catalunya, and the Spanish Ministry of Economy and Competitiveness through the Severo Ochoa Programme for Centres of Excellence in RD (SEV-2015-0522), grant FIS2016-80293-R, and Juan de la Cierva grant IJCI-2015-26091.
References
- O’Connell et al. 2010 O’Connell, A. D.; Hofheinz, M.; Ansmann, M.; Bialczak, R. C.; Lenander, M.; Lucero, E.; Neeley, M.; Sank, D.; Wang, H.; Weides, M. Quantum ground state and single-phonon control of a mechanical resonator. Nature 2010, 464, 697–703
- Chan et al. 2011 Chan, J.; Alegre, T. M.; Safavi-Naeini, A. H.; Hill, J. T.; Krause, A.; Gröblacher, S.; Aspelmeyer, M.; Painter, O. Laser cooling of a nanomechanical oscillator into its quantum ground state. Nature 2011, 478, 89–92
- Teufel et al. 2011 Teufel, J.; Donner, T.; Li, D.; Harlow, J.; Allman, M.; Cicak, K.; Sirois, A.; Whittaker, J. D.; Lehnert, K.; Simmonds, R. W. Sideband cooling of micromechanical motion to the quantum ground state. Nature 2011, 475, 359–363
- Aspelmeyer et al. 2014 Aspelmeyer, M.; Kippenberg, T. J.; Marquardt, F. Cavity optomechanics. Reviews of Modern Physics 2014, 86, 1391
- Armour et al. 2002 Armour, A.; Blencowe, M.; Schwab, K. C. Entanglement and decoherence of a micromechanical resonator via coupling to a Cooper-pair box. Physical Review Letters 2002, 88, 148301
- Rabl et al. 2009 Rabl, P.; Cappellaro, P.; Dutt, M. G.; Jiang, L.; Maze, J.; Lukin, M. D. Strong magnetic coupling between an electronic spin qubit and a mechanical resonator. Physical Review B 2009, 79, 041302
- Teissier et al. 2014 Teissier, J.; Barfuss, A.; Appel, P.; Neu, E.; Maletinsky, P. Strain coupling of a nitrogen-vacancy center spin to a diamond mechanical oscillator. Physical review letters 2014, 113, 020503
- Lee et al. 2017 Lee, D.; Lee, K. W.; Cady, J. V.; Ovartchaiyapong, P.; Jayich, A. C. B. Topical Review: Spins and mechanics in diamond. Journal of Optics 2017, 19, 033001
- Li et al. 2011 Li, T.; Kheifets, S.; Raizen, M. G. Millikelvin cooling of an optically trapped microsphere in vacuum. Nature Physics 2011, 7, 527–530
- Gieseler et al. 2012 Gieseler, J.; Deutsch, B.; Quidant, R.; Novotny, L. Subkelvin parametric feedback cooling of a laser-trapped nanoparticle. Physical review letters 2012, 109, 103603
- Scala et al. 2013 Scala, M.; Kim, M. S.; Morley, G. W.; Barker, P. F.; Bose, S. Matter-Wave Interferometry of a Levitated Thermal Nano-Oscillator Induced and Probed by a Spin. Phys. Rev. Lett. 2013, 111, 180403
- Albrecht et al. 2014 Albrecht, A.; Retzker, A.; Plenio, M. B. Testing quantum gravity by nanodiamond interferometry with nitrogen-vacancy centers. Physical Review A 2014, 90, 033834
- Yin et al. 2013 Yin, Z.-q.; Li, T.; Zhang, X.; Duan, L. Large quantum superpositions of a levitated nanodiamond through spin-optomechanical coupling. Physical Review A 2013, 88, 033614
- Neukirch et al. 2015 Neukirch, L. P.; Von Haartman, E.; Rosenholm, J. M.; Vamivakas, A. N. Multi-dimensional single-spin nano-optomechanics with a levitated nanodiamond. Nature Photonics 2015, 9, 653–657
- Rahman et al. 2016 Rahman, A.; Frangeskou, A.; Kim, M.; Bose, S.; Morley, G.; Barker, P. Burning and graphitization of optically levitated nanodiamonds in vacuum. Scientific reports 2016, 6, 21633
- Paul 1990 Paul, W. Electromagnetic traps for charged and neutral particles. Rev. Mod. Phys. 1990, 62, 531–540
- Nagornykh et al. 2015 Nagornykh, P.; Coppock, J. E.; Kane, B. Cooling of levitated graphene nanoplatelets in high vacuum. Applied Physics Letters 2015, 106, 244102
- Millen et al. 2015 Millen, J.; Fonseca, P. Z. G.; Mavrogordatos, T.; Monteiro, T. S.; Barker, P. F. Cavity cooling a single charged levitated nanosphere. Physical Review Letters 2015, 114
- Alda et al. 2016 Alda, I.; Berthelot, J.; Rica, R. A.; Quidant, R. Trapping and manipulation of individual nanoparticles in a planar Paul trap. Applied Physics Letters 2016, 109
- Aharonovich et al. 2016 Aharonovich, I.; Englund, D.; Toth, M. Solid-state single-photon emitters. Nature Photonics 2016, 10, 631–641
- Bar-Gill et al. 2013 Bar-Gill, N.; Pham, L. M.; Jarmola, A.; Budker, D.; Walsworth, R. L. Solid-state electronic spin coherence time approaching one second. Nature communications 2013, 4, 1743
- Togan et al. 2010 Togan, E.; Chu, Y.; Trifonov, A.; Jiang, L.; Maze, J.; Childress, L.; Dutt, M. G.; Sørensen, A. S.; Hemmer, P.; Zibrov, A. S.; et al, Quantum entanglement between an optical photon and a solid-state spin qubit. Nature 2010, 466, 730–734
- Pfaff et al. 2014 Pfaff, W.; Hensen, B.; Bernien, H.; van Dam, S. B.; Blok, M. S.; Taminiau, T. H.; Tiggelman, M. J.; Schouten, R. N.; Markham, M.; Twitchen, D. J.; et al, Unconditional quantum teleportation between distant solid-state quantum bits. Science 2014, 345, 532–535
- Hensen et al. 2015 Hensen, B.; Bernien, H.; Dréau, A. E.; Reiserer, A.; Kalb, N.; Blok, M. S.; Ruitenberg, J.; Vermeulen, R. F.; Schouten, R. N.; Abellán, C.; et al, Loophole-free Bell inequality violation using electron spins separated by 1.3 kilometres. Nature 2015, 526, 682–686
- Taylor et al. 2008 Taylor, J.; Cappellaro, P.; Childress, L.; Jiang, L.; Budker, D.; Hemmer, P.; Yacoby, A.; Walsworth, R.; Lukin, M. High-sensitivity diamond magnetometer with nanoscale resolution. Nature Physics 2008, 4, 810–816
- Hall et al. 2009 Hall, L. T.; Cole, J. H.; Hill, C. D.; Hollenberg, L. C. Sensing of fluctuating nanoscale magnetic fields using nitrogen-vacancy centers in diamond. Physical review letters 2009, 103, 220802
- Dolde et al. 2011 Dolde, F.; Fedder, H.; Doherty, M. W.; Nöbauer, T.; Rempp, F.; Balasubramanian, G.; Wolf, T.; Reinhard, F.; Hollenberg, L. C.; Jelezko, F.; et al, Electric-field sensing using single diamond spins. Nature Physics 2011, 7, 459–463
- Kuhlicke et al. 2014 Kuhlicke, A.; Schell, A. W.; Zoll, J.; Benson, O. Nitrogen vacancy center fluorescence from a submicron diamond cluster levitated in a linear quadrupole ion trap. Applied Physics Letters 2014, 105, 073101
- Delord et al. 2017 Delord, T.; Nicolas, L.; Schwab, L.; Hétet, G. Electron spin resonance from NV centers in diamonds levitating in an ion trap. New Journal of Physics 2017, 19, 033031
- Major et al. 2006 Major, F. G.; Gheorghe, V. N.; Werth, G. Charged particle traps: physics and techniques of charged particle field confinement; Springer Science & Business Media, 2006; Vol. 37
- Kubo 1966 Kubo, R. The fluctuation-dissipation theorem. Reports on progress in physics 1966, 29, 255
- Brown and Twiss 1956 Brown, R. H.; Twiss, R. Q. Correlation between photons in two coherent beams of light. Nature 1956, 177, 27–29
- Gardiner and Zoller 2004 Gardiner, C.; Zoller, P. Quantum noise: a handbook of Markovian and non-Markovian quantum stochastic methods with applications to quantum optics; Springer Science & Business Media, 2004; Vol. 56
- Simpson et al. 2007 Simpson, S. H.; Benito, D. C.; Hanna, S. Polarization-induced torque in optical traps. Physical Review A 2007, 76, 043408
- Arita et al. 2013 Arita, Y.; Mazilu, M.; Dholakia, K. Laser-induced rotation and cooling of a trapped microgyroscope in vacuum. Nature communications 2013, 4, 2374
- Schell et al. 2017 Schell, A. W.; Kuhlicke, A.; Kewes, G.; Benson, O. “Flying Plasmons”: Fabry-Pérot Resonances in Levitated Silver Nanowires. ACS Photonics 2017, 4, 2719–2725
- Paschen 1889 Paschen, F. Ueber die zum Funkenübergang in Luft, Wasserstoff und Kohlensäure bei verschiedenen Drucken erforderliche Potentialdifferenz. Annalen der Physik 1889, 273, 69–96
- Toyli et al. 2012 Toyli, D. M.; Christle, D. J.; Alkauskas, A.; Buckley, B. B.; Van de Walle, C. G.; Awschalom, D. D. Measurement and Control of Single Nitrogen-Vacancy Center Spins above 600 K. Phys. Rev. X 2012, 2, 031001
- Dolenko et al. 2015 Dolenko, T. A.; Burikov, S. A.; Dolenko, S. A.; Efitorov, A. O.; Plastinin, I. V.; Yuzhakov, V. I.; Patsaeva, S. V. Raman Spectroscopy of Water–Ethanol Solutions: The Estimation of Hydrogen Bonding Energy and the Appearance of Clathrate-like Structures in Solutions. The Journal of Physical Chemistry A 2015, 119, 10806–10815
- Kurtsiefer et al. 2000 Kurtsiefer, C.; Mayer, S.; Zarda, P.; Weinfurter, H. Stable Solid-State Source of Single Photons. Phys. Rev. Lett. 2000, 85, 290–293
- Ma et al. 2017 Ma, Y.; Hoang, T. M.; Gong, M.; Li, T.; Yin, Z.-q. Proposal for quantum many-body simulation and torsional matter-wave interferometry with a levitated nanodiamond. Phys. Rev. A 2017, 96, 023827
- Delord et al. 2017 Delord, T.; Nicolas, L.; Chassagneux, Y.; Hétet, G. Strong coupling between a single nitrogen-vacancy spin and the rotational mode of diamonds levitating in an ion trap. Phys. Rev. A 2017, 96, 063810
2 Supplementary information
2.1 Particle dispersion
Nanodiamonds from Adámas Nanotechnologies (40 nm in diameter, 1-4 NV) were used for the experiment. 20 l of the commercial dispersion were dispersed in 40 ml of ethanol and pumped to the electrospray using a syringe. To avoid particle clustering, we utilised a syringe filter with 100 nm pore size. Furthermore the dispersion was sonicated for 10 minutes before the experiment.
2.2 Particle loading
A custom made electrospray system was introduced into the chamber at ambient pressure, and a camera and a 980 nm laser were used to display and illuminate the trapping region in real time. Particles were injected with the electrospray by activating a 3 kV voltage source and then pumping the dispersion. Particles ejected with the electrospray would pass through the center of the trap potential. Some would lose enough energy due to air damping to stay trapped in the potential, and it was usual to trap several at once. Excess particles were pushed out of the trap by carefully reducing the voltage. After only a single particle remained, the electrospray was removed and the vacuum chamber closed.
2.3 Oscillation frequencies and -factor calculation
Under the adiabatic approximation, the power spectral density of the particle’s COM will take the expression
| (S1) |
where is the particle’s mass, is the Brownian noise standard deviation, the secular angular frequency of the oscillator and its quality factor. By introducing the reduced damping constant , which for low damping corresponds to the full width at half maximum of the oscillator response, the quality factor is defined as . By fitting the measured power spectral density to expression S1, we can indirectly measure the value of and .
Observed secular frequencies in the trap axis direction (for ) are specified in table 1.
| Min. freq | Typical | Max. freq |
|---|---|---|
| – | (1.5 kHz, 6 kHz) | 15 kHZ |
2.4 Excess charge determination
The charge of the particle can be calculated as follows: since the particle’s mass is known (this is a reasonable assumption, given the fact that we filter the particles by size with a porous filter). In the underdamped regime (i.e., low damping by air molecules), the equation of motion for the center of mass of the particle is described by the Mathieu30 equation,
| (S2) |
where . Here, is the particle charge (not to be confused with , the quality factor), the voltage, the particle mass, a geometrical parameter (which is constant and can be calculated for a given trap) and the driving angular frequency. Since we set the voltage and frequency, the only unknown parameter is . Thus, if the parameter can be measured, we can solve equation S2 for and find the particle charge.
This parameter can be found indirectly. Firstly, we measure the ratio between the particle secular frequency and the driving frequency, . is a characteristic exponent of the Mathieu’s equation, and is a function of only: . Therefore, by numerically inverting the expression we get . Finally, by plugging the obtained value and calculating
| (S3) |
we can estimate the particle charge. Usual elementary charge numbers that we have measured this way lay in the range of 40 to 150 e+.
2.5 Feedback
The radio frequency signal applied to the inner rod has the expression
| (S4) |
The spectrum of the particle motion has a peak at , corresponding to its secular frequency. Since the feedback is a parametric modulation, will enter the equation of motion as a product with . By a trigonometric identity, this product results in two driving signals at and components, but since the is off-resonance, this component can be neglected. Thus, the modulation will have approximately a driving effect on the motion of the particle: by adjusting the delay accordingly (in phase or at push-pull), we can make it excite or damp the oscillation.
If all three axis need to be cooled, the secular frequencies of the trap requires different values for every axis; otherwise, cooling one axis could result in heating another with the same degenerate frequency, since phase between translational modes is uncoupled. Although our trap has symmetry of revolution, and thus two equal eigenfrequencies, this symmetry can be broken to separate all three frequencies by slightly modifying the electrodes.
2.5.1 Effective temperature
When the nanoparticle is close to the potential minimum of a deep trap, the oscillations can be treated as approximately harmonic. In that case, the average number of vibrational excitations at thermal equilibrium is given by the Bose-Einstein distribution
| (S5) |
where is the frequency of harmonic oscillations. In the limit of high temperature this reduces to the equipartition expression (via first order Taylor expansion)
| (S6) |
where is the average energy. Therefore, given some experimentally determined or , one can obtain an effective temperature according to the above formulae, whether or not the system is truly at equilibrium.
2.6 Intensity correlation measurements
An Olympus LMPLFLN 100x objective, with NA 0.8, was used to collect and collimate the fluorescence of the NV center, and single photons were detected with Perkin Elmer SPCM-AQR-14 APDs. Single photon counting was performed with a PicoHarp 300 system.
2.6.1 Background correction
For continuous excitation, the joint second order correlation function of an emitter with intensity and a background noise with intensity will be
| (S7) | ||||
| (S8) |
where is the emitter second order correlation function and it has been assumed that
-
•
The background noise is quantum mechanically uncorrelated with the emitter fluorescence
-
•
Therefore, by measuring and it is possible to correct (which is the function measured in our single photon counting system) to obtain the emitter .
Analogously, by defining , we obtain
| (S9) |
Background noise was measured to be counts per second, where 150 was the average dark count rate in our APDs and was a pumping laser intensity dependent fluorescence contribution, due to optical elements in our setup.
2.6.2 Model fitting
The sets of measured functions are fitted with a least squares criterion to a modified three-level model40 after background subtraction
| (S10) |
Since we do not measure but , where is the APD system instrument response function, we fit the data with instead. With the obtained parameters, we calculate to determine whether the emitter is a single photon source or not. The confidence levels for with where calculated from the inferred distribution.
Measurements of three particles are shown in Figure S11.