Discovery of a new classical nova shell around a nova-like cataclysmic variable
Abstract
The morphology and optical spectrum of IPHAS XJ210205+471015, a nebula classified as a possible planetary nebula, are however strikingly similar to those of AT Cnc, a classical nova shell around a dwarf nova. To investigate its true nature, we have obtained high-resolution narrow-band [O iii] and [N ii] images and deep GTC OSIRIS optical spectra. The nebula shows an arc of [N ii]-bright knots notably enriched in nitrogen, whilst an [O iii]-bright bow-shock is progressing throughout the ISM. Diagnostic line ratios indicate that shocks are associated with the arc and bow-shock. The central star of this nebula has been identified by its photometric variability. Time-resolved photometric and spectroscopic data of this source reveal a period of 4.26 hours which is attributed to a binary system. The optical spectrum is notably similar to that of RW Sex, a cataclysmic variable star (CV) of the UX UMa nova-like (NL) type. Based on these results, we propose that IPHASX J210205+471015 is a classical nova shell observed around a CV-NL system in quiescence.
1 Introduction
Many Galactic emission line surveys have been completed in recent years. Most of them have focused on the H line (e.g., the Southern H Sky Survey Atlas SHASSA, the INT Photometric H Survey IPHAS, the SuperCOSMOS H Survey SHS, and the VST Photometric H Survey of the Southern Galactic Plane and Bulge VPHAS+, Gaustad et al., 2001; Drew et al., 2005; Parker et al., 2005; Drew et al., 2014), but also on molecular emission lines of H2 (e.g., the UKIRT Widefield Infrared Survey for H2 UWISH, Froebrich et al., 2011). These surveys offer the possibility to detect different types of diffuse emission sources and emitting-line stars (Witham et al., 2008; Froebrich et al., 2015). Among the former, many new planetary nebulae (PNe, Viironen et al., 2009; Sabin et al., 2014), Wolf-Rayet (WR) nebulae (Stock & Barlow, 2010; Gvaramadze et al., 2010), novae (Sahman et al., 2015; Wesson et al., 2008), nebulae ejected from massive evolved stars (Wright et al., 2014), and supernova remnants (Sabin et al., 2013) candidates have been uncovered, whereas among the latter many emission line star candidates such as chromospherically active T-Tauri and late-type stars (Barentsen et al., 2011; Kalari et al., 2015), Be stars (Raddi et al., 2013), massive early stars (Mohr-Smith et al., 2015), interacting binaries and cataclysmic variables (Pretorius & Knigge, 2008), and symbiotic stars (SS, Corradi et al., 2010) have been reported.
Follow-up spectroscopic observations are in most cases required to verify the nature of these sources. This has been the case of Galactic PNe, whose number has increased notoriously (see the compilations in the Macquarie and Hong-Kong/Australian Astronomical Observatory/Strasbourg Observatory H Planetary Nebula MASH PN and HASH PN databases, Parker et al., 2006; Parker, Bojičić, & Frew, 2016). In an attempt to confirm the nature of IPHAS PN candidates, Sabin et al. (2014) has carried out a spectroscopic follow-up of IPHAS sources and identified 159 new true, likely, and possible PNe. Among these sources, the nebula IPHASX J210204.7471015 (aka PN G088.000.4, hereafter J210204), classified as possible PN, has very peculiar morphology and spectral properties. The IPHAS H+[N ii] image reveals an arc-like of emission which is reminiscent of the morphology seen in the nova shell around the dwarf nova (DN) AT Cnc (Shara et al., 2012). Moreover, the optical spectrum reveals a lack of Balmer lines which is not typical for PNe, but frequently seen in nova shells (Tarasova, 2014). The morphology and spectral properties of J210204 cast doubts on its PN nature and rather point to a nova event at its origin.
Nebular shells around novae are scarce (Sahman et al., 2015), but they reveal interesting information to date the nova event, to study the details of the nova ejection, and to investigate its interaction with the circumstellar (CSM) and interstellar (ISM) media. This has motivated us to undertake an observational project to investigate the real nature of J210204. Deep narrow-band optical images have been used to study in detail its morphology, whereas deep optical spectra of its nebular emission have been obtained to assess its spectral properties. The central star has been identified and photometric and spectroscopic monitoring have been used to study its variability. These observations are described in Section §2. The nebular morphology and spectral properties, and the stellar properties are presented in Section §3. The nature and evolutionary status of J210204 are discussed in Section §4.
2 Observations
2.1 NOT Optical Imaging
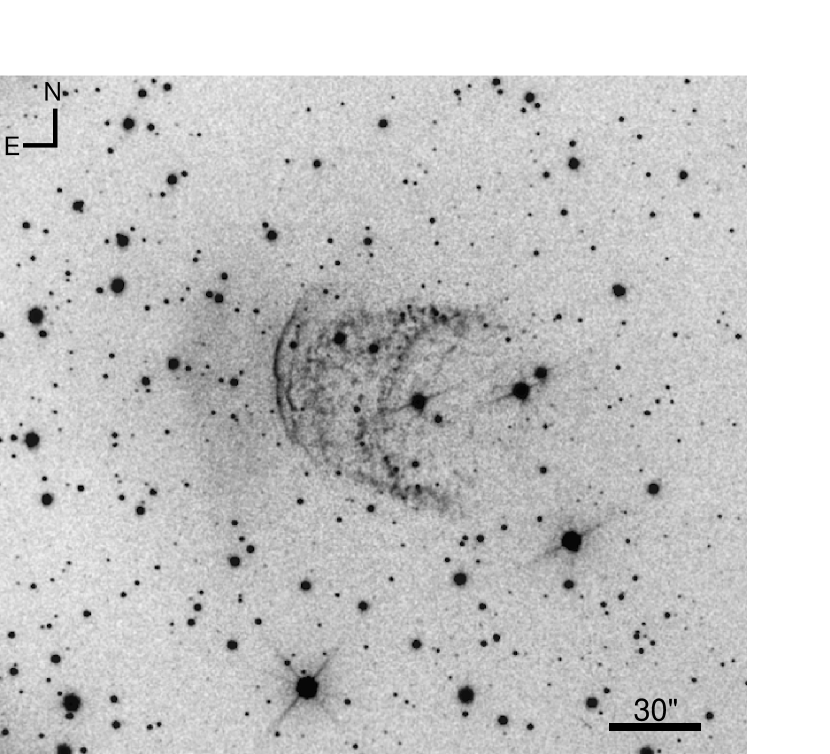
Narrow-band optical images in the [O iii] 5007 and [N ii] 6583 lines were obtained on May 27 and 28, 2017 using the Andalucia Faint Object Spectrograph and Camera (ALFOSC) mounted at the Cassegrain focus of the 2.5m Nordic Optical Telescope (NOT) at the Observatorio de El Roque de los Muchachos (ORM, La Palma, Spain). The images were obtained using the NOT #90 [O iii] 501_3 and the Observatorio de Sierra Nevada (OSN) [N ii] #E16 narrow-band filters with central wavelenghts (and full-width half maximum, ) of 5007 Å (30 Å) and 6584 Å (10 Å). The EEV 231–42 2K2K CCD was used, providing a pixel scale of 0211 and a field-of-view (FoV) of 70.
Three 1200s and two 900s were secured in the [O iii] and [N ii] filters, respectively, to remove cosmic rays. The images were bias subtracted and flat-fielded using appropriate sky flat field images, and then combined using IRAF111 IRAF is distributed by the National Optical Astronomy Observatories, which are operated by the Association of Universities for Research in Astronomy, Inc., under cooperative agreement with the National Science Foundation. standard routines. The spatial resolution of the images, as derived from stars in the FoV, is 07. The [O iii] and [N ii] images of J210204 are presented in Figure 1, together with a composite color picture in Figure 2.
2.2 SPM Photometric and Spectroscopic Monitoring
2.2.1 Photometry
The CCD camera Mexman mounted on the 0.84m telescope of the Observatorio Astronómico Nacional at San Pedro Mártir (OAN SPM, Mexico) was used to perform time-resolved photometry of the stellar field around J210204. The E2V-4240 CCD (“Spectral Instrument 1”) detector was used. The detector has 20482048 pixels with size 13.5 m, but a 22 binning was used during the observations. The resulting plate scale and FoV were 0434 and 7474, respectively. Alternating BVRI observations where taken with exposure times of 60, 40, 20, and 15-20s, respectively. A preliminary inspection of these datasets reveals the variability of the bright star at the geometrical center of J210204 (see Figure 2), which was then selected as the most likely progenitor of this nebula. The coordinates of this star, as implied from the astrometric measurements and corrections for all IPHAS objects (Barentsen et al., 2014), are = 21h 02m 05s.82, = +47∘ 10 18.00. The positional error of this source, as referenced to the 2MASS data catalogue, is 006. For consistency, we will keep the designated IPHAS name for the central star, which hence is IPHAS J210205.83+471018.0.
The log of the photometric observations can be found in Table 1. Data were reduced using standard IRAF aperture photometry routines. In preparation for this work, the same field was observed on August 26, 2016 and calibrated with Landolt standard stars. The star 2MASS J21020346+4707113, with measured magnitudes of =14.04, =13.42, =13.01, and =12.57, was found to be the best reference star, since it has the most similar colors to those of the target star.
| Date | HJD start time | HJD end time | Coverage |
|---|---|---|---|
| +2457600 | +2457000 | ||
| (day) | (day) | (hours) | |
| 2016-08-31 | 31.795520 | 31.971839 | 4.2 |
| 2016-09-01 | 32.808253 | 32.971219 | 3.9 |
| 2016-09-02 | 33.817217 | 33.965623 | 3.6 |
| 2016-09-29 | 60.688186 | 60.815632 | 3.1 |
| 2016-10-01 | 62.661248 | 62.876114 | 5.2 |
| 2016-10-02 | 63.693037 | 63.836978 | 3.4 |
| 2016-10-03 | 64.665781 | 64.821321 | 3.7 |
| 2016-10-05 | 66.622653 | 66.734812 | 2.7 |
2.2.2 Spectroscopy
Time-resolved spectroscopic data were obtained with the Boller & Chivens spectrograph installed on the OAN SPM 2.1m telescope. We obtained a series of spectra using the 1200 l mm-1 grating, which provides a spectral dispersion of 1.16 Å pix-1. Coupled with the slit-width of 15, this results in a spectral resolution 3.2 Å, suitable to study radial velocity variations of 30 km s-1. The 600 l mm-1 grating was also used to obtain low resolution spectra covering a wide range of wavelengths in the optical domain. The CuArNe lamp was employed to obtain wavelength calibration arcs. The spectro-photometric standards Feige 110, BD+28∘4211 and G 191B2B were observed each night to allow the flux calibration of the source spectra. Standard procedures, including bias and flat-field correction, cosmic ray removal, and wavelength and flux calibration were applied using IRAF routines. Table 2 presents the log of these spectrophotometric observations.
| Date | HJD | Telescope | Instrument | Spectral | Spectral | Number of | Exposure | Time |
|---|---|---|---|---|---|---|---|---|
| +2450000 | coverage | dispersion | exposures | time | coverage | |||
| (day) | (Å) | (Å pix-1) | (s) | (m) | ||||
| 2016-08-10 | 7610 | OAN 2.1m | B&Ch | 4400-5620 | 0.59 | 5 | 1200 | 100 |
| 2016-08-11 | 7611 | OAN 2.1m | B&Ch | 4400-5620 | 0.59 | 5 | 1200 | 100 |
| 2016-08-12 | 7612 | OAN 2.1m | B&Ch | 4400-5620 | 0.59 | 9 | 1200 | 200 |
| 2016-08-14 | 7614 | OAN 2.1m | B&Ch | 4400-5620 | 0.59 | 6 | 1200 | 120 |
| 2016-08-15 | 7615 | OAN 2.1m | B&Ch | 4400-5620 | 0.59 | 6 | 1200 | 120 |
| 2016-08-28 | 7628 | GTC | OSIRIS | 3650-7820 | 2.07 | 8 | 340 | 75 |
| 2016-08-28 | 7628 | GTC | OSIRIS | 5110-10340 | 2.59 | 8 | 300 | 75 |
| 2016-09-25 | 7656 | OAN 2.1m | B&Ch | 4150-6510 | 1.16 | 9 | 900 | 140 |
| 2016-09-26 | 7657 | OAN 2.1m | B&Ch | 4350-6710 | 1.16 | 15 | 900 | 230 |
2.3 GTC Optical Spectra
Intermediate-resolution long-slit spectroscopic observations were carried out with OSIRIS (Optical System for Imaging and low-Intermediate-Resolution Integrated Spectroscopy) at the 10.4m GTC telescope of the ORM on June 10, 2016 and August 28, 2016. OSIRIS was used in standard mode, with two Marconi CCD42-82 (20484096 pixels) detectors. The 22 on-chip binning resulted in a spatial scale of 0254 pix-1. The R1000B and R1000R grisms were used to acquire spectra in the blue and red regions of the optical spectrum, respectively, covering the spectral range from 3630 Å to 10000 Å. Their spectral dispersions are 2.12 Å pix-1 and 2.62 Å pix-1, respectively. A slit-width of 12 was used, resulting in a spectral resolution 9 Å.
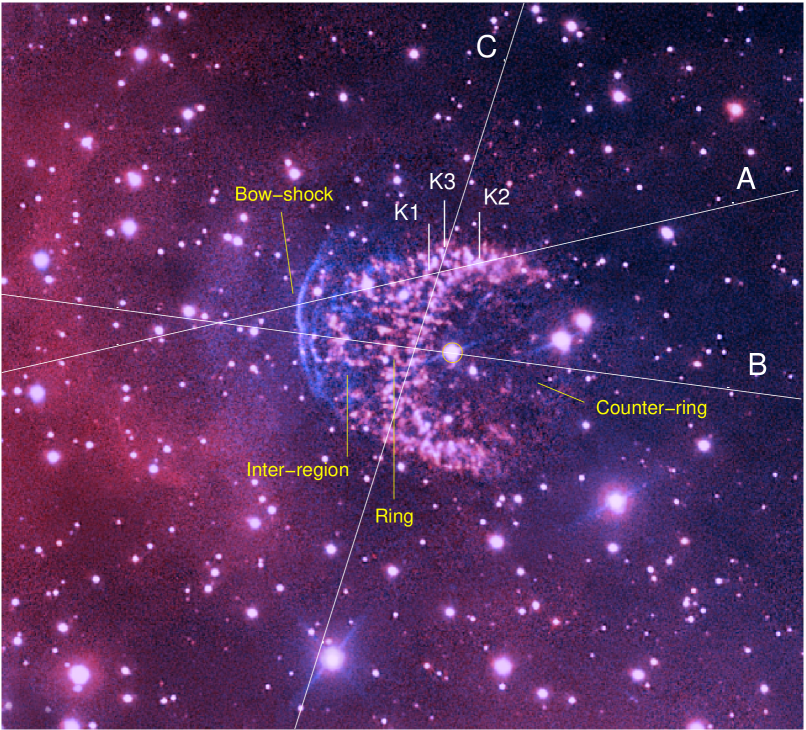
The slit, with length 74, was placed along different position angles (PA) to cover distinct morphological components of J210204. The details of the observations are listed in Table 3, including the slit keyword (as shown in Figure 2), the grism, PA, offset from the central star, and number of exposures and integration time at each slit position. These datasets are also described in Table 2.
The data reduction was carried out using standard IRAF routines. Hg-Ar, Ne, and Xe arcs were used for wavelength calibration. The spectro-photometric standards G191-B2B and Feige 110 were used for flux calibration. The seeing, as determined from the FWHM of the continuum of field stars covered by the slit, was 10.
| Position | Grism | PA | offset | Nexp | texp |
|---|---|---|---|---|---|
| (∘) | (′′) | (s) | |||
| A | R1000B | 103 | 24.6 | 2 | 738 |
| A | R1000R | 103 | 24.6 | 2 | 600 |
| B | R1000B | 83.5 | 0 | 8 | 340 |
| B | R1000R | 83.5 | 0 | 8 | 300 |
| C | R1000B | 164 | 12.7 | 2 | 738 |
| C | R1000R | 164 | 12.7 | 2 | 600 |
3 Data Analysis
3.1 The Nebula
3.1.1 Morphology
The most noticeable structure revealed by the narrow-band images is a [N ii]-dominated arc-like feature (Figs. 1-right and 2). It consists of a myriad of knots distributed along two parallel strings that interweave at their tips. Many of those knots have a cometary morphology, with tails pointing outwards. A few knots also trace an Eastern counterpart of the arc, but they are much fainter and sparse. The Western double arc feature is also detected in [O iii], but the emission in this line is much smoother (Fig. 1-left). We will refer to these two regions as the “ring” and the “counter-ring”, respectively, as marked in Figure 2.
There is an additional string of knots West of the ring, whose emission is similarly bright in the [N ii] and [O iii] emission lines. It must be noted, however, that the [N ii] emission from this third arc arises from a sparse ensamble of discrete knots, whereas the [O iii] emission does from a smooth arc. We will refer to this feature as the “inter-region” (Fig. 2).
There is another arc of emission external to the previous ones. This arc is notably bright in [O iii] with very faint [N ii] emission. Contrary to the previous morphological features described above, the emission from this double-arc structure is notably sharp. Its morphology is clearly reminiscent of a bow-shock structure, and so we will refer to it as the “bow-shock” (Fig. 2).
Along with these main morphological components, there are two additional arcs of diffuse emission in front of the “bow-shock” structure: the first one detected both in [O iii] and [N ii] at 15 from the central star (Figs. 1 and 2), the second one detected only in [N ii] at 20 from the central star (Figs. 1-right and 2). This second arc along the direction of the [O iii] bow-shock is confirmed in large-scale IPHAS H+[N ii] images.
3.1.2 Spectral Properties
We have used the deep GTC OSIRIS observations to extract one-dimensional spectra of the different morphological components of J210204. The spectra, shown in Figure 3, corresponds to the bow-shock structure, the ring of [N ii]-bright knots, the inter-region, and the counter-ring.
As expected, the spectrum of the bright ring is dominated by the [N ii] 6548,6584 emission lines. The auroral [N ii] 5755 emission line is also detected, as well as the [N i] 5199 emission line. The [O iii] 4959,5007 lines and the [O ii] 3727 doublet are also detected, but they are much fainter than the [N ii] emission lines. Weak emission from the [S ii] 6717,6731 doublet is also detected. The Balmer lines are very weak and no helium lines are detected.
We note that the spectrum of different knots may vary significantly among them. We have selected three individual knots, marked in Figure 2 as K1, K2, and K3, to illustrate these variations. The spectra of these knots are shown in Figure 4. Knot K1 has the lowest [O iii]/[N ii] and [O ii]/[N ii] line ratios. Knots K2 and K3 have [O iii]/[N ii] line ratios typical of the ring, 0.3, but the [O ii]/[N ii] line ratios differ notably, from 0.5 in K2 to 0.2 in K3.


| Line ID | Bow-shock | Inter-region | Ring | Counter-ring | Knot #1 | Knot #2 | Knot #3 |
|---|---|---|---|---|---|---|---|
| ( erg cm-2 s-1) | |||||||
| [O ii] 3727 | 4.16 | 1.62 | 30.9 | 1.34 | 4.30 | 0.93 | |
| He ii 4686 | 0.20 | ||||||
| H | 0.47 | 0.052 | 1.55 | 0.17 | 0.08 | 0.25 | |
| [O iii] 4959 | 2.53 | 0.93 | 13.8 | 0.47 | 1.83 | 0.83 | |
| [O iii] 5007 | 8.82 | 3.24 | 4.66 | 0.19 | 1.22 | 5.97 | 2.76 |
| [N i] 5199 | 3.66 | 0.16 | 0.30 | 0.26 | |||
| [N ii] 5755 | 5.09 | 0.43 | 0.72 | 0.14 | |||
| [N ii] 6548 | 0.31 | 1.12 | 81.2 | 0.39 | 6.10 | 8.33 | 4.53 |
| H | 2.35 | 0.27 | 10.3 | 1.19 | 0.65 | 0.91 | |
| [N ii] 6584 | 1.05 | 3.55 | 254 | 1.33 | 18.1 | 26.4 | 13.8 |
| [S ii] 6716 | 0.52 | 0.044 | 1.64 | 0.18 | |||
| [S ii] 6731 | 0.35 | 0.035 | 1.03 |
| Line ID | Bow-shock | Inter-region | Ring | Counter-ring | Knot #1 | Knot #2 | Knot #3 |
|---|---|---|---|---|---|---|---|
| [O ii] 3727 | 14.65.6 | 5113 | 32.91.6 | 13.53.5 | 955 | 0.200.08 | |
| He ii 4686 | 0.470.23 | ||||||
| H | 1.000.22 | 1.01.0 | 1.000.18 | 1.000.29 | 1.00.8 | 1.000.22 | |
| [O iii] 4959 | 5.190.20 | 17.00.5 | 8.590.20 | 2.650.29 | 23.50.7 | 3.220.22 | |
| [O iii] 5007 | 17.700.25 | 58.40.5 | 28.510.26 | 227 | 6.900.35 | 75.40.8 | 10.440.25 |
| [N i] 5199 | 2.070.15 | 0.880.29 | 3.50.6 | 0.910.19 | |||
| [N ii] 5755 | 2.370.12 | 1.830.22 | 6.90.5 | 0.410.12 | |||
| [N ii] 6548 | 0.370.11 | 12.270.27 | 30.160.15 | 27.92.4 | 20.870.16 | 63.80.4 | 10.400.11 |
| H | 2.860.13 | 3.000.27 | 3.800.08 | 4.050.15 | 4.940.32 | 2.090.11 | |
| [N ii] 6584 | 1.270.13 | 38.460.31 | 93.460.27 | 93.52.6 | 58.820.22 | 200.00.5 | 31.250.16 |
| [S ii] 6716 | 0.610.11 | 0.420.19 | 0.580.07 | 0.590.14 | |||
| [S ii] 6731 | 0.410.11 | 0.350.23 | 0.360.06 |
The spectrum of the counter-ring looks very similar to that of the ring, although it is much fainter. On the contrary, the spectrum of the bow-shock feature is dominated by the [O iii] 5007,4959 emission lines. H emission is present, as well as H. Indeed, H emission is brighter than the [N ii] emission. Actually, owing to the presence of large-scale diffuse H and H emissions, which make difficult the subtraction of the background emission, this is the only region where the detection of the Balmer lines are reliable.
Finally, the intensity of the [N ii] 6584 and [O iii] 5007 emission lines is very similar in the inter-region, i.e., their ratio shows an averaged behaviour between those of the bow-shock and ring spectra. The H line is detected, but the intensity of the H line is rather unreliable.
We show in Table 4 the emission line fluxes measured for the different regions of J210204. The fluxes of the [N ii] 6548,6584 and [O iii] 5007,4959 emission lines can be considered to be reliable, within a few percent, except for the [O iii] 5007 emission line in the counter-ring region. The fluxes of the H emission line in the bow-shock spectra and the [O ii] 3727 doublet and [N ii] 5755 and [N i] 5199 emission lines in the ring spectrum are also reliable.
We have used the H to H ratio in the bow-shock region to derive a logarithmic extinction of 0.73. This correction has been applied to all regions. The relative intensities in Table 5 have been referred to that of H equal to 1, but for the region of the counter-ring, where the Balmer lines are not detected. In this region, the relative intensities of the [N ii] and [O iii] lines have been referred to that of the [N ii] 6584 line in the ring.
3.1.3 Excitation and Chemical Abundances
The relative line intensities listed in Table 5 are revealing. The weak emission in the H and H lines implies that all regions have mostly high line ratios of [S ii]/H, [N ii]/H, [O iii]/H, and/or [O ii]/H: wherever the [S ii] lines are detected, the [S ii]/H line ratio is larger than 0.25, and the ring has [O ii]/H and [N ii]/H line ratios 30 and 25, respectively. The spectrum of the bow-shock is remarkably different to that of the ring, as it exhibits a low [N ii]/H line ratio and emission in the He ii 4686 line. The line ratios detected in the different regions of J210204 discard a photo-ionization excitation, but they rather suggest that line emission is mostly excited by shocks (Hartigan, Raymond, & Hartmann, 1987).
The MAPPINGS 5.13 code (Sutherland & Dopita, 2017) has been used to investigate key line ratios detected in the bow-shock, inter-region and ring to assess the properties of these shocks and the chemical abundances of the emitting material. Unfortunately, the available emission line ratios are insufficient to fit simultaneously all parameters that critically determine the plasma emitting properties, mostly the shock velocity, chemical abundances, pre-ionization state of the gas, age of the shock, pre-shock density, and to a minor extent the magnetic field.
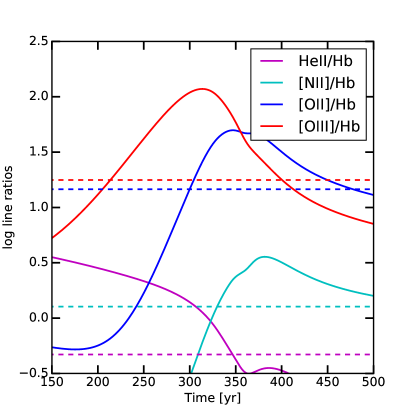
As for the bow-shock, a set of models was built using MAPPINGS 5.13 and its line ratio predictions compared to those listed in Table 5. Since the shocked gas is expected to be dominated by ISM material, its chemical abundances have been assumed to be solar (Asplund et al., 2009), and the pre-shock density and magnetic field have been adopted to be 5 cm-3 and 1 G, respectively. The MAPPINGS models show that complete shocks lead to very low values of the [O iii]/H line ratios, indicating that the shock is incomplete, i.e., the shock has not had enough time to fully recombine and cool down yet. The predicted time evolution of some line ratios for a shock velocity of 150 km s-1 and the observed values are shown in Figure 5. The He ii/H, [O ii]/H, [O iii]/H, and [N ii]/H line ratios are reproduced at times varying between 200 and 500 years. Line ratios vary on a first-order linearly with the elemental abundances, making everything fit at an age 350 yr if the oxygen abundances were reduced by a factor of three. We note, however, the strong degeneracy between age, shock velocity and abundances and the obvious simplicity of the model, which does not account for geometrical effects that superpose shocks of differing properties along the line of sight.
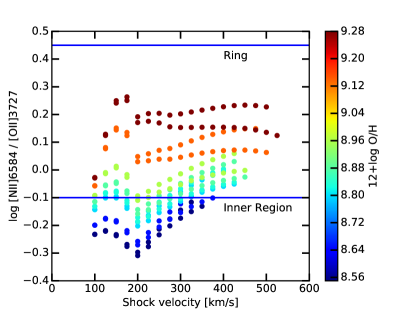
As for the ring and inter-region, the significant [N ii]/[O ii] line ratio variations between the ring (2.8) and inter-region (0.8) suggest the chemical enrichment of the material at the ring. The variations of the [N ii]/[O ii] line ratio have been simulated using also MAPPINGS for a range of shock velocities and O/H abundances, adopting this time a pre-shock density of 1000 cm-3, consistent with the nova CSM material, and assuming the shock has had enough time to become complete. The results, plotted in Figure 6, are shown for solar N/O ratios, but the [N ii]/[O ii] line ratio can be scaled with the N/O ratio. This plot reveals that, for shock velocities above 200 km s-1, the [N ii]/[O ii] line ratio can be used as a diagnostic of the O/H abundances and N/O abundances ratio. The high [N ii]/[O ii] line ratio of the ring can only be interpreted with extremely high over-solar abundances (O/H4(O/H)⊙) or over-solar N/O ratios (N/O5(N/O)⊙), or both of them, whereas the inter-region shows O/H abundances or N/O abundances ratio slightly over-solar. The large variations in the [N ii]/[O ii] line ratio among discrete knots in the ring can be similarly interpreted as evidence of large variations in their metallicity.
3.2 The Central Star
3.2.1 Spectral Properties
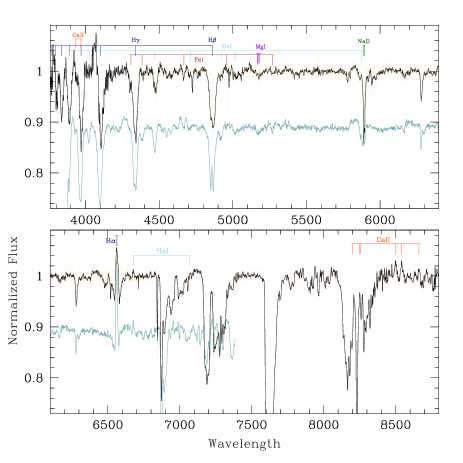
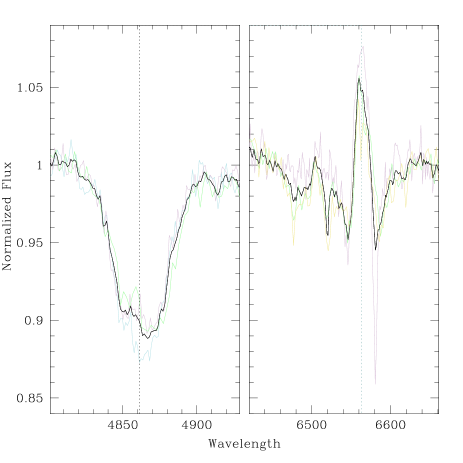
The normalized spectrum of the central star of J210204 presented in Figure 7 reveals prominent broad Balmer hydrogen absorption lines with embedded central emission peaks. Neutral helium lines are also observed as a combination of wide absorption and narrow emission. Strong NaD and a set of Fraunhofer lines are also detected in absorption in this spectrum, whilst Ca ii and a blend of C iii and fluorescent N iii lines at 4640-50 Å are clearly seen in emission. The most prominent lines are marked with different colors in Figure 7.
3.2.2 Photometric Variability
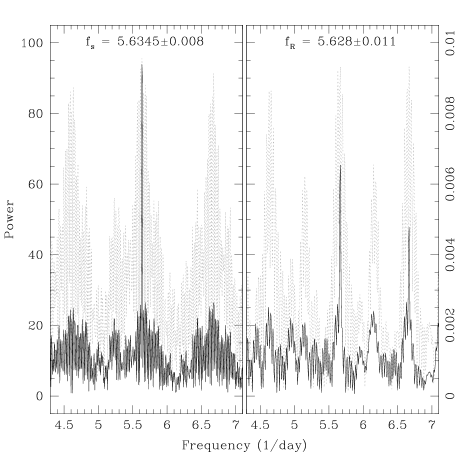
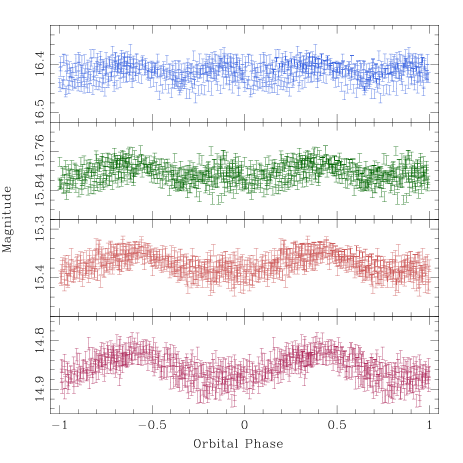
The measured mean and 1- deviation magnitudes derived from the photometric data obtained during the two main observing runs are 16.4160.009 mag in the -band, 15.8050.009 mag in the -band, 15.3730.012 mag in the -band, and 14.8560.013 mag in the -band. The inspection of the light curves reveals notable fluctuations. The discrete Fourier transform (DFT) based program Period04 (Lenz & Breger, 2005) was used to search for possible periodicities in the photometric data. The best results showing the lower dispersion are obtained in the -band, for which a frequency day-1 is found as revealed by the main peak in the power spectrum (dotted grey line in Figure 8-right). One day aliases are strong, given the observational strategy; indeed, the power spectrum corresponding to the -band actually peaks at 6.63 day-1, i.e. . There is also a number of noticeable secondary peaks, resulting from the significant noise level in the power spectra induced by the low resolution of the photometric dataset. The convolution of the observed power with the spectral window helps to supress aliases using a procedure appropriately called Clean (Roberts et al., 1987). The cleaned power spectrum of the -band light curve (solid black line in Figure 8-right) confirms the low frequency peak. The frequency derived from the -band implies a photometric period 4.2640.007 hours. The folded light curve with this frequency show little variation in shape among the different photometric bands (Figure 9). The global change in magnitudes throughout the different bands is relatively small, 0.1 mag.
There is also a remarkable trend in the long-term light curve. The power spectrum reveals the presence of a peak at , which would imply a cyclical variability with a period of 11.7 day, although we reckon that the length of the observing runs is not appropriate to investigate suah a long-term variability. Another noteworthy peak is actually a one-day alias at a frequency that corresponds to a period of 26.1 hours. The power strength shifts from one peak to the other depending on the photometric band.
3.2.3 Radial Velocity Variability
The photometric variability may be associated with radial velocity (RV) variations. To investigate these, we have used the narrow emission component of the Balmer H line and the Balmer H absorption line (see Figure 10). The H line is not symmetric and very wide, with a Å and a full-width at zero intensity () up to Å. In absence of a clear understanding of the nature of different components which may form the H line profile, we measured it using a single Gaussian. The analysis of the RV variations with Period04 clearly shows periodic modulation, with a strong peak around a frequency of 5.6 day-1 (with its unavoidable one-day alias). In a similar way as for the photometric light curves, the uneven time series produces alias peaks in the power spectrum. These have been convolved with the spectral window to clean aliases. The raw and cleaned resulting power spectrum are shown in the left panel of Figure 8, where the cleaned power spectrum peak corresponds to a frequency day-1 (or to a period = 4.2600.006 hours). This value deviates from the period derived from the photometric data by 0.3 minutes, which is within the 3- formal uncertainty. In the following, we will favor the period determined from spectroscopic observations, as this has been derived from a more complete time series distribution and the data analysis shows a more robust variability. Additional photometric and spectroscopic data are needed to improve the accuracy of the period determination to assess whether there is a real difference between the spectroscopic and the photometric period.
As for the H line, we measured only the dominant emission peak located close to the rest wavelength of the line. Even though this component looks single-peaked and narrow, compared to the entire H complex, it actually splits into two components at certain orbital phases. We used the de-blending option in the IRAF procedure splot to fit two distinct Gaussian components to the line profile whenever they were present. The brightest component is basically seen throughout the whole orbital cycle and it follows the RV curve deduced from H, but with a much smaller RV amplitude. The RV of the narrower and fainter component, which is detected only in half of the orbital phases, varies in a near counter-phase to the first component and to the wide absorption measured with H.
Finally, a careful examination of the NaD doublet shows a faint component with variable RV in addition to the deep narrow absorption lines that can be attributed to the interstellar and may be circumstellar media. The variable component is in phase with the wide H absorption.
4 On the nature of IPHASX J210204.7+471015
4.1 The central star IPHAS J210205.83+471018.0
The optical spectrum of the central star of J210204 shows wide absorption lines of H i and He i with narrow emission cores. These spectral features are distinctive of UX UMa nova-like (NL) systems (Dhillon, 1996), a sub-class of non-magnetic cataclysmic variable stars (CVs). Indeed, the comparison of the optical spectrum of the central star of J210204 with that of the UX UMa-system RW Sex (Beuermann et al., 1992, and references therein) obtained with the same settings at the same telescope (Hernández et al., 2017) show that both spectra are basically identical (Fig. 7). Both stars show spectral lines mostly in absorption, which is consistent with a rather optically thick accretion disc in a NL, although sometimes it is difficult to discern them from similar set of lines produced by a K donor star. The main difference between the spectrum of RW Sex and that of J210204 central star is the presence of multiple emission peaks inside Balmer lines (Figure 10), a fact normally associated with a post-nova shell stage. Emission lines are limited to the notable H line, and to the high excitation lines of He ii 4686 Å and a blend of C iii and fluorescent N iii at 4650 Å. This places the central star of J210204 on the upper part (or high state) in the disc surface density () vs disc temperature (T) plot (Mineshige & Osaki, 1985; Cannizzo, 1993), i.e., the locus of CV-NL objects, a sub-class of CVs characterized by high and stable mass transfer rates ( yr-1) and a steady state accretion disc (Meyer & Meyer-Hofmeister, 1982). Accordingly, the brightness of NLs does not vary significantly around its mean level, in agreement with the small 0.1 mag variation found for J210204 (Figure 9).
The concordant periodic photometric and RV variations of the central star of J210204 reinforces the idea that it consists of a binary system in a nova, where the viewing aspect at different orbital phases of the system comprised by a compact source, an accretion disc around it, and a donor star would produce the observed periodic variations. The observed 4.26 hour period can be interpreted as the orbital period of the binary system. The short period is again consistent with a CV classification for this source. Otherwise, the long-term photometric period of 11.7 days, although not well understood, is not exceptional in these systems (Yang et al., 2017) and may be caused by the precession of the accretion disc (de Miguel et al., 2016).
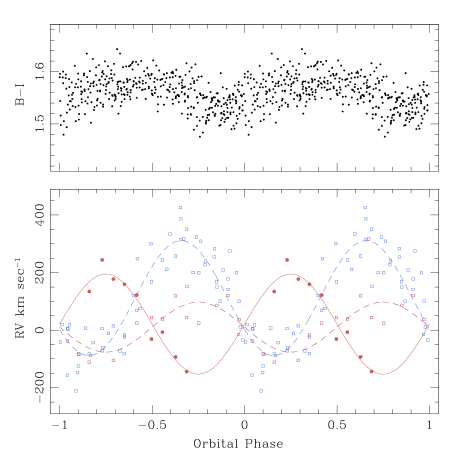
In the absence of eclipses, it is difficult to associate the different emission and absorption line components with the system constituents, but the varying amplitudes and phasing of these spectral line components, as seen in the bottom panel of Figure 11, can provide important clues about this system. The similarities of the central star of J210204 to other NLs (Hernández et al., 2017) makes us assume that the narrow faint H emission component (red solid line and dots in Figure 11-bottom) originates at the irradiated face of the donor star. The RV curve of this component thus reflects the motion of the secondary star. Consequently, we will assign the zero phase to the time T0=2457610.5154 at which this RV curve crosses the systematic velocity line. When the RV plots are referred to this zero point and folded with the 4.26 hours spectroscopic period (Figure 11-bottom), the emission of the faint H component apparently fades away and disappears between phases –0.3 to 0.2. This can be taken as a good evidence that this H emission component arises only from the side of the donor star facing the accretion disc that would be not visible to the observer in this phase interval. The sinusoidal fit to the H measurements indicates a RV semi-amplitude of 175 km s-1. The secondary star velocity implies a high orbital inclination angle, although not high enough to produce eclipses in this system.
Meanwhile, the broad H absorption probably originates in the optically thick accretion disc. This optically thick accretion disc would outshine the stellar components of the binary system, so that no signature of the narrow absorption lines from the secondary star is visible. If the H absorption line formed evenly in the entire accretion disc, then it would be expected its RV curve to be in phase with that of the narrow faint H emission component originating from the secondary star, as in the case of RW Sex (see Figure 6 in Beuermann et al., 1992). However, the orbital phasing of the H absorption (blue open squares and blue dash-line in Figure 11-bottom) is not exactly in counter-phase with the narrow faint H emission component (red solid line and dots in Figure 11-bottom). The maximum positive velocity of the H RV curve at and its large amplitude indicate that the line emanates predominately from the co-rotating hot spot. At that orbital phase, the intrinsic velocity of the matter in the hot spot would be increased by the orbital velocity. This is not a novelty, as the asymmetry of the accretion discs of UX UMa systems has been noted before (e.g. Schlegel, Honeycutt, & Kaitchuck, 1983; Neustroev et al., 2011).
Finally, the bright H emission component (red open squares and dash-line in the bottom panel of Fig. 11) can be attributed to an extended and low-velocity region located off the edge of the accretion disc and opposite to the hot spot, as for 1RXS J064434.5+334451 (Hernández et al., 2017). This interpretation is consistent with the observed photometric variations of the system, as shown in the upper panel of Figure 11, where the color curve folded with spectroscopy ephemeris is plotted. The maximum color difference is achieved at , just prior to the inferior conjunction of the presumed late type donor star. The amplitude of the photometric variations grows towards longer wavelengths, reaching 0.04-–0.06 magnitude in the -band (Figure 9). The light curves in red filters are not symmetric, but the color curve is, thus suggesting that color stays more or less constant with some blue light being obscured around . This might be evidence of the dark spot detected in the archetype UX UMa itself (see Figure 9 in Neustroev et al., 2011), but our spectrosopic data is not sufficient to conduct a similar tomographic analysis and confirm the evidence of such dark spot in the central star of J210204.
4.2 The nebula IPHASX J210204.7+471015
The shell around this binary system bears a striking resemblance to the nova AT Cnc, particularly in the low-ionization [N ii] emission line. The cometary morphology of many of the [N ii] knots and the [O iii] bow-shock are highly indicative of a recent outburst event which is seen as a bow-shock progressing through the ISM. Shock-sensitive line ratios are indeed suggestive of shocks (Hartigan, Raymond, & Hartmann, 1987). A detailed spatio-kinematical study of the different nebular components is underway (Santamaría et al., in preparation).
Novae are expected to produce noticeable amounts of CNO, as well as Ne, Mg, Al, and Si (e.g., José & Hernanz, 1998), a theoretical expectation confirmed by spectroscopic observations of classical nova shells (Gehrz et al., 2014; Tarasova, 2016). The chemical abundances of the different regions of J210204 cannot be derived in detail, but the [N ii]/[O ii] line ratios, in the asssumption of complete shocks, imply a significant gradient in the abundances from the ring to the inter-region. The high N/O ratio of the ring, well above unity as typically found in novae (Nussbaumer et al., 1988), reveals pristine nova ejecta, whereas the inter-region displays chemical abundances closer to those of the ISM, as the nova ejecta expand and sweep up ISM material. Individual knots may show evidence of larger chemical enrichment and notably varying N/O ratios, suggesting that material highly enriched ejected during the outburst has not yet mixed completely. The assumption on the shock completeness does not hold at the bow-shock, where abundances are uncertain, although they might be consistent with those of the ISM.
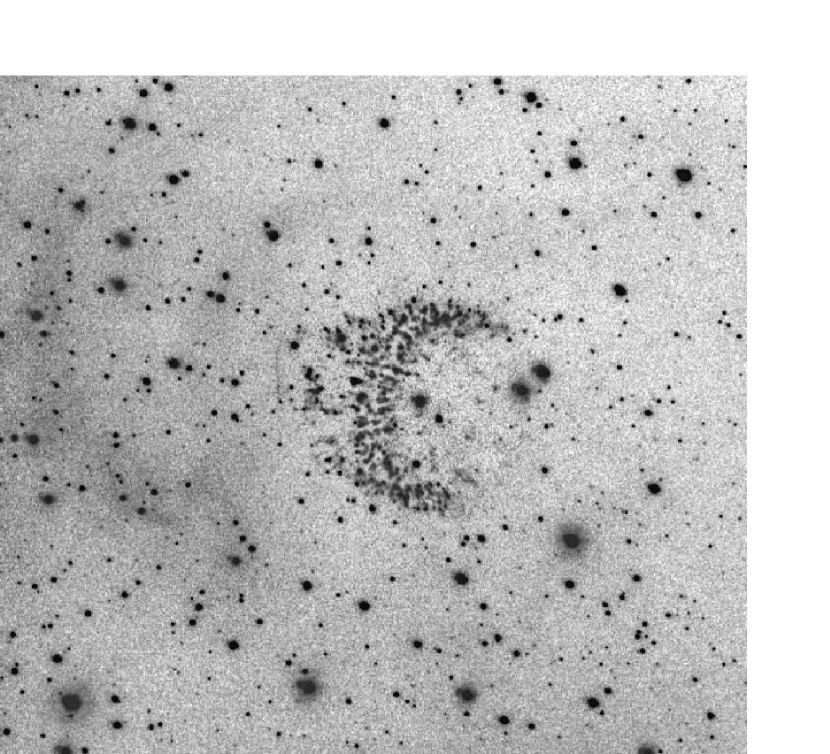
The bow-shock is preceded by two additional arcs. These diffuse arcs of emission seem to trace the interaction of the ejecta of J210204 with the ISM, although they may also be the relics of previous events of mass ejection. In order to investigate recurrent interactions of mass loss processes from J210224 with the ISM, we have searched for large-scale diffuse emission features around J210204 in IPHAS mosaic images (Figure 12). These do not reveal any additional detached rings or arcs, but there is a quasi semi circular depression in the interstellar material towards the north-east of J210204, moreless along the bow-shock direction (Figure 12). Although the presence of this structure is tantalizing, we note that the stars density inside this arc is notably smaller than on the arc, indicating that the origin of this arc can be associated most likely with varying interstellar absorption rather than with recurrent episodes of mass ejection and their interaction with the ISM.

5 Conclusions
From the analysis of the time-resolved photometric and spectroscopic data of the central source of IPHASX J210204.7+471015, it can be concluded that it hosts a binary system. The object can be classified as an old nova observed around a UX UMa system, i.e. a classical nova observed around a non-magnetic CV system observed at quiescence. The nebula shows evidences of nitrogen and oxygen enrichment, which is later diluted into the surrounding ISM by a fast ejecta resulting in a typical bow-shock structure. These are typical characteristics of a nova shell. Actually, the remnants of past ejections around CVs are scarcely detected (Ringwald et al., 1996; Gill & O’Brien, 2000; Tomov et al., 2015; Schmidtobreick et al., 2015). A re-classification as a recurrent nova might be possible if the arc-like features 15 and 20 in front of the [O iii] bow-shock could be attributed to previous episodes of mass ejection from the nova.
References
- Asplund et al. (2009) Asplund, M., Grevesse, N., Sauval, A. J., & Scott, P. 2009, ARA&A, 47, 481
- Barentsen et al. (2011) Barentsen G., et al., 2011, MNRAS, 415, 103
- Barentsen et al. (2014) Barentsen, G., Farnhill, H. J., Drew, J. E., et al. 2014, MNRAS, 444, 3230
- Beuermann et al. (1992) Beuermann, K., Stasiewski, U., & Schwope, A. D. 1992, A&A, 256, 433
- Cannizzo (1993) Cannizzo J. K., 1993, adcs.book, 6
- Corradi et al. (2010) Corradi R. L. M., et al., 2010, A&A, 509, A41
- de Miguel et al. (2016) de Miguel E., et al., 2016, MNRAS, 457, 1447
- Dhillon (1996) Dhillon V. S., 1996, ASSL, 208, 3
- Drew et al. (2005) Drew J. E., et al., 2005, MNRAS, 362, 753
- Drew et al. (2014) Drew J. E., et al., 2014, MNRAS, 440, 2036
- Froebrich et al. (2011) Froebrich D., et al., 2011, MNRAS, 413, 480
- Froebrich et al. (2015) Froebrich D., et al., 2015, MNRAS, 454, 2586
- Gaustad et al. (2001) Gaustad J. E., McCullough P. R., Rosing W., Van Buren D., 2001, PASP, 113, 1326
- Gill & O’Brien (2000) Gill, C. D., & O’Brien, T. J. 2000, MNRAS, 314, 175
- Gehrz et al. (2014) Gehrz, R. D., Evans, A., & Woodward, C. E. 2014, Stellar Novae: Past and Future Decades, 490, 227
- Gvaramadze et al. (2010) Gvaramadze V. V., Kniazev A. Y., Hamann W.-R., Berdnikov L. N., Fabrika S., Valeev A. F., 2010, MNRAS, 403, 760
- Hartigan, Raymond, & Hartmann (1987) Hartigan P., Raymond J., Hartmann L., 1987, ApJ, 316, 323
- Hernández et al. (2017) Hernández M. S., Zharikov S., Neustroev V., Tovmassian G., 2017, arXiv, arXiv:1706.06236
- José & Hernanz (1998) José, J., & Hernanz, M. 1998, ApJ, 494, 680
- Kalari et al. (2015) Kalari V. M., et al., 2015, MNRAS, 453, 1026
- Lenz & Breger (2005) Lenz, P., & Breger, M. 2005, Communications in Asteroseismology, 146, 53
- Linnell et al. (2010) Linnell, A. P., Godon, P., Hubeny, I., Sion, E. M., & Szkody, P. 2010, ApJ, 719, 271
- Meyer & Meyer-Hofmeister (1982) Meyer F., Meyer-Hofmeister E., 1982, A&A, 106, 34
- Mineshige & Osaki (1985) Mineshige S., Osaki Y., 1985, PASJ, 37, 1
- Mohr-Smith et al. (2015) Mohr-Smith M., et al., 2015, MNRAS, 450, 3855
- Neustroev et al. (2011) Neustroev V. V., Suleimanov V. F., Borisov N. V., Belyakov K. V., Shearer A., 2011, MNRAS, 410, 963
- Nussbaumer et al. (1988) Nussbaumer, H., Schmid, H. M., Vogel, M., & Schild, H. 1988, A&A, 198, 179
- Parker et al. (2005) Parker Q. A., et al., 2005, MNRAS, 362, 689
- Parker et al. (2006) Parker Q. A., et al., 2006, MNRAS, 373, 79
- Parker, Bojičić, & Frew (2016) Parker Q. A., Bojičić I. S., Frew D. J., 2016, JPhCS, 728, 032008
- Pretorius & Knigge (2008) Pretorius M. L., Knigge C., 2008, MNRAS, 385, 1485
- Raddi et al. (2013) Raddi R., et al., 2013, MNRAS, 430, 2169
- Ringwald et al. (1996) Ringwald, F. A., Naylor, T., & Mukai, K. 1996, MNRAS, 281, 192
- Roberts et al. (1987) Roberts, D. H., Lehar, J., & Dreher, J. W. 1987, AJ, 93, 968
- Sabin et al. (2013) Sabin L., et al., 2013, MNRAS, 431, 279
- Sabin et al. (2014) Sabin L., et al., 2014, MNRAS, 443, 3388
- Sahman et al. (2015) Sahman D. I., Dhillon V. S., Knigge C., Marsh T. R., 2015, MNRAS, 451, 2863
- Schlegel, Honeycutt, & Kaitchuck (1983) Schlegel E. M., Honeycutt R. K., Kaitchuck R. H., 1983, ApJS, 53, 397
- Schmidtobreick et al. (2015) Schmidtobreick, L., Shara, M., Tappert, C., Bayo, A., & Ederoclite, A. 2015, MNRAS, 449, 2215
- Shara et al. (2012) Shara M. M., Mizusawa T., Wehinger P., Zurek D., Martin C. D., Neill J. D., Forster K., Seibert M., 2012, ApJ, 758, 121
- Stock & Barlow (2010) Stock D. J., Barlow M. J., 2010, MNRAS, 409, 1429
- Sutherland & Dopita (2017) Sutherland, R. S., & Dopita, M. A. 2017, ApJS, 229, 34
- Tarasova (2016) Tarasova, T. N. 2016, Astronomy Reports, 60, 1052
- Tarasova (2014) Tarasova T. N., 2014, Astronomy Reports, 58, 302
- Tovmassian et al. (2014) Tovmassian G., Stephania Hernandez M., González-Buitrago D., Zharikov S., García-Díaz M. T., 2014, AJ, 147, 68
- Tomov et al. (2015) Tomov, T., Swierczynski, E., Mikolajewski, M., & Ilkiewicz, K. 2015, A&A, 576, A119
- Viironen et al. (2009) Viironen K., et al., 2009, A&A, 504, 291
- Warner (1995) Warner B., 1995, CAS, 28,
- Wesson et al. (2008) Wesson, R., Barlow, M. J., Corradi, R. L. M., et al. 2008, ApJ, 688, L21
- Witham et al. (2008) Witham A. R., Knigge C., Drew J. E., Greimel R., Steeghs D., Gänsicke B. T., Groot P. J., Mampaso A., 2008, MNRAS, 384, 1277
- Wright et al. (2014) Wright, N. J., Wesson, R., Drew, J. E., et al. 2014, MNRAS, 437, L1
- Yang et al. (2017) Yang M. T.-C., et al., 2017, arXiv, arXiv:1706.06731