∎
e1e-mail: anff@ihep.ac.cn \thankstexte2e-mail: manqi.ruan@ihep.ac.cn
Performance study of particle identification at the CEPC using TPC information
Abstract
The kaon identification is crucial for the flavor physics, and also benefits the flavor and charge reconstruction of the jets. We explore the particle identification capability for tracks with momenta ranging from 2-20 GeV/c using the measurements in the Time Projection Chamber at the future Circular Electron-Positron Collider. Based on Monte Carlo simulation, we anticipate that an average () separation can be achieved based on information for an optimistic (conservative) extrapolation of the simulated performance to the final system. Time-of-flight (TOF) information from the Electromagnetic Calorimeter can provide separation around 1 GeV/c and reduce the mis-identification rate. By combining the and TOF information, we estimate that in the optimistic scenario a kaon selection in inclusive hadronic decays with both the average efficiency and purity approaching 95% can be achieved.
1 Introduction
The project of building a Circular Electron-Positron Collider (CEPC) cepc_precdr in China has been proposed. The CEPC will operate as a Higgs boson factory or a boson factory at center-of-mass energies of 240 or 91 GeV, respectively. During the lifetime of the CEPC, one million Higgs bosons are expected to be produced, allowing precision measurements of the Higgs boson properties manqi . In addition, ten billion bosons will be delivered at the pole promising refined measurements of electroweak and heavy flavor physics ew_physics .
A Time Projection Chamber (TPC) has been proposed as a candidate charged particle tracking device for the CEPC detector. TPCs have been operated successfully in and hadron collider experiments and even in fixed-target experiments, such as the ALEPH aleph1 and ALICE alice1 experiments at CERN, the HISS experiment at BEVALEC hiss , etc. A TPC provides precise momentum and position measurements, a low material budget, and good particle identification (PID) over a wide range of momentum. The PID information is based on measurements in the TPC, where is defined as the energy deposit per unit path length. There are several ongoing R&D efforts about the TPC proposal, such as exploring novel technologies of the GEM-Micromegas zhangyl or GEM gem_ilc readout detectors, the voxel occupancy in the TPC in decays at the pole zhaom , etc. Compared to previous TPCs, we expect an improved performance of the proposed TPC at the CEPC detector as a result of the increased number of readout channels and recent developments in readout electronics.
In this paper, the performance of the CEPC TPC is investigated based on Monte Carlo (MC) simulation. PID will play an important role in measurements of the bottom () and charm () hadron decays in heavy flavor physics. It can also be exploited to enhance the flavor tagging of the -jets in Higgs and precision electroweak measurements. We study the PID of kaons, pions and protons in hadronic decays at the pole, demonstrating that an effective kaon selection can be achieved by combining the measurements of the TPC with the time-of-flight (TOF) information provided by the Electromagnetic Calorimeter (ECAL) at the CEPC detector.
The paper is organized as follows. In section 2 we present the configuration of the CEPC TPC and the energy loss measurement of traversing charged particles. Section 3 describes the key factors influencing the resolution of the measurement and provides an estimate of the PID performance at the CEPC. In section 4 a brief conclusion is given.
2 Energy deposit in TPC
The TPC concept was introduced in Ref. 1tpc . A TPC consists essentially of a wireless drift volume situated between parallel axial electric and magnetic fields, where the electric field is set up between a central cathode plate and the end plates. When a charged particle traverses the gas-filled drift volume, it generates electron-ion pairs by collisions with the gas molecules. The electrons drift towards the end plates, where the charges are amplified and collected.
The default design of the TPC at the CEPC detector can be found in Ref. cepc_precdr . It is a cylindrical detector that is 4.7 m long with an inner and outer radii of 0.325 m and 1.8 m, respectively. The candidate gas is an argon-based gas composite (93% Ar+5% CH4+2% CO2) held at atmospheric pressure and room temperature. A solenoid provides a magnetic field of 3 T along the beam direction. In the endcaps, Micromegas micromegas detector modules with pad size of 6 mm along the radial direction (height) and 1 mm along the azimuthal direction (width) are arranged in 222 concentrical rings.
In the MC simulation, the description of the detector geometry, material and the ionization process are implemented using GEANT4 geant4 . Single-particle events are generated using ParticleGun. Collision events of the Standard Model processes are produced with the event generator WHIZARD whizard . The measurement by each pad is defined as the energy deposit divided by the track length in the corresponding drift volume, both of which are provided by GEANT4. Typically, the measurements of a track follow a Landau distribution with a large tail caused by high-energy -electrons. We estimate a representative average for a track, denoted as , by using the common “truncated mean” method truncate . We calculate as the mean of the lowest 90% of the values associated with the track, where the truncation ratio of 90% is determined to yield the optimal resolution. The distribution of the truncated mean can be well described by a Gaussian function with a width denoted as . Unless explicitly stated, the resolution in the paper refers to the ratio .
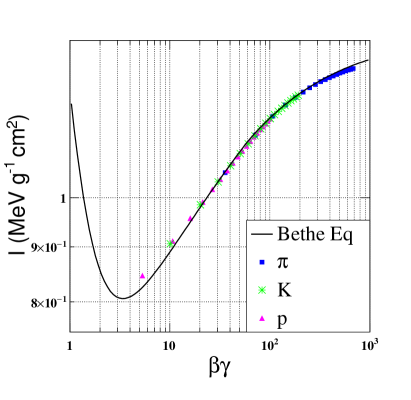
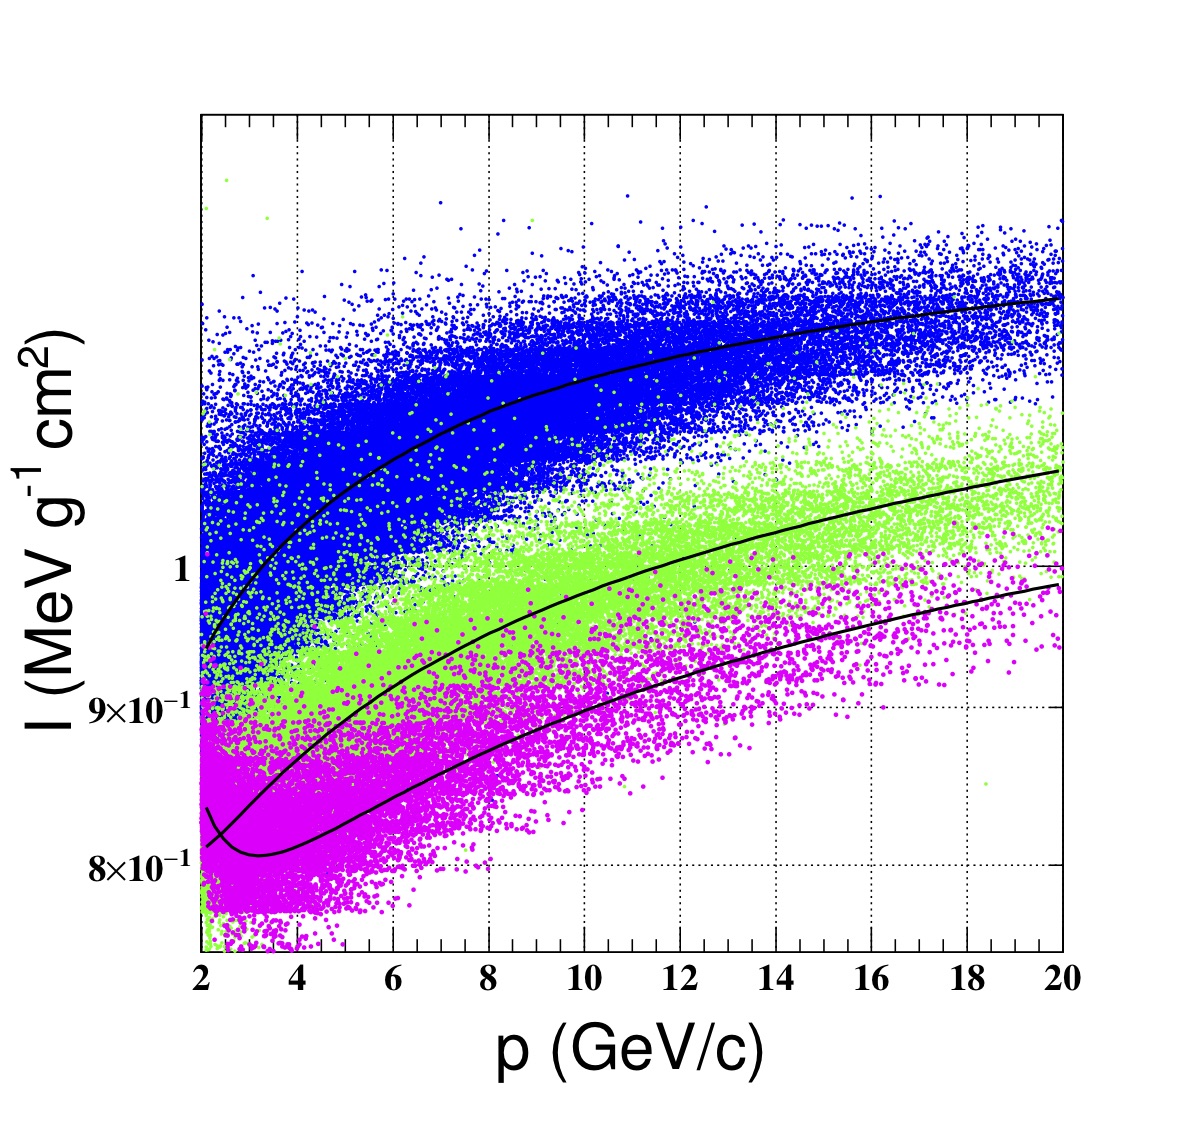
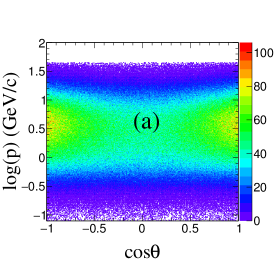
For a particle with momentum and mass , the MC simulation of the dependence of as a function of is shown in the left plot of Fig. 1. Herein we use single-particle events requiring so that the tracks traverse the full TPC radius, where is defined as the polar angle of the tracks with respect to the beam direction. The simulated dependence agrees well with the theoretical prediction by the Bethe equation pdg . The values of all the parameters in the Bethe equation are taken from Ref. R.M. Sternheimer:1984 except for the normalization scale factor and the maximum energy transfer , which is free in the fit to the distribution following the procedure in Ref. Va'Vra:1999 . In the right plot of Fig. 1, the scatter plot of versus is presented using a simulated sample of events. At the CEPC, the majority of the particles traversing the TPC have a momentum above 1 GeV/c and reside in the relativistic rise region, where TOF measurements can not effectively distinguish between the different particles types. Therefore, improving the resolution will directly benefit the PID performance.
3 Resolution of energy deposit in TPC
In an ideal case, the resolution for a given track depends on the number of the measurements along the particle trajectory and the number of the ionizing electrons per measurement. We name the induced resolution from these factors “intrinsic resolution”. The resolution in real experiments, named as “actual resolution”, will be deteriorated by the detector effects arising in the processes of electron drift, signal amplification and readout in TPC. A detailed study of those effects is beyond the scope of the paper. In this paper, we study the intrinsic resolution of the CEPC TPC using MC simulation, and estimate the degradation of the actual resolution by comparing the MC-based results with the experimental measurements of previous TPCs.
3.1 Parameterization of the intrinsic resolution
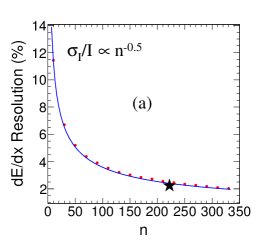
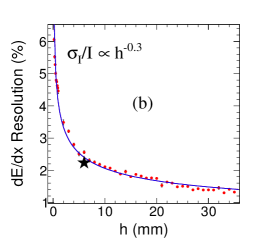
The intrinsic resolution arises from fluctuations at the primary ionization stage. It depends on the number of the pad rings , the pad height along the radial direction , the density of the working gas , the relativistic velocity and the polar angle of the particle trajectory. The resolution dependence on these variables is studied using single-particle MC events. We scan each variable to obtain its relationship with the intrinsic resolution. Except for the variable under consideration, all others are kept constant at their default values given in Sec. 2, i.e., , mm, 1.73 mg/cm3 and for pions with a momentum of 20 GeV/c. The MC results are shown in Fig. 2.
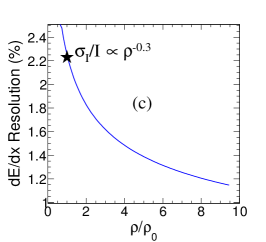
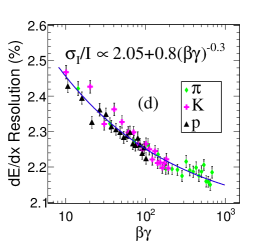
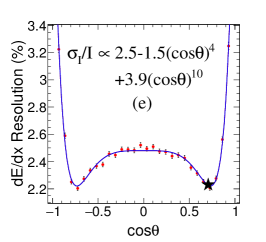
The correlations between the variables are small. To a good approximation, the parameterization of can be factorized as
| (1) |
where and are in of mm and mg/cm3, respectively. To check the correlation between the variables, we validate the factorization in the five-dimensional space by varying the variables within the ranges shown in Fig. 2. In addition, the influence of the magnetic field is found to be negligible on the resolution. When the magnetic field is set to zero, the induced relative change of is within 3% for particles with momenta larger than 1 GeV/c.
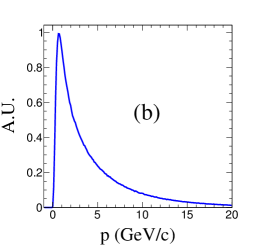
As Eq. (1) is derived from single-particle events, its applicability to physics events is validated using kaons from MC events. The kinematic distributions are shown in Fig. 3. We integrate Eq. (1) over the distribution given in Fig. 3 and calculate the average resolution versus . It is found to be consistent with the one directly obtained from MC. For example, for kaons with a momentum of 5 GeV/c in hadronic decays at the pole, the intrinsic resolution is 3.1%.
3.2 Expected actual resolution of the CEPC TPC
In real experiments, both detector effects and imperfect calibration can deteriorate the resolution. We estimate the potential degradation in previous TPCs by comparing their experimental achievements with the corresponding intrinsic resolutions obtained from MC simulation.
The TPCs considered in this study are summarized in Table 1. The information about the experiments, unless explicitly stated, is taken from the references listed in the first row. All the factors influencing the intrinsic resolution are implemented in MC simulation, including the composition of the working gas, the geometry of the TPC, the control samples and the truncation ratio used to remove the Landau tail. In the MC study, we resort to single-particle events and make them have identical particle type and kinematic distributions with the corresponding control samples used in the experiments. For the case where minimum ionizing pions are used, we assume a flat distribution in the simulation when their spectrum is not provided in the references. The relative uncertainty arising from such an approximation is estimated to be within a few percent and can be neglected.
[htb] Experiment PEP-4 TOPAZ DELPHI ALEPH STAR ALICE CEPC pep1 ; pep2 ; pep3 topaz delphi1 ; delphi2 aleph1 ; aleph2 star1 ; star2 alice1 ; alice2 Start of data taking 1982 1987 1989 1989 2000 2009 — Colliding Particles e-/e+ e-/e+ e-/e+ e-/e+ Au/Au p/p e-/e+ (GeV) 14.5 26 45.6 45.6 100 1380 125 Ar: 0.8 Ar: 0.9 Ar: 0.8 Ar: 0.91 Ar: 0.9 Ne: 0.857 Ar: 0.93 Gas CH4: 0.2 CH4: 0.1 CH4: 0.2 CH4: 0.09 CH4: 0.1 CO2: 0.095 CH4: 0.05 N2: 0.048 CO2: 0.02 Pressure (atm) 8.5 3.5 1 1 1 1 1 (mg/ml) 12.43 5.47 1.46 1.57 1.56 0.95 1.73 183 175 192 344 13, 32 3 63,64,32 3 222 (mm) 4 4 4 4 12, 20 3 7.5,10,15 3 6 Length (mm) 2000 3000 2680 4400 4200 5000 4700 Control Sample (GeV/c) 14.5 0.4-0.6 0.4-0.6 45.6 0.4-0.6 6.0 5.0 Truncation range 0-65% 0-65% 8-80% 8-60% 0-70% 0-60% 0-90% 0.7 1 0.6 2 338 44 149 2.6% 3.8% 5.4% 3.0% 5.3% 3.3% 3.1% 3.5% 4.6% 6.2% 4.4% 6.8% 4 5.0% — 0.35 0.21 0.15 0.47 0.28 0.52 —
-
1
It’s required that at least 78 hits are used for the calculation topaz . Here we assume there are 70% effective hits.
-
2
65% tracks have more than 40 isolated hits, and 35% more than 100 delphi1 . We assume there are 60% effective hits.
-
3
In the STAR and ALICE detectors, the inner, intermediate and outer subdetectors have different pad sizes.
-
4
See Fig. 21 in Ref. star2 .
Besides the factors discussed above, the number of the effective hits used for the calculation, denoted as , is also considered because it greatly influences the resolution in the earlier experiments. In TOPAZ and DELPHI, for example, on average only 60-70% effective TPC hits are available for tracks in jets due to the large size of their TPC readouts and resulting in serious hit overlap. STAR and ALICE have made significant progress in exploiting high-granularity readouts to handle their dense tracking environment. In ALICE, the fraction of is about 93% or even larger in proton-proton collisions alice2 . Compared to ALICE, the CEPC TPC will have a higher granularity and endure much smaller track multiplicities. Therefore we neglect this effect at the CEPC. Even if assuming that 5% of the hits are discarded, the resulting relative change in the resolution is within 3% according to Eq. (1).
In the last row of Table 1, the relative difference between the intrinsic and actual resolutions are listed. It varies from 0.15 to 0.50 between the different experiments. Studies performed by the ALICE TPC Collaboration alice3 ; alice4 show that the main detector effects causing the deterioration include diffusion in the drift volume, fluctuations in the amplification and DAQ processes, and cross talk between the readout pads. Based on MC simulation, we estimate that these effects will cause a degradation of at least 20% at the CEPC TPC. Therefore, we define two scenarios for further discussion about the performance that might eventually be achieved by the CEPC, namely an “optimistic scenario” and a “conservative scenario”, corresponding to degradations of 20% and 50%, respectively, with respect to the intrinsic resolution.
3.3 Expected PID performance of the CEPC TPC
A common figure of merit for the PID performance is the separation power . Between particle types and we define
| (2) |
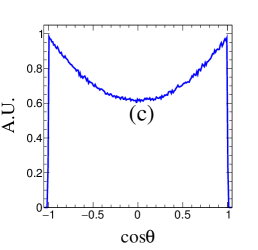
where () and () are the average measurement of particle type A (B) and the corresponding resolution. In the ideal case assuming no degradation and follows Eq. (1), we estimate at the CEPC as a function of and (see Fig. 4).
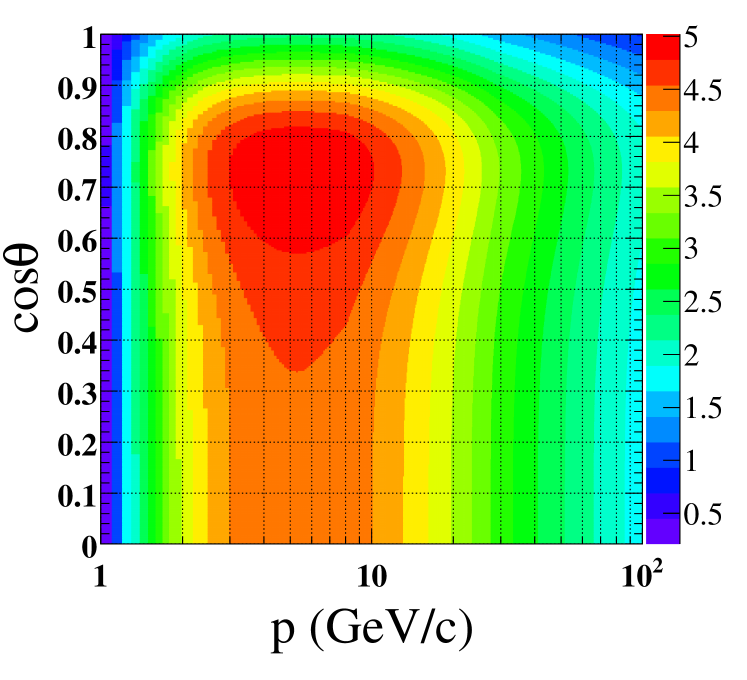
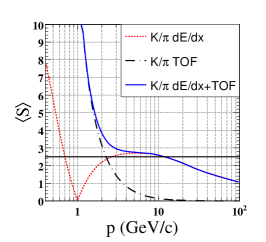
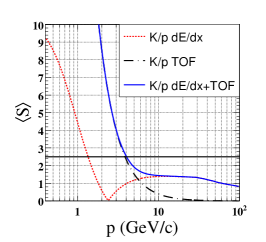
One often cares about the average separation power versus momentum after integrating over the dimension. Given the distribution in decays (see Fig. 3), the plots of and as a function of are shown in Fig. 5. In the left plot, the separation powers using for different TPC performance scenarios are illustrated. One can see that alone is incapable of separation around 1 GeV/c and yields poor separation beyond 1.5 GeV/c. To overcome this disadvantage, the exploitation of TOF information is considered.
According to a recent study on the CMS high-granularity calorimeter cms_ecal , precise TOF information could be provided by the CEPC ECAL with a precision of tens of picoseconds. Supposing TOF information with a 50 ps time resolution, and given the measurements in the conservative scenario, the average and separation powers are calculated using both and TOF. They are shown in the middle and right plots of Fig. 5. Accounting for the time resolution and the location of the ECAL, the TOF information can provide () separation better than 2.5 up to 2.1 (4.0) GeV/c. By combining TOF and , more than 2.0 (1.4) () separation can be achieved up to 20 GeV/c.
The PID performance depends on the kinematic distributions and relative abundance of the charged particles in the sample under study. As an example, we take the process (see Fig. 3) with an average of 20 charged particles per event, of which 85% are pions, 10% are kaons, and 4% are protons. We calculate the average separation powers and for particles with momenta in the range from 2-20 GeV/c. They are listed in Table 2. Particles with momenta smaller than 2 GeV/c are not considered since they can be clearly separated.
Due to the importance of the kaon selection performance for flavor physics, we also provide an estimation of the kaon selection efficiency and the corresponding purity , together with the probability of mis-identifying pions (protons) as kaons . They are defined as
| (3) |
where , , are the total numbers of generated kaons, pions and protons that traverse the innermost pad ring of the TPC, is the number of correctly identified kaons, and is the number of pions (protons) mistakenly identified as kaons.
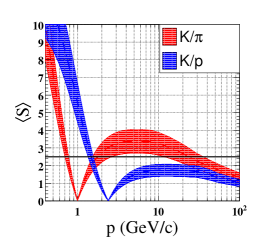
The kaon selection is performed based on the variable , where and are the experimental measurement (either by alone or by combining and TOF) and the expected value for the kaon hypothesis respectively, and denotes the experimental resolution. Their spectra should be close to Gaussian distributions with a width of 1. In Fig. 6 we illustrate the scaled spectra of kaons, pions and protons with a momentum of 5 GeV/c using alone assuming a 20% degradation. According to Eq. (2), the peaks between the kaon and pion (proton) spectra should be ( ) apart, where ( ) is the corresponding separation power. The relative populations and vary versus momentum and are determined based on MC simulation. We choose the intersections of the spectra as the cut points (marked by the arrows in the plot), in order to calculate the kaon identification efficiency and purity together with the mis-identification rates according to Eq. (3). We calculate these parameters at each momentum point from 2-20 GeV/c in events (see Fig. 3) and provide in Table 2 the average values. The MC sample under study is large enough ( million) and the statistical errors are negligibly less 0.1%.
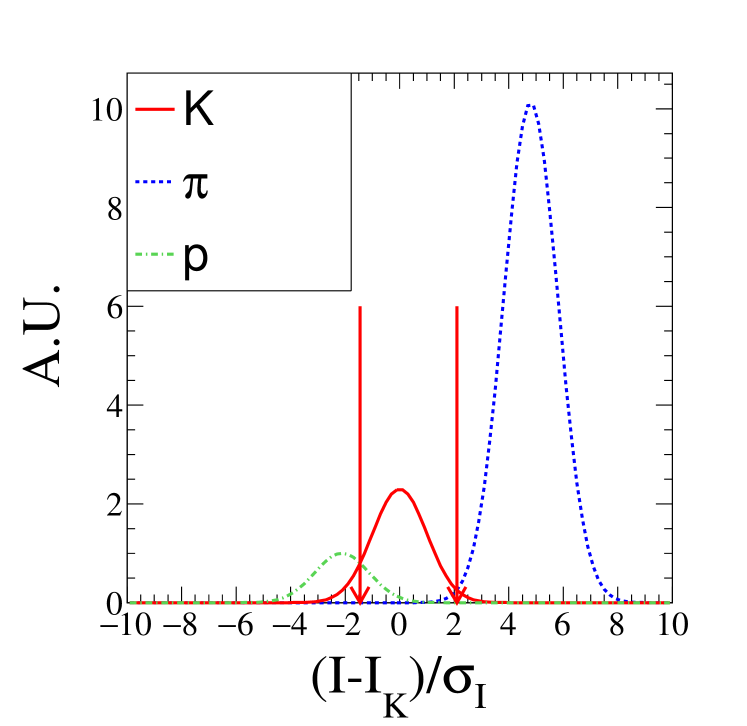
The intersections marked by the arrows are chosen as the cut points.
| Deterioration | 0 | 0.5 | 0.2 | |
|---|---|---|---|---|
| 3.9 | 2.6 | 3.2 | ||
| 1.5 | 1.0 | 1.2 | ||
| (%) | 93.2 | 84.5 | 90.9 | |
| (%) | 86.5 | 76.1 | 82.4 | |
| (%) | 0.1 | 1.3 | 0.5 | |
| (%) | 33.0 | 47.2 | 40.1 | |
| 4.0 | 2.8 | 3.4 | ||
| 3.2 | 2.8 | 3.0 | ||
| & | (%) | 96.8 | 90.4 | 95.0 |
| TOF | (%) | 97.0 | 90.1 | 94.5 |
| (%) | 0.1 | 1.1 | 0.4 | |
| (%) | 6.4 | 13.8. | 9.6 |
In the ideal simulation, the measurements ultimately provide roughly 4 (1.5 ) separation between kaon and pion (proton) in inclusive decays. The overall kaon identification efficiency reaches 93.2% with a purity of 86.5%. The PID performance is limited by the proton contamination. By combining the and TOF measurements, the separation is greatly enhanced from 1.5 to 3.2 . As a consequence, the kaon identification efficiency is improved to 96.8% with a corresponding purity of 97.0%
In the conservative scenario, the kaon identification efficiency and purity degrade significantly mainly due to the more serious proton contamination. In this case, the TOF measurement plays a crucial role and can ameliorate the performance back to an efficiency of 90.4% and a purity of 90.1%. If the optimistic scenario can be realized at the CEPC, by combining and TOF, we expect the efficiency reaches 95.0% for kaon identification with a purity of 94.5%, which is only slightly degraded from the ideal simulation. In all scenarios, the pion mis-identification rate can be controlled at a 1% level.
4 Conclusion
Effective particle identification will enrich the CEPC physics program, especially when operating at the pole. Using a GEANT4-based MC simulation, we study the PID performance at the CEPC based on the measurements in the TPC and the TOF information provided by the ECAL with an assumption of 50 ps time resolution.
We explore the kaon identification performance in the momentum range from 2-20 GeV/c in inclusive hadronic decays, showing that an effective kaon identification can be achieved with the combined information of and TOF. If the degradation of the measurements due to detector effects can be controlled to less than 20%, both the average kaon identification efficiency and purity can approach 95%. More detailed microscopic simulation and beam tests are expected to validate these conclusions in the future.
Acknowledgements.
We express our great appreciation to the technical staff in our institutions for their discussion. In particular, we would like to thank Prof. Peter Christiansen of Lund University for his very helpful suggestions. This work was supported by National Key Program for S&T Research and Development under Contract Number 2016YFA0400400; the Hundred Talent programs of Chinese Academy of Science under Contract Number Y3515540U1; National Natural Science Foundation of China under Contract Number 11675202; IHEP Innovation Grant under Contract Number Y4545170Y2; Chinese Academy of Science Focused Science Grant under Contract Number QYZDY-SSW-SLH002; Chinese Academy of Science Special Grant for Large Scientific Project under Contract Number 113111KYSB20170005; National 1000 Talents Program of China.References
- (1) M. Ahmad et al., CEPC-SPPC Pre-CDR, Chap. 6 (2015) 163.
- (2) M. Ruan, Nucl. Part. Phys. Proc. 273 (2016) 857.
- (3) J. Fan et al., JHEP09 (2015) 196.
- (4) W. B. Atwood et al., Nucl. Instrum. and Meth. A306 (1991) 446-458.
- (5) J. Alme et al., Nucl. Instrum. and Meth. A622 (2010) 316-367.
- (6) G. Rai et al., LBL-27620 (1989).
- (7) Y. Zhang et al., Chinese Physics C Vol. 38, No. 4 (2014) 046001.
- (8) D. Attie et al., Nucl. Instrum. and Meth. A856 (2017) 109.
- (9) M. Zhao et al., arXiv:1704.04401 [hep-ex].
- (10) (a) D. Nygren, PEP-198-1975; (b) 1976 Proposal for a PEP Facility based on the TPC, PEP4-December 30.
- (11) Y. Giomataris et al., Nucl. Instrum. and Meth. A 376 (1996) 29.
- (12) S. Agostinelli et al. (GEANT4 Collaboration), Nucl. Instrum. and Meth. Phys. Res., Sect. A 506, 250 (2003).
- (13) W. Kilian, T. Ohl, and J. Reuter, Eur. Phys. J. C71 (2011) 1742.
- (14) D. Jeanne et al., Nucl. Instrum. and Meth. 111 (1973) 287.
- (15) C. Patrignani et al. (Particle Data Group), Chin. Phys. C, 40, 100001 (2016) 442.
- (16) R.M. Sternheimer, M.J. Berger, S.M. Seltzer, At. Data Nucl. Data Tables 30 (1984) 261.
- (17) J. Va’Vra, Nucl. Instrum. and Meth. A453 (2000) 262.
- (18) R.J. Madaras et al., LBL-17806, C84-03-04 Proceeding, 413-444.
- (19) G.R. Lynch, N.J. Hadley, 1982 Proceedings of the International Conference on Instrumentation for Colliding Beam Physics.
- (20) A. Barbaro-Galtieri, 1982 Proceedings of the International Conference on Instrumentation for Colliding Beam Physics.
- (21) T. Kamae et al., Nucl. Instrum. and Meth. A252 (1986) 423-430; A. Shirahashi et al., IEEE 35 (1988) 414.
- (22) Y. Sacquin, Nucl. Instrum. and Meth. A323 (1992) 209-212.
- (23) P. Abreu et al., Nucl. Instrum. and Meth. A378 (1996) 57-100; C. Brand et al., IEEE 36 (1) (1989) 122.
- (24) D. Buskulic et al., Nucl. Instrum. and Meth. A360 (1995) 481-506.
- (25) M. Anderson et al., Nucl. Instrum. and Meth. A499 (2003) 659-678.
- (26) H. Bichsel, Nucl. Instrum. Meth. A562 (2006) 154-197.
- (27) J. Adam et al., Phys. Rev. C 93, 034913 (2016).
- (28) D. Antonczyk et al. (ALICE TPC Collaboration), Nucl. Instr. and Meth. A 565 (2006) 551.
- (29) P. Christiansen et al. (ALICE TPC Collaboration), Nucl. Instr. and Meth. A 609 (2009) 149.
- (30) D. del Re, J. Phys. Conf. Ser. 587 (2015) 012003.