Metal-Poor Type II Cepheids with Periods Less Than Three Days
Abstract
We have analysed 10 high resolution spectra of Type II Cepheids with periods less than 3 days. We find that they clearly separate into two groups: those with near or slightly below solar metallicities, and those with [Fe/H] between –1.5 and –2.0. While the former are usually called BL Her stars, we suggest that the latter be called UY Eri stars. The UY Eri subclass appears to be similar to the short period variables in globular clusters of the Galactic Halo. Globular clusters with [Fe/H] –1.0 almost never have Type II Cepheids.
Subject headings:
globular clusters: general, stars: variable: Cepheids, stars: abundances1. Introduction
The origin of the galactic halo has been an interesting question ever since halo stars and clusters became the defining objects of population II (Baade 1944, O’Connell 1958). Halo subdwarfs were soon recognized to be metal-poor (Chamberlain & Aller 1951), as were red giant stars branch (RGB) stars in glubular clusters of the halo (Helfer et al. 1959). Halo cepheids are now called Type II Cepheid (T2C) stars, and were first recognized by Joy (1937), and found to be metal-poor by Abt (1954) and Rodgers & Bell (1963). Short period cepheids were found in metal-poor globular clusters by Arp (1955), and catalogued by Clement et al. (2001).111The most recent update is to be found at http://www.astro.utoronto.ca/ cclement/cat/listngc.html
To the surprise of some, Woolley (1966) found that the halo cepheids showed thick disk kinematics and, hence, were likely to be only moderately metal-poor. The short period stars received the name BL Her, a star which has a period of 1.3 days, and is known to show a metallicity of –0.16 (Maas et al. 2007).
In an effort to further understand the T2C stars of the galactic halo, Maas et al. (2007) derived metallicities of 19 stars, 7 of which have periods of 3 days or less. Except of one star, UY Eri, they showed very modest depletions of heavy elements and, hence, fit the classification of BL Her stars. To further expand the database for T2C stars in the halo, we have obtained high resolution spectra of field T2C stars, 10 of which have periods below 3 days. The stars were selected to be bright enough for the available telescopes, and to be conveniently placed when observing time was assigned.
In this paper, we report on the chemical composition of the 10 T2C field stars with periods from 0.9 to 3 days. The upper limit marks the edge of an almost empty gap from 4 to 9 days in the distribution shown in Figure 1 of Soszyński et al. (2008) and Figure 6 of Schmidt et al. (2011). The separation of both cepheid strip candidates and Type II Cepheids into metal-normal and metal-poor stars can be seen in Figure 8 of Schmidt et al. (2011).
Star P(days) Telescope JD (2400000+) Exp (s) Phase (K) (km s-1) [Fe/H] Remarks UY CrB 0.929 APO 53162.6736 3600 0.491 6150 1.8 2.0 –0.43 APO 53456.9981 1800 0.245 6700 2.0 2.4 –0.32 APO 53626.7528 1800 0.839 6300 2.5 2.0 –0.47 NSV 10788 1.081 VLT 56124.7937 1200 0.451 6250 2.3 2.8 –2.41 V716 Oph 1.116 APO 52336.9382 1200 0.154 7000 1.8 2.7 –1.64 APO 52417.7674 1800 0.595 6100 2.2 2.6 –1.67 APO 52447.6805 1800 0.380 6600 2.6 2.6 –1.56 APO 52448.6667 1800 0.284 6700 2.2 2.6 –1.72 APO 52449.7423 1800 0.248 6750 2.0 2.3 –1.62 BF Ser 1.165 APO 52336.8431 2400 0.652 5800 1.0 2.3 –2.15 APO 52417.7090 1800 0.038 7300 2.2 3.0 –2.04 APO 52804.7590 900 0.145 7000 2.0 3.0 –2.08 H double or emission APO 53457.8495 1800 0.526 6300 2.1 2.2 –2.04 H double or emission BL Her 1.307 APO 53163.8646 900 0.104 7000 2.2 2.2 –0.12 OHP 49572.3784 900 0.147 6650 2.5 2.2 –0.20 XX Vir 1.348 APO 52417.6479 1800 0.070 7500 2.2 2.3 –1.62 APO 52449.7188 1800 0.858 6100 2.5 2.8 –1.51 APO 53541.6750 1800 0.791 … … … … V1287 Sco 1.956 VLT 56126.4862 1500 0.487 5950 2.2 3.5 –1.94 H emission V553 Cen 2.061 ESO 56748.6532 90 0.818 6060 2.2 2.7 0.01 see Wallerstein & Gonzalez (1996) UY Eri 2.213 APO 52984.7985 1800 0.889 6400 2.0 2.0 –1.83 H emiss or double APO 53687.7856 1800 0.511 6200 1.8 2.6 –1.66 APO 54044.7828 1800 0.809 6000 1.9 2.6 –1.70 H emission AU Peg 2.402 APO 53626.7292 900 0.848 6008 2.0 2.8 0.33 orbit phase = 0.538 APO 53687.6390 900 0.109 5544 1.5 2.3 0.21 orbit phase = 0.681
-
Remarks:
(a) – NSV 10788 is a star with P = 1.08 days and a metallicity of [Fe/H] = –2.4. The lightcurve shows an amplitude of 0.5 magnitudes. Thus, classification of this star as a cepheid is uncertain.
(b) – For BF Ser, all four spectra were taken at important phases. This star is very likely a member of the UY Eri group. It is a metal poor-star with a pulsation period of 1.2 days.
(c) – XX Vir is a high latitude star of the UY Eri group with a short pulsation period of 1.3 days. For one spectrum, with emission in iron lines, the chemical composition was not determined.
(d) – V1287 Sco is a variable star of UY Eri type. There is not much information in the literature about this star. H emission is seen in the spectrum. The lines are slightly asymmetric.
(e) – V553 Cen is a star recognized by Lloyd Evans (1983) as a rare C-rich Cephied. Its composition was investigated by Wallerstein & Gonzalez (1998).
(f) – AU Peg is a spectroscopic binary (Harris et al., 1984) with an orbital period of 53.3 days. The chemical composition of this star was studied by Harris et al. (1984) and Maas et al. (2007). It appears to be slightly metal rich, which may be due in part to mass transfer from its unobserved companion.
2. Observations and Data Reduction
Seven objects were observed with the 3.5-m telescope at the Apache Point Observatory with the ARC Echelle Spectrograph (ARCES). By using a prism as a cross-disperser, the APO echelle captures the entire spectrum from 3500 Å to 10 400 Å with a resolving power of 31 500. However, the red-sensitive 2048x2048 chip has decreasing sensitivity for cool stars at shorter wavelengths and beyond 9000 Å. The observations were obtained as a part of a program to derive the chemical composition of certain Type II Cepheids and RR Lyrae stars. The exposure times were approximately 10–30 minutes. The estimated S/N ratio per pixel at the continuum level, depending upon the wavelength interval, is approximately 80–150. The uncertainty in the determination of velocities is a few tenths of a km s-1.
Two objects were observed with the cross-dispersed echelle spectrograph, UVES, at the Very Large Telescope.222Based on observations collected at the European Organization for Astronomical Research in the Southern Hemisphere under ESO programme 089.D-0489(A). The red arm was used, which covers the wavelength region between 4200 Å and 11 000 Å. Standard instrumental settings were used to achieve wavelength coverage from 4790–5760 Å and 5830–6810 Å with a resolution of 0.16 Å. The observations were done in service mode. For some objects, several spectra were obtained. The exposure times were approximately 20–30 minutes. The primary data reduction, such as bias subtraction, flat-field correction, wavelength calibration, sky subtraction and spectra extraction was performed with the UVES pipeline (Ballester et al. 2000).
One object, the carbon cepheid, V553 Cen, was taken from the ESO archive. The star was observed with the echelle spectrograph HARPS at the ESO La Silla 3.6-m telescope. The spectral range is 4000–6800 Å with a resolving power of 100 000. For BL Her, an additional spectrum was taken from the archive of the Elodie spectrograph at the Observatoire de Haute-Provence 1.93-m telescope (R=40 000, 4000-6800 Å). The observed stars and their atmospheric parameters are given in Table 1.
3. Spectroscopic Analysis
To determine the effective temperature, Teff, we used the line depth ratio method of Kovtyukh (2007). The uncertainties in this method range from 30–100 K depending on the S/N. To set the value, we required that the iron abundance, as determined from lines of FeI and FeII, be equal.
Elemental abundances were determined using LTE and NLTE approximations combined with atmospheric models by Castelli & Kurucz (2004), computed for the parameters of each star. The solar abundances were computed for lines from the solar spectrum (Kurucz et al., 1984) with from the Vienna Atomic Line Database (VALD) (Kupka et al., 1999), and the solar model by Castelli & Kurucz (2004). They are listed in Lemasle et al. (2015).
| Lambda | ||
|---|---|---|
| Sodium | ||
| 5682.63 | 2.09 | –0.71 |
| 5688.19 | 2.10 | –0.41 |
| 6154.23 | 2.09 | –1.56 |
| 6160.75 | 2.10 | –1.26 |
| Oxygen | ||
| 6300.30 | 0.00 | –9.717 |
| 7771.94 | 9.11 | 0.369 |
| 7774.17 | 9.11 | 0.223 |
| 7775.39 | 9.11 | 0.001 |
| 8446.25 | 9.52 | –0.462 |
| 8446.36 | 9.52 | 0.236 |
| 8446.76 | 9.52 | 0.014 |
3.1. Oxygen
The NLTE model of the oxygen atom was first described by Mishenina et al. (2000), and then updated by Korotin et al. (2014). The model consists of 51 OI levels of singlet, triplet, and quintet systems, and the ground level of the OII ion. Fine structure splitting was taken into account only for the ground level and the 3p5P level (the upper level of the 7772,4,5 triplet lines). A total of 248 bound-bound transitions were included. Oxygen line parameters are listed in Table 2. The high excitation OI triplet suffers from departure from LTE (Parsons 1964, Altrock 1968, Amarsi et al. 2016). Its strength depends sensitively on the star’s surface gravity. In stars of high luminosity, the triplet is greatly enhanced since radiative effects dominate recombination and ionization, as compared to collisional excitation, which is controlled by the local temperature.
3.2. Sodium
Sodium line parameters are given in Table 2. We derived the sodium abundances by line profile fitting. The NLTE atomic model of sodium was presented by Korotin & Mishenina (1999) and then updated by Dobrovolskas et al. (2014). The updated sodium model currently consists of twenty energy levels of NaI and the ground level of NaII. In total, 46 radiative transitions were taken into account for the calculation of the population of all levels. For four stars, the Na D lines were saturated, so we used the pair of lines at 5682 Å and 5688 Å. For stars with nearly solar metallicity, we used the weaker pair at 6154 Å and 6160 Å. We chose not to use the 8183 Å and 8194 Å lines due to blending with absorption by atmospheric lines, which depends on the stellar radial velocity and the humidity above the observatory.
The results of the abundance analysis on our program stars is given in Table 3.
4. Discussion
The T2C stars have been divided into W Vir stars with periods from 9 to 30 Days (though stars with periods greater than 20 days often show mild RV Tau properties); and the BL Her stars with periods less than 3 days.333The gap from 3 to 9 days is violated by variable 3 in the globular cluster M10. We advocate for the separation of the 1–3 day stars into the BL Her group with near-solar metallicity, and the distinctly metal-poor group that we will call the UY Eri class. The latter are to be found also in metal-poor globular clusters (Clement et al., 2001). The relatively metal-rich globulars with [Fe/H] –1.0 do not have cepheids with periods less than 3 days. Of 10 stars in Table 1, 6 fall into the metal poor UY Eri group, all of which show [Fe/H] –1.5.
Our database may be enhanced by including the abundances in Maas et al. (2007). Just by chance, all of their short period stars, except for UY Eri, fall into the more metal-rich BL Her class. Hence, we have combined the two sources to develop mean abundance ratios for the BL Her subgroup, and used only our data for the metal-poor UY Eri group. Our abundance data are summarized in Table 4.
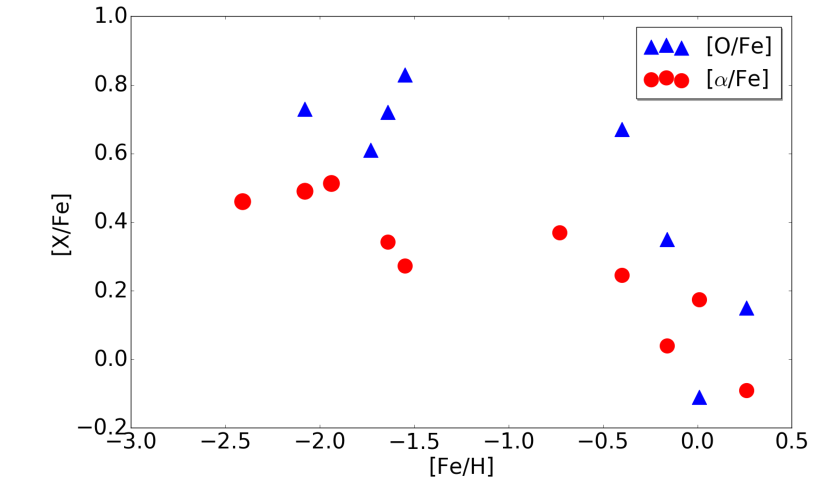
For our small sample, formal probable errors are less indicative of the accuracy of a quantity than one might hope. Hence, we show the dependence of [O/Fe] and the dependence of [/Fe] on [Fe/H] in Figure 1, using the elements Mg, Si, Ca, and Ti. The dependence of [O/Fe] on [Fe/H] shows a dependence that is similar to what is seen in both giants and dwarfs, with a rise of [O/Fe] from near 0.0 at [Fe/H] = 0.0 to +0.7 between [Fe/H] = –1.5 to –2.5. For [/Fe], the pattern is similar to many other investigations of the -elements, rising from near 0.0 to +0.5 for the metal-poor UY Eri Group.
The metal-rich BL Her group show abundances of 22 elements that differ little in their ratios relative to iron, with the possible exception of sodium. For the UY Eri group, the abundances of oxygen, and the -elements from Mg to Ti show excesses that are comparable to the excesses in most metal-poor red giants and main sequence stars.
We await the discovery and observation of additional T2C stars by Gaia and eventually the Large Synoptic Survey Telescope (LSST). The Gaia spectra in the 8400–8800 Å region may be used to derive metallicities from the strenth of the Ca II IR triplet as has been calibrated for RR Lyrae stars by Wallerstein et al. (2012).
4.1. Carbon, Nitrogen, and Oxygen
There are a few CI lines of high excitation in these stars. Despite our NLTE analyses, the scatter of [C/Fe] is too great to consider the mean values of [C/Fe] to be definitive. A significant excess in [N/Fe] for the BL Her stars is approximately what is expected from the enhancement of nitrogen by the CNO cycle and internal mixing. For the metal-poor UY Eri stars, the nitrogen lines are too weak for analysis. For oxygen, the analysis depends upon the OI triplet at 7772,4,5 Å and the 8446.63 Å lines. As we have shown in Figure 1, for the metal-poor UY Eri stars, the mean excess in [O/Fe] is , which is typical for metal-poor stars.
4.2. Light Elements
For sodium, we see small excesses that are approximately equal to their uncertanties for both groups of stars. In most, if not all, globular clusters, some red giants show a significant excess of sodium in second generation stars (Carretta et al., 2009). Our abundances are based on the lines arising from the 2.1 eV excited level. We did not use the Na D lines because they are usually too strong and are sometimes blended with circumstellar or interstellar lines. For the alpha elements, Mg, Si, Ca, and Ti, the BL Her stars do not show a difference in their abundances to that of iron, as is usually seen in stars with near-solar metallicity. S is omitted from the -elements because its lines are too weak for analysis, except in UY Eri. For the UY Eri stars, we find a mean value of [/Fe] = which is typical of metal-poor stars.
P, days
[Fe/H]
C
O
Na
Mg
Al
Si
S
Ca
Sc
Ti
UY CrB
0.929
–0.40
0.65
0.67
0.52
0.31
0.35
0.24
0.25
0.20
0.01
0.23
NSV 10788
1.081
–2.41
…
…
…
0.52
…
…
…
0.49
0.27
0.37
V716 Oph
1.116
–1.64
0.43
0.72
0.36
0.21
…
0.14
…
0.53
0.23
0.49
BF Ser
1.165
–2.08
0.13
0.73
…
0.31
…
…
…
0.75
0.20
0.41
BL Her
1.307
–0.16
0.36
0.35
0.63
0.01
0.00
–0.01
0.10
0.01
0.06
0.15
XX Vir
1.348
–1.55
…
0.83
…
0.19
…
0.05
…
0.46
0.26
0.39
V1287 Sco
1.956
–1.94
…
…
…
0.55
…
…
…
0.52
0.25
0.47
V553 Cen
2.061
0.01
0.78
–0.11
0.43
0.19
0.12
0.00
0.10
0.23
0.28
0.28
UY Eri
2.213
–1.73
–0.19
0.61
0.18
0.37
…
0.06
0.33
0.60
0.06
0.45
AU Peg
2.402
0.26
0.17
0.15
–0.04
–0.07
0.18
–0.11
0.15
–0.14
–0.27
–0.04
5. Conclusions
We have found that the T2C stars with periods of 1–3 days may be divided into a nearly normal metal group, usually called BL Her stars, and a newly recognized group with [Fe/H] = –1.5 to –2.4. The BL Her group probably belong to the thick disk, while latter are similar to short period cepheids in metal-poor globular clusters. With a few exceptions, it appears that globulars with [Fe/H] –1.0 do not have cepheid members of any metallicity.
The relationship of globular clusters and the general halo of our galaxy is not clear. Martell et al. (2016) have shown that only a very small percentage of the general halo could have come from the evaporation of stars from globular clusters. Since all stars seem to form in groups and clusters, it is possible that the single halo stars are descendents of small, loose clusters no longer recognizable as such. In addition, the populations of variable stars in the halo and globulars are not the same.
We thank Giuseppe Bono, Charli Sakari, and Joanne Hughes for reading the manuscript and making some good suggestions. This research has been supported by the Kennilworth Fund of the New York Community Trust.
| Element | MeanBL | MeanUY | Mean∣BL-UY∣ | ||
|---|---|---|---|---|---|
| O | 0.24 | 0.29 | 0.72 | 0.27 | 0.48 |
| Na | 0.37 | 0.26 | 0.27 | 0.20 | 0.10 |
| Mg | 0.08 | 0.16 | 0.35 | 0.20 | 0.27 |
| Si | 0.02 | 0.13 | 0.13 | 0.14 | 0.11 |
| S | 0.14 | 0.07 | 0.50 | 0.26 | 0.36 |
| Ca | 0.05 | 0.16 | 0.54 | 0.26 | 0.49 |
| Ti | 0.14 | 0.13 | 0.41 | 0.17 | 0.27 |
| Fe/H | –0.07 | 0.24 | –1.89 | 0.29 | 1.82 |
References
- Abt (1954) Abt, H. A. 1954, ApJS, 1, 63
- Altrock (1968) R. C. Altrock. PhD thesis, UNIVERSITY OF COLORADO AT BOULDER., 1968.
- Amarsi et al. (2016) A. M. Amarsi, M. Asplund, R. Collet, and J. Leenaarts. MNRAS, 455:3735–3751, February 2016.
- Arp (1955) Arp, H. C. 1955, AJ, 60, 1
- Baade (1944) Baade, W. 1944, ApJ, 100, 137
- Ballester et al. (2000) P. Ballester, A. Modigliani, O. Boitquin, S. Cristiani, R. Hanuschik, A. Kaufer, and S. Wolf. The Messenger, 101:31–36, September 2000.
- Carretta et al. (2009) E. Carretta, A. Bragaglia, R. G. Gratton, S. Lucatello, G. Catanzaro, F. Leone, M. Bellazzini, R. Claudi, V. D’Orazi, Y. Momany, S. Ortolani, E. Pancino, G. Piotto, A. Recio-Blanco, and E. Sabbi. A&A, 505:117–138, October 2009.
- Castelli & Kurucz (2004) Castelli, F., & Kurucz, R. L. 2004
- Chamberlain & Aller (1951) Chamberlain, J. W., & Aller, L. H. 1951, ApJ, 114, 52
- Clement et al. (2001) C. M. Clement, A. Muzzin, Q. Dufton, T. Ponnampalam, J. Wang, J. Burford, A. Richardson, T. Rosebery, J. Rowe, and H. S. Hogg. AJ, 122:2587–2599, November 2001.
- Dobrovolskas et al. (2014) V. Dobrovolskas, A. Kučinskas, P. Bonifacio, S. A. Korotin, M. Steffen, L. Sbordone, E. Caffau, H.-G. Ludwig, F. Royer, and D. Prakapavičius. A&A, 565:A121, May 2014.
- Harris et al. (1984) H. C. Harris, E. W. Olszewski, and G. Wallerstein. AJ, 89:119–125, January 1984.
- Helfer et al. (1959) Helfer, H. L., Wallerstein, G., & Greenstein, J. L. 1959, ApJ, 129, 700
- Joy (1937) A. H. Joy. ApJ, 86:363, Novermber 1937.
- Korotin & Mishenina (1999) S. A. Korotin and T. V. Mishenina. Astronomy Reports, 43:533–539, August 1999.
- Korotin et al. (2014) S. A. Korotin, S. M. Andrievsky, R. E. Luck, J. R. D. Lépine, W. J. Maciel, and V. V. Kovtyukh. MNRAS, 444:3301–3307, November 2014.
- Kovtyukh (2007) V. V. Kovtyukh. MNRAS, 378:617–624, June 2007.
- Kupka et al. (1999) F. Kupka, N. Piskunov, T. A. Ryabchikova, H. C. Stempels, and W. W. Weiss. A&AS, 138:119–133, July 1999.
- Kurucz et al. (1984) R. L. Kurucz, I. Furenlid, J. Brault, and L. Testerman. National Solar Observatory Atlas, Sunspot, New Mexico: National Solar Observatory 1984.
- Lemasle et al. (2015) B. Lemasle, V. Kovtyukh, G. Bono, P. François, I. Saviane, I. Yegorova, K. Genovali, L. Inno, G. Galazutdinov, and R. da Silva. A&A, 579:A47, July 2015.
- Lloyd Evans (1983) T. Lloyd Evans. The Observatory, 103:276–279, December 1983.
- Maas et al. (2007) T. Maas, S. Giridhar, and D. L. Lambert. ApJ, 666:378–392, September 2007.
- Martell et al. (2016) S. L. Martell, M. D. Shetrone, S. Lucatello, R. P. Schiavon, S. Mészáros, C. Allende Prieto, D. A. García-Hernández, T. C. Beers, and D. L. Nidever. ApJ, 825:146, July 2016.
- Mishenina et al. (2000) T. V. Mishenina, S. A. Korotin, V. G. Klochkova, and V. E. Panchuk. A&A, 353:978–986, January 2000.
- O’Connell (1958) O’Connell, D. J. K. Ricerche Astronomiche, 5:1958.
- Parsons (1964) S. B. Parsons. ApJ, 140:853, October 1964.
- Rodgers & Bell (1963) Rodgers, A. W., & Bell, R. A. 1963, MNRAS, 125, 487
- Schmidt et al. (2011) E. G. Schmidt, D. Rogalla, and L. Thacker-Lynn. AJ, 141:53, February 2011.
- Soszyński et al. (2008) I. Soszyński, A. Udalski, M. K. Szymański, M. Kubiak, G. Pietrzyński, Ł. Wyrzykowski, O. Szewczyk, K. Ulaczyk, and R. Poleski. Acta Astron., 58:293, December 2008.
- Wallerstein & Gonzalez (1996) G. Wallerstein and G. Gonzalez. MNRAS, 282:1236–1246, October 1996.
- Wallerstein & Gonzalez (1998) G. Wallerstein and G. Gonzalez. In P. A. Bradley and J. A. Guzik, editors, A Half Century of Stellar Pulsation Interpretation, volume 135 of Astronomical Society of the Pacific Conference Series, page 36, 1998.
- Wallerstein et al. (2012) G. Wallerstein, T. Gomez, and W. Huang. Ap&SS, 341:89–92, September 2012.
- Woolley (1966) R. Woolley. The Observatory, 86:76–78, April 1966.